

Signal Analysis Research (SAR) Group - RNet - Ryerson University
Signal Analysis Research (SAR) Group - RNet - Ryerson University
Signal Analysis Research (SAR) Group - RNet - Ryerson University

Create successful ePaper yourself
Turn your PDF publications into a flip-book with our unique Google optimized e-Paper software.
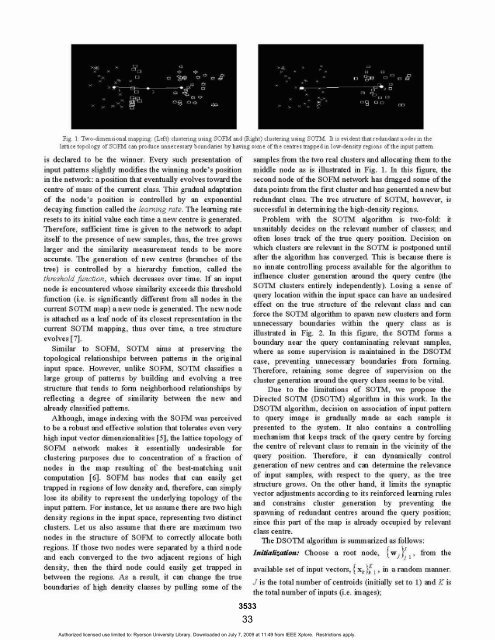
Fig 1 Two-dimensional mapping (Left) clustering using SOFM and @ ight) clustering using SOTM. It is evident that redundant nodes in the<br />
lattice topology of SOFIA can produce unnecessary boundmes by having some of the centres trapped in low-density regions of the input pattern<br />
is declared to be the winner. Every such presentation of<br />
input patterns slightly modifies the winning node's position<br />
in the network: aposition that eventually evolves toward the<br />
centre of mass of the current class. This gradual adaptation<br />
of the node's position is controlled by an exponential<br />
decaying function called the kearnzng rate. The learning rate<br />
resets to its initial value each time a new centre is generated.<br />
Therefore, sufficient time is given to the network to adapt<br />
itself to the presence of new samples, thus, the tree grows<br />
larger and the similarity measurement tends to be more<br />
accurate. The generation of new centres (branches of the<br />
tree) is controlled by a hierarchy function, called the<br />
th~shokd~nction, which decreases over time. If an input<br />
node is encountered whose similarity exceeds this threshold<br />
function (i.e. is significantly different from all nodes in the<br />
current SOTM map) a new node is generated. The new node<br />
is attached as a leaf node of its closest representation in the<br />
current SOTM mapping, thus over time, a tree structure<br />
evolves [q.<br />
Similar to SOFM, SOTM aims at preserving the<br />
topological relationships between patterns in the original<br />
input space. However, unlike SOFM, SOTM classifies a<br />
large group of patterns by building and evolving a tree<br />
structure that tends to form neighborhood relationships by<br />
reflecting a degree of similarity between the new and<br />
already classified patterns.<br />
Although, image indexing with the SOFM was perceived<br />
to be a robust and effective solution that tolerates even very<br />
high input vector dimensionalities [5], the lattice topology of<br />
SOFM network makes it essentially undesirable for<br />
clustering purposes due to concentration of a fraction of<br />
nodes in the map resulting of the best-matching unit<br />
computation [6]. SOFM has nodes that can easily get<br />
trapped in regions of low density and, therefore, can simply<br />
lose its ability to represent the underlying topology of the<br />
input pattern. For instance, let us assume there are two high<br />
density regions in the input space, representing two distinct<br />
clusters. Let us also assume that there are maximum two<br />
nodes in the structure of SOFM to correctly allocate both<br />
regions. If those two nodes were separated by a third node<br />
and each converged to the two adjacent regions of high<br />
density, then the third node could easily get trapped in<br />
between the regions. As a result, it can change the true<br />
boundaries of high density classes by pulling some of the<br />
3533<br />
33<br />
samples from the two real clusters and allocating them to the<br />
middle node as is illustrated in Fig. 1. In this figure, the<br />
second node of the SOFM network has dragged some of the<br />
data points from the first cluster and has generated a new but<br />
redundant class. The tree structure of SOTM, however, is<br />
succesdul in determining the high-density regions.<br />
Problem with the SOTM algorithm is two-fold: it<br />
unsuitably decides on the relevant number of classes; and<br />
often loses track of the true query position. Decision on<br />
which clusters are relevant in the SOTM is postponed until<br />
after the algorithm has converged. This is because there is<br />
no innate controlling process available for the algorithm to<br />
influence cluster generation around the query centre (the<br />
SOTM clusters entirely independently). Losing a sense of<br />
query location within the input space can have an undesired<br />
effect on the true structure of the relevant class and can<br />
force the SOTM algorithm to spawn new clusters and form<br />
unnecessary boundaries within the query class as is<br />
illustrated in Fig. 2. In this figure, the SOTM forms a<br />
boundary near the query contaminating relevant samples,<br />
where as some supervision is maintained in the DSOTM<br />
case, preventing unnecessary boundaries fiom forming.<br />
Therefore, retaining some degree of supervision on the<br />
cluster generation around the query class seems to be vital.<br />
Due to the limitations of SOTM, we propose the<br />
Directed SOTM (DSOTM) algorithm in this work. In the<br />
DSOTM algorithm, decision on association of input pattern<br />
to query image is gradually made as each sample is<br />
presented to the system. It also contains a controlling<br />
mechanism that keeps track of the query centre by forcing<br />
the centre of relevant class to remain in the vicinity of the<br />
query position. Therefore, it can dynamically control<br />
generation of new centres and can determine the relevance<br />
of input samples, with respect to the query, as the tree<br />
structure grows. On the other hand, it limits the synaptic<br />
vector adjustments according to its reinforced learning rules<br />
and constrains cluster generation by preventing the<br />
spawning of redundant centres around the query position;<br />
since this part of the map is already occupied by relevant<br />
class centre.<br />
The DSOTM algorithm is summarized as follows:<br />
InihkEzrslion: Choose a mot node, {u3t fTom the<br />
available set of input vectors, { xk)f , in a random manner.<br />
J is the total number of centroids (initially set to 1) and K is<br />
the total number of inputs (i.e. images);<br />
Authorized licensed use limited to: <strong>Ryerson</strong> <strong>University</strong> Library. Downloaded on July 7, 2009 at 11:49 from IEEE Xplore. Restrictions apply.