Download - Sutron Corporation
Download - Sutron Corporation
Download - Sutron Corporation

Create successful ePaper yourself
Turn your PDF publications into a flip-book with our unique Google optimized e-Paper software.
Radar Level Recorder<br />
RLR-0001-1 RLR-0003-1<br />
Operations & Maintenance Manual<br />
Part No. 8800-1169<br />
Revision: 02.02<br />
January 24, 2013<br />
22400 Davis Drive Sterling, VA 20164 (703) 406-2800 (703) 406-2801 Fax www.sutron.com sales@sutron.com page 1<br />
GS-25F604D SBSA NESDIS Certified ISO Certified <strong>Sutron</strong> is an authorized Iridium ® Value Added Reseller (VAR). 2/4/2013
Bringing the Benefits of Real-Time Data Collection to the World<br />
2
INTRODUCTION ............................................................................................................................................ 6<br />
FEATURES ....................................................................................................................................................... 7<br />
UNPACKING ................................................................................................................................................... 8<br />
CABLING ......................................................................................................................................................... 9<br />
RLR-0003-1 ................................................................................................................................................... 9<br />
TERMINAL BLOCK – RLR-0001-1 ................................................................................................................... 9<br />
Power Connections .................................................................................................................................. 10<br />
SDI-12 Connections ................................................................................................................................. 10<br />
DB9 CONNECTOR ......................................................................................................................................... 10<br />
QUICK INSTALL .......................................................................................................................................... 11<br />
STANDALONE QUICK INSTALL ...................................................................................................................... 12<br />
QUICK INSTALL WITH A LOGGER ................................................................................................................... 12<br />
Redundant Data Collection...................................................................................................................... 12<br />
SETUP AND OPERATION .......................................................................................................................... 13<br />
OVERVIEW .................................................................................................................................................... 13<br />
STARTING THE RADAR ................................................................................................................................... 13<br />
STAGE, DISTANCE TO WATER, AND MEASUREMENT POINT .......................................................................... 14<br />
SETTING STAGE............................................................................................................................................. 14<br />
MEASURING STAGE ....................................................................................................................................... 15<br />
Signal Strength ......................................................................................................................................... 15<br />
Stage Details ............................................................................................................................................ 15<br />
Stage Units ............................................................................................................................................... 15<br />
Right Digits .............................................................................................................................................. 15<br />
Automeasure ............................................................................................................................................ 16<br />
Operating Modes ..................................................................................................................................... 16<br />
Averaging Time ........................................................................................................................................ 17<br />
Averaging ................................................................................................................................................. 17<br />
DQAP ....................................................................................................................................................... 17<br />
Sample Form Period ................................................................................................................................ 17<br />
LAST AUTOMEASURED ................................................................................................................................. 18<br />
DISCHARGE ................................................................................................................................................... 18<br />
LOGGING ....................................................................................................................................................... 18<br />
Events ....................................................................................................................................................... 19<br />
Logged Measurement Time ...................................................................................................................... 19<br />
Log Daily Values ..................................................................................................................................... 19<br />
SETUP ........................................................................................................................................................... 19<br />
CONNECTING RADAR TO A LOGGER .............................................................................................................. 19<br />
Satlink and Radar .................................................................................................................................... 20<br />
STATION NAME ............................................................................................................................................. 20<br />
RADAR TIME ................................................................................................................................................. 20<br />
WDID .......................................................................................................................................................... 20<br />
BATTERY VOLTAGE ...................................................................................................................................... 20<br />
PASSWORD .................................................................................................................................................... 21<br />
DIAGNOSTICS ................................................................................................................................................ 21<br />
Raw Radar Sensor Data........................................................................................................................... 21<br />
Subsamples............................................................................................................................................... 21<br />
Lock/Unlock Quality Engine .................................................................................................................... 21<br />
DEFAULT, MAX, MIN SETTINGS .................................................................................................................... 23<br />
FRONT PANEL INTERFACE ..................................................................................................................... 24<br />
Bringing the Benefits of Real-Time Data Collection to the World<br />
3
NAVIGATING THE MENUS.............................................................................................................................. 24<br />
TURNING DISPLAY ON/OFF ........................................................................................................................... 24<br />
BACKLIGHT ................................................................................................................................................... 24<br />
CONTRAST .................................................................................................................................................... 24<br />
VIEWING CURRENT DATA ............................................................................................................................. 25<br />
Understanding the “?” indicator. ............................................................................................................ 25<br />
VIEWING LOGGED DATA ............................................................................................................................... 25<br />
FRONT PANEL MENU TREE .................................................................................................................... 26<br />
SDI-12 SENSOR OPERATION .................................................................................................................... 28<br />
SDI-12 REFERENCE ...................................................................................................................................... 28<br />
XXS Generic Change Radar Setup Command ..................................................................................... 33<br />
RS232 COMMAND LINE INTERFACE .................................................................................................... 34<br />
RS232 SETUP ................................................................................................................................................ 34<br />
MACHINE TO MACHINE COMMUNICATION .................................................................................................... 34<br />
VIEWING STAGE ............................................................................................................................................ 34<br />
DOWNLOADING THE LOG .............................................................................................................................. 35<br />
AUTO OUTPUT .............................................................................................................................................. 35<br />
TARGET MODE ............................................................................................................................................. 35<br />
RS232 COMMAND REFERENCE ..................................................................................................................... 35<br />
List of commands ..................................................................................................................................... 36<br />
List of setup variables .............................................................................................................................. 38<br />
List of calibration setup variables ........................................................................................................... 38<br />
SETUP TRANSFER VIA HYPERTERMINAL ....................................................................................................... 38<br />
CONNECTING A MODEM ................................................................................................................................ 38<br />
Xpert-Xlite Modem 8080-0005 ................................................................................................................ 39<br />
Raven Modem .......................................................................................................................................... 39<br />
DISCHARGE ................................................................................................................................................. 41<br />
WHAT THE RADAR CAN DO FOR YOU .......................................................................................................... 41<br />
DISCHARGE SETUP SEQUENCE ...................................................................................................................... 41<br />
CORRECTLY RECORDING DISCHARGE ........................................................................................................... 41<br />
Enabling The Computation ...................................................................................................................... 41<br />
Selecting the Calculation Type ................................................................................................................ 42<br />
Entering the Coefficients .......................................................................................................................... 44<br />
INSTALLATION ........................................................................................................................................... 46<br />
ELECTRICAL CONNECTIONS: ......................................................................................................................... 46<br />
MOUNT THE RADAR ...................................................................................................................................... 46<br />
TARGETING THE RADAR ................................................................................................................................ 46<br />
FIRMWARE UPGRADE .............................................................................................................................. 48<br />
METHODS FOR UPGRADE:.............................................................................................................................. 48<br />
Method 1: Using ‘UPGRADE’ command using Hyperterm: .................................................................. 48<br />
Method 2: Using Hyperterm and ‘Escape’ key: ..................................................................................... 48<br />
GPS .................................................................................................................................................................. 49<br />
TIMEKEEPING ................................................................................................................................................ 49<br />
GPS INSTALLATION AND SETUP .................................................................................................................... 49<br />
GPS POSITIONING ......................................................................................................................................... 49<br />
GPS OPERATION ........................................................................................................................................... 50<br />
GPS ERRORS ................................................................................................................................................ 50<br />
JUMPERS ....................................................................................................................................................... 50<br />
RJ45 TO RS232 CONNECTOR ........................................................................................................................ 51<br />
Bringing the Benefits of Real-Time Data Collection to the World<br />
4
MODBUS ........................................................................................................................................................ 53<br />
MODBUS MENU OPTIONS.............................................................................................................................. 53<br />
Modbus Enabled ...................................................................................................................................... 53<br />
Modbus Device ID ................................................................................................................................... 53<br />
Modbus Protocol ...................................................................................................................................... 53<br />
Modbus Parity .......................................................................................................................................... 53<br />
Modbus Delay before Tx .......................................................................................................................... 54<br />
Modbus Delay after Tx ............................................................................................................................. 54<br />
Modbus Baud Rate ................................................................................................................................... 54<br />
MODBUS FUNCTION CODES .......................................................................................................................... 54<br />
Identifying Registers ................................................................................................................................ 54<br />
GET LOG COMMAND ..................................................................................................................................... 57<br />
APPENDIX A – SPECIFICATIONS FOR THE RADAR ......................................................................... 58<br />
ORDERING INFORMATION ............................................................................................................................. 59<br />
APPENDIX B – SUTRON RLR COMMUNICATOR ............................................................................... 60<br />
QUICK INSTRUCTIONS FOR RLR COMMUNICATOR ........................................................................................ 60<br />
UNDERSTANDING SUTRON RADAR SWEEPS .................................................................................................. 61<br />
APPENDIX C – SUTRON CUSTOMER SERVICE POLICY .................................................................. 62<br />
APPENDIX D – COMMERCIAL WARRANTY ....................................................................................... 63<br />
SUTRON MANUFACTURED EQUIPMENT ............................................................................................ 63<br />
NON-SUTRON MANUFACTURED EQUIPMENT .................................................................................. 63<br />
REPAIR AND RETURN POLICY .............................................................................................................. 63<br />
EXTENDED WARRANTY AND ON-SITE MAINTENANCE ................................................................. 63<br />
APPENDIX E – FCC INFORMATION....................................................................................................... 64<br />
INDEX............................................................................................................................................................. 65<br />
Bringing the Benefits of Real-Time Data Collection to the World<br />
5
Introduction<br />
<strong>Sutron</strong>’s Radar Level Gauge/Recorders are self-contained, precision devices for measuring stages (water<br />
level) without direct contact with the water surface. The Radar Level Recorder is ideally suited for making<br />
measurements in rivers, streams, reservoirs, tidal, oceans and industrial areas where the sensor can be located<br />
above the water surface. Using a special pulse-echo measurement technique, the radar has a range of 60 ft.<br />
<strong>Sutron</strong> offers both NTIA and FCC versions of the Radar. The FCC versions are available for any commercial<br />
or government agency in need of the device. This version has an FCC ID and is available for installation<br />
anywhere it is needed as an FCC part 15 device. The NTIA version is available only to US government<br />
agencies and for use outside the US. US government agencies who need to use this version must have it<br />
approved for operation by their own frequency coordinators. Both radars offer similar performance;<br />
however, the NTIA version does have increased signal to noise for quicker measurements and better<br />
performance with rough water.<br />
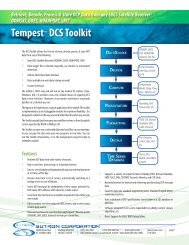
The Radar comes in several different models. The RLR-0001-1 (NTIA only) combines into a single package<br />
radar, antenna, keypad, display, permanent log, SDI-12 interface, RS232 interface. The RLR-0001-1 is<br />
packaged in sealed enclosure; however, the enclosure is not rugged enough to be installed outdoors without<br />
additional protection.<br />
The RLR-0003-1 (FCC and NTIA) is an integrated unit without display. The enclosure is rugged and can be<br />
installed outdoors without additional protection. All the electronics for the radar are housed in the antenna<br />
enclosure. A 25 foot weather-proof detachable cable provides both RS232 and SDI-12 interfaces to the radar.<br />
RLR-0001-1 RLR-0003-1<br />
Bringing the Benefits of Real-Time Data Collection to the World<br />
6
The radars that have a front panel that allow a user to setup the operating parameters, monitor performance<br />
and perform tests via the front panel.<br />
The radar is both a sensor and a logger, allowing for stand-alone and integrated applications. The log inside<br />
radar is capable of holding more than 300 000 readings, and allows the recording of status and stage (stage)<br />
data. The radar has an SDI-12 interface as well as RS232 so it can provide data to data loggers or<br />
communications equipment.<br />
All radars provide an RS232 port that supports a simple command line mode compatible with HyperTerminal<br />
and other communications programs to display data from the log and perform some essential operating<br />
functions. It is possible to connect the radar to a modem or radio.<br />
Features<br />
Non-contact measurement of stage (water level).<br />
Low power consumption (
Unpacking<br />
Remove the Radar from the shipping container and visually inspect the unit for signs of damage during<br />
shipment. Report any such damage to the factory immediately to ensure a prompt response and resolution.<br />
Retain one shipping container in the event a factory return is necessary.<br />
Please note that if a return is required, a return material authorization (RMA) number is required. To get this<br />
RMA number, call the <strong>Sutron</strong> Customer Service Department at (703) 406-2800.<br />
Bringing the Benefits of Real-Time Data Collection to the World<br />
8
Cabling<br />
RLR-0003-1<br />
The RLR-0003-1 comes with quick disconnect interface cable already connected. The interface cable<br />
provides both SDI-12 and RS232 communications. DO NOT open the radar enclosure during the course of<br />
installation or maintenance as the water tight seal may be broken. The DB9 is wired as described on the<br />
following page. The SDI and power wiring is as follows:<br />
Color Description Notes<br />
WHITE SDI Data To Data Logger SDI-12 Data<br />
RED SDI +12V To Data Logger SDI-12 Power<br />
BLACK SDI GND To Data Logger SDI-12 Ground<br />
Terminal Block – RLR-0001-1<br />
The following table contains the pin descriptions for the terminal block. You must open the radar enclosure<br />
to access this terminal block:<br />
Terminal Block Description Notes<br />
1 Earth Earth<br />
2 Data SDI-12<br />
3 +12V SDI-12<br />
4 GND SDI-12<br />
5<br />
6<br />
7 Battery +12V<br />
8 Battery GND<br />
Battery power<br />
-- Not needed<br />
when powered<br />
via SDI-12<br />
Battery power<br />
-- Not needed<br />
when powered<br />
via SDI-12<br />
Pin 1<br />
Bringing the Benefits of Real-Time Data Collection to the World<br />
9<br />
Pin 8
Power Connections<br />
The radar requires external +12V power to operate. Power may be given via the battery connector (pins 7<br />
and 8), and /or via the SDI-12 connector (pins 3 and 4). When both sets of connections are used, the<br />
radar will operate off either power source. This allows a redundant power source for the radar. The<br />
two sets of power connections are separate – current will not flow from one to the other.<br />
Use wire that is at least 24 gauge.<br />
When using the radar with a Satlink or other logger, you may use the SDI-12 power connection with or<br />
without the battery connection.<br />
Please note that the radar battery voltage (page 20) measurement will measure the higher of the two voltages<br />
(battery and SDI-12) that can be supplied to it.<br />
SDI-12 Connections<br />
The SDI-12 interface has only 3 connections – GND, +12V and Data. The connections are made to the<br />
terminal block as given in the table above and as shown in the above picture. Wire all three connections<br />
directly to the SDI-12 connections on a compatible data logger. The sensor is shipped to respond to SDI-12<br />
address 0 (the address can be changed via the front panel). See the section titled SDI-12 Sensor Operation on<br />
page 28 for more details.<br />
Note that if operating without a logger, nothing need be connected to the SDI-12 pins.<br />
DB9 Connector<br />
The radar comes with a DB9F connector for connection to RS-232 devices. The DB9F can be connected to<br />
the serial port on most PCs using a straight cable. A null modem adapter is needed to connect to most PDAs<br />
and modems. This connector allows for access to the command line interface (see page 34) using a terminal<br />
program. Some modems (see page 38) and radios can be connected to this port. A logger can be<br />
programmed to use this port.<br />
The following table shows the pin assignments of the DB9F connector.<br />
DB9F Pin Name Notes<br />
1 N/C No Connection<br />
2 RXD Data from Radar<br />
3 TXD Data to the radar<br />
4 DTR Signal to the radar<br />
5 Ground<br />
6<br />
(only in RLR-0001-1) DSR<br />
Signal from unit, asserted as long as unit has<br />
power<br />
7 RTS Request to Send, signal to the radar<br />
8 CTS Clear to Send, signal from the radar<br />
9<br />
(only in RLR-0001-1) VOUT<br />
Jumper J8 selectable for 5V (default) or VBAT<br />
(100ma max) - this line is usually NOT passed by<br />
a null modem<br />
Bringing the Benefits of Real-Time Data Collection to the World<br />
10
Quick Install<br />
It is very important to properly install the radar sensor. The RLR-0001-1 radar is designed to mount with the<br />
front panel display facing up. In this orientation, the radar antenna points down to the water surface. You<br />
may switch the orientation of the antenna by opening the enclosure and changing the mounting plate so the<br />
antenna points to the side of the enclosure. Do not install the RLR-0001-1 outdoors without an additional<br />
protective enclosure.<br />
The radar should be installed such that the radar foot print is not obstructed to the maximum extent. If the<br />
radar is being installed under a bridge, the radar should be placed away from the piers to minimize<br />
obstruction to the radar. Also, a radar should be installed at a location where exposed areas of the stream bed<br />
is minimal.<br />
The RLR-0003-1 is designed with a 5/8” bolt for connection to a mounting arm. The bolt and the swivel<br />
bracket can be adjusted to allow the radar to point directly to the water surface no matter what the angle is of<br />
the mounting arm. The adjustments are made by loosening the two screws in the sides of the swivel bracket<br />
and also rotating the bracket relative to the bolt.<br />
5/8" bolt<br />
Swivel bracket<br />
Bringing the Benefits of Real-Time Data Collection to the World<br />
11
Mount the radar directly above the water surface, such that the radar beam is perpendicular to the<br />
water. The radar will not operate well if the beam strikes the water at an angle or if there objects other than<br />
the water that will reflect the signals from the radar. A circular level is provided to simplify the process of<br />
pointing the antenna at the water surface. For more details on the antenna beamwidth see Targeting the Radar<br />
on page 46. Keep in mind that the range of the sensor is up to 60 feet with a minimum of 5 feet.<br />
After setting up the radar above the water’s surface and providing power to the unit, use the front panel to<br />
bring up the Diagnostic > Signal Quality menu (press the up arrow several times until “Diagnostic” is<br />
displayed, then press right). Adjust the antenna pointing to the water surface for a peak signal. You may find<br />
the command line TARGET mode useful for setting up the Radar. Additionally, RLR communicator program<br />
can be used to visualize the radio path seen by <strong>Sutron</strong> Radar. The RLR communicator's radio path or sweep<br />
display will show the reflections the radar is seeing and is a great tool to quickly identify whether stationary<br />
objects like pier on a bridge is causing the radar to register incorrect targets.<br />
Once the radar is properly mounted and indicates a good signal strength, set the stage. The stage is the first<br />
item shown on the front panel after power-up. Once the stage is shown, press set, enter the new stage, and<br />
press set again. After a few seconds, the radar will show the entered stage. Ensure that ? is not shown. If ? is<br />
shown, it means the radar does not have a good signal. Please see page 14 for more details on setting the<br />
stage.<br />
Standalone Quick Install<br />
The radar starts measuring and collecting data as soon as it is powered up. By default, the radar will measure<br />
and log stage every 15 minutes; each reading is averaged for 10 seconds. All of these settings and more can<br />
be changed – please refer to page 16 to learn more about how the radar measures.<br />
Quick Install with a Logger<br />
Radar can be connected to other devices via either SDI-12 and RS232.<br />
For SDI-12 operation, connect the three wire interface to the properly labeled pins on the radar and<br />
setup the logger to periodically collect data from the sensor. The first parameter of the M! command<br />
will provide the stage. For more details on SDI-12, please refer to the SDI-12 Sensor Operation<br />
section on page 28.<br />
If connecting using the RS232 port, the data can be polled from the radar, or it can be automatically<br />
output by the radar. Setup the connected device (which may be a logger, a modem, or even a direct<br />
connection to a PC running HyperTerminal) for 115200 baud, 8 data bits, no parity (the baud rate<br />
can be changed via the front panel Setup > Other Settings > Baud Rate).<br />
To poll for data, have the connected device issue a carriage return, wait for prompt, issue the<br />
ASCII command “!MEAS” followed by a carriage return, and capture the returned data. The<br />
first data item returned is the stage.<br />
To capture data, setup the radar for auto output via the front panel Setup > Other Settings ><br />
Auto Output. Once setup, the radar will periodically output the stage in ASCII.<br />
Please refer to the section RS232 Command Line Interface on page 34 for more details.<br />
Redundant Data Collection<br />
Connect the radar via SDI-12 to a logger and setup the logger to get data from the radar.<br />
For RLR-0001-1 RLR-0003-1 REVH models only, provide a redundant power supply to the radar<br />
(via the Battery connector).<br />
With this setup, if the logger malfunctions, the radar will keep on collecting data.<br />
Bringing the Benefits of Real-Time Data Collection to the World<br />
12
Setup and Operation<br />
Overview<br />
Radar operates as both a sensor and a logger. As a sensor, it is capable of performing stage measurements.<br />
As a logger, it is capable of recording those stage measurements.<br />
Radar will measure and log data as long as it has power, regardless of whether it is connected to a logger.<br />
This ensures that data is not lost if the logger malfunctions.<br />
The digital SDI-12 interface allows for a standardized connection to a logger. SDI-12 also provides power to<br />
the radar. For full details on SDI-12, please refer to the section on page 28.<br />
The radar can be attached to a telemetry device, such as a modem, via its RS232 port. Radar allows full<br />
access to status, setup and data via the RS232 port, using the command line interface (detailed on page 34).<br />
Loggers that do not support SDI-12 should interface via the RS232 port.<br />
The front panel offers a means of viewing data, status, and configuring the unit. Please see page 24 for<br />
details. The RLR-0003-1 without a front panel can be setup and operated via the RS232 and/or SDI-12<br />
interfaces.<br />
Starting the radar<br />
The radar starts operating as soon as power is applied. On models with displays, the green LED will flash<br />
occasionally to let you know that the radar is operational. The Radar cannot be stopped from measuring<br />
without removing power from it.<br />
Green LED flashes every several seconds to indicate the radar is operating normally<br />
Red LED flashes if the radar has encountered a problem<br />
When the radar first starts, it may display the message “Calculating…” on the LCD. This means that the<br />
radar is in the process of taking a measurement. This message will be displayed for as long as it takes to<br />
make one measurement (see Averaging Time). The message “Error in Reading” means that the radar was<br />
unable to get valid signals from the radar.<br />
Bringing the Benefits of Real-Time Data Collection to the World<br />
13
Stage, Distance to Water, and Measurement Point<br />
Ultimately, the job the radar is to compute a stage measurement. However, the direct measurement made by<br />
the radar is distance to water.<br />
Distance to water is the length between the radar and the water surface.<br />
Stage is the depth of water; for a river it is distance between the water surface and the riverbed.<br />
Stage = Measurement point – Distance to water<br />
Measurement point is the length between the radar and the riverbed (or ocean floor or well bottom).<br />
(NOTE: Calibration of the radar unit has been made with respect to the front cover of the<br />
antenna unit.)<br />
Bridge or Structure over Water<br />
Stage Reading:<br />
Riverbed:<br />
Measuring Point:<br />
Staff<br />
Gauge<br />
Water Level (Stage)<br />
Stage<br />
Distance to Water<br />
Measuring Point = Stage + Distance to Water<br />
or<br />
Stage = Measuring Point – Distance to Water<br />
Stage is displayed on the first menu shown on the front panel. Via command line, use the “MEAS” command<br />
or the “LAST” command. Via SDI-12, use the M command.<br />
Measurement point can be accessed via the front panel Station setup > Measurement Setup > Measurement<br />
point, via SDI-12 using the XE command, and the command line MEASURING POINT.<br />
Setting Stage<br />
When the radar is installed, you will typically read the current stage off a staff gauge and then set this new<br />
stage into the radar.<br />
To set the stage via front panel, power up the radar, wait for it to show a stage reading (which will be negative<br />
until the stage is set), and the press SET. Enter the correct stage and press set again. Don’t forget to change<br />
the sign of the stage to “+”. It is also possible to use SDI-12 XS command and command line STAGE to set<br />
the stage.<br />
The radar compares this user entered value with its own reading and uses it to set the Measuring Point. From<br />
then on, the radar will report the stage relative to this Measuring Point – so it will match the staff gauge.<br />
Bringing the Benefits of Real-Time Data Collection to the World<br />
14
Alternatively, if you know the exact elevation of the radar, you can enter this elevation as the Measuring Point<br />
and the radar will automatically display the stage relative to this elevation.<br />
Measuring Stage<br />
The radar takes multiple samples and computes a stage from them. Each sample is itself the average of<br />
millions of radar pulses to the water surface and as such has a quality reading and signal strength associated<br />
with it. If the radar is not getting a good reflection from the water surface, the quality of the sample will be<br />
bad. If less than half of the samples were good, the quality will be set to bad. The user controls when the<br />
samples are collected and how the average is computed through the Measurement Setup settings. Please see<br />
sections on Operating Modes, Averaging and Sample Form Period for further details.<br />
A bad quality is indicated with a “?” after the reading if using the front panel. The command line interface<br />
will say ‘error’, and SDI-12 will indicate an invalid reading. In addition, the red LED will flash and the front<br />
panel will show ‘Error in reading’ if the last reading was invalid. Logged data will be marked as invalid..<br />
To see the stage, use the first menu shown on the front panel. Via command line, use the “MEAS” command.<br />
Via SDI-12, use the M command.<br />
Signal Strength<br />
The radar gives a signal strength expressed as a percentage 0 to 100%. The higher the number, the better the<br />
signal. Signal strength can be viewed via the front panel Diagnostic > Signal Strength.<br />
Stage Details<br />
In addition to providing a stage, the radar sensor can provide additional details:<br />
average signal strength<br />
standard deviation (of good samples)<br />
number of good samples<br />
total number of samples<br />
These details can be viewed by pressing right when viewing the stage via front panel. Also, command lines<br />
MEAS and LAST, and SDI-12 M2 will reveal stage details.<br />
In order to log all these details, make sure to enable the measurement setup field Station Setup ><br />
Measurement Setup > Log Stage Details.<br />
Stage Units<br />
Radar can report stage readings in feet, meters, centimeters or millimeters. Please use Station Setup ><br />
Measurement Setup > Stage units to change the units. Units are logged along with stage. They are also<br />
shown on the front panel and reported with the results of SDI-12 and command line measurements.<br />
Right Digits<br />
The number of digits shown after the decimal place is referred to as the Right Digits. If you would like the<br />
stage to read 10.12 rather than 10.12345, set the right digits to 2.<br />
Bringing the Benefits of Real-Time Data Collection to the World<br />
15
Automeasure<br />
Automeasure refers to the radar’s ability to automatically measure and log stage data. The user can determine<br />
when this will occur by changing Station Setup > Measurement Setup > Automeasure Interval and Offset<br />
settings. Automeasure cannot be turned off.<br />
Automeasure time and interval determine when the radar measures and logs data.<br />
E.g. Automeasure time 00:00:00 interval 00:10:00<br />
00:10:00 data measured and logged<br />
00:20:00 data measured and logged<br />
00:30:00 data measured and logged<br />
and every ten minutes afterwards…<br />
E.g. Automeasure time 00:00:30 interval 00:05:00<br />
00:00:30 data measured and logged<br />
00:05:30 data measured and logged<br />
00:10:30 data measured and logged<br />
and every five minutes afterwards...<br />
The last automeasured data can be accessed via SDI-12 and command line – please see page 18.<br />
Operating Modes<br />
There are two operating modes: normal and continuous:<br />
In normal mode, radar spends its time in low power mode until it is time to measure or a<br />
measurement is requested via the front panel, RS232 or SDI-12. Once the measurement is complete,<br />
radar goes back to low power mode. This is the most commonly used mode and is recommended<br />
unless the radar will be measuring very frequently.<br />
In the continuous mode, radar is constantly collecting data. When it is time to measure, radar will<br />
use the previously collected data to instantly come up with a stage reading. The radar does not go<br />
into low power in continuous mode. The continuous mode adds about 10 mA to the quiescent power<br />
consumption compared with 0.25mA in the normal mode. Please note that Radar can hold only<br />
180 samples in continuous mode. If the averaging time and the sample form period are such that<br />
more than 180 samples are collected, the system will only use the last 180 samples. For example, if<br />
the averaging time is 10 minutes, and the sample form period is one second, the radar compute the r<br />
based on three and not ten minutes worth of data. Normal mode is unaffected by this limitation.<br />
Continuous mode has been disabled from firmware version 1.43used in RLR-0003-1 REVF<br />
model.<br />
These examples illustrate the difference between continuous and normal modes:<br />
Normal mode with 10 second averaging:<br />
1. 12:00:00 measure command is received (via SDI-12, front panel, RS232, or automeasure)<br />
2. 12:00:00 sensors are powered on and measurement starts<br />
3. 12:00:11 measurement completes with data collected between 12:00:00 and 12:00:10<br />
4. 12:00:11 sensors are powered down<br />
Continuous mode with 10 second averaging (sensors are powered on all the time):<br />
1. 12:00:00 measure command is received (via SDI-12, front panel, RS232, or automeasure)<br />
2. 12:00:00 measurement completes with data collected from 11:59:50 to 12:00:00<br />
Desired Effect Appropriate Mode<br />
Low power consumption Normal mode<br />
Low power consumption and immediately ready data Normal mode, use last measured readings (page 18)<br />
Immediately ready and current data Continuous mode<br />
Very frequent measurements (every 15 seconds or less) Continuous mode<br />
More than 180 samples Normal mode<br />
Operating mode can be changed via front panel Station Setup > Measurement Setup > Operating Mode, via<br />
SDI-12 XOM and via OPERATING MODE command line<br />
Bringing the Benefits of Real-Time Data Collection to the World<br />
16
Averaging Time<br />
Every time the radar measures it will collect samples for a user defined period (Station Setup > Measurement<br />
Setup > Averaging Time) in order to produce a stage reading. The setting avg time determines how long to<br />
collect samples for. Averaging time can be changed via SDI-12 XT, and via AVG TIME command line.<br />
In addition to the averaging time, the sample form period can be adjusted, allowing for control of the number<br />
of samples collected. The sample form period determines how often each sample is collected.<br />
Two methods are offered for computing a stage from multiple samples: averaging and DQAP.<br />
Averaging<br />
Adding all the (good) samples and dividing the sum by the number of (good) samples will provide<br />
the average distance to water. In addition to the averaged distance to water, radar will also provide<br />
the average signal strength, the standard deviation of the good samples, the total number of samples<br />
and the number of good samples. Finally, the quality of the stage will be set to good if at least half<br />
of the samples were good. In order to log all these details, make sure to enable the measurement<br />
setup field log water details. They can also be accessed via command line or SDI-12.<br />
Averaging is enabled by default. If DQAP is disabled, averaging is enabled (Station Setup ><br />
Measurement Setup > DQAP Enable).<br />
DQAP<br />
DQAP is a method defined by the NOS (National Ocean Service) of computing the stage that is<br />
designed to eliminate erroneous values from the calculation. With DQAP, the distance to water is<br />
calculated using two computations:<br />
For the first computation, the average and standard deviation of all the samples are calculated.<br />
Then, two limits are figured: the average plus/minus three times the computed standard deviation.<br />
Each sample is then compared against the two limits. If the sample is outside the limits, it will not<br />
be used in the final computation.<br />
In the final computation, the average and standard deviation are recomputed from all the samples<br />
remaining from the first calculation. The quality of the stage reading will be set to good if at least<br />
half of the samples were selected for the secondary computation; it will be set to bad otherwise. The<br />
good sample count of the stage reading will be set to the number of samples selected for the<br />
secondary computation.<br />
To enable DQAP, use the Station Setup > Measurement Setup > DQAP Enable menu. If DQAP is<br />
enabled, averaging is disabled.<br />
Sample Form Period<br />
As mentioned in measuring stage, each sample of the stage is actually the average of millions or radar pulses<br />
to the water. The sample form period value controls how much raw radar data to include in each sample.<br />
The default value for sample form period is 1.0 second. Do not change this value without consulting with the<br />
factory. The quality of the sample depends on the number of good subsamples collected. If there are not<br />
enough good subsamples, the quality is set to bad.<br />
The details of each sample can be viewed in the diagnostic menu. The details consist of distance to water,<br />
standard deviation, number of good and number of total subsamples, sample validity, signal strength,<br />
minimum and maximum. Each sample may be logged by activating log every sample setting.<br />
Log entry Description<br />
Sample Min The minimum distance to water<br />
Sample Max The maximum distance to water<br />
Sample Avg The average distance to water<br />
Sample StdDev The standard deviation of all the subsamples<br />
Sample Good Subs The number of valid subsamples included in the average<br />
Sample Total Subs The total number of subsamples collected (only the good subsamples are included in<br />
computation)<br />
Bringing the Benefits of Real-Time Data Collection to the World<br />
17
Last Automeasured<br />
Stage measurements made by the radar are not instantaneous; how long they take depends on averaging time<br />
(page 17). When a logger is communicating with the radar, it can ask the radar to make a new measurement.<br />
However, the logger then has to wait for the radar to complete the measurement.<br />
If the user desires data that is instantly available, the radar can provide the last measured data. The radar<br />
automatically measures based on the automeasure interval (see page 16) . That data can be retrieved as the<br />
last measured data.<br />
For example, if radar is setup to automeasure every 10 minutes, with an averaging time of 10 seconds:<br />
12:00:00 to 12:00:10 radar measures stage<br />
12:01:00 logger asks for last measured data; radar immediately returns 12:00:10 data<br />
12:10:00 to 12:10:10 radar measures stage<br />
12:11:00 logger asks for last measured data; radar immediately returns 12:10:10 data<br />
If the user desires data that is both immediately available and current, continuous mode (page 16) is the way<br />
to go.<br />
Last measured data can be accessed via SDI-12 M3 and via LAST command.<br />
Discharge<br />
Discharge is a measurement of water volume flowing over time. Please refer to the discharge section on page<br />
41 for complete details.<br />
Logging<br />
A secure flash chip in the radar provides a logging capacity of more than 300,000 entries. Data will not be<br />
lost if power is removed. There is not a means of erasing data from the log. Once the log is full, the oldest<br />
data will be overwritten.<br />
Each log entry consists of<br />
date and time (with a second resolution)<br />
name of the logged entry<br />
measurement reading (optional)<br />
measurement quality and units (optional)<br />
The format of logged data is the <strong>Sutron</strong> Standard CSV format which was introduced in the Summer of 2009.<br />
It is a format common to current <strong>Sutron</strong> products.<br />
The general format specification for <strong>Sutron</strong> Standard CSV format is<br />
mm/dd/yyyy,hh:mm:ss,label,data[,units,qual][,label,data[,units,qual]]<br />
Here are several examples of log entries:<br />
01/19/2010,09:21:49,Reset Powerup,1<br />
01/19/2010,09:30:00,Stage,1.25,feet<br />
01/19/2010,09:45:00,Stage,1.27,feet<br />
01/19/2010,09:50:27,Setup Change<br />
Minimally, radar will log stage and various events. The user can decide how often to log stage (via<br />
automeasure settings see page 15), and the user can chose to log stage details (via front panel, access Station<br />
Setup>Measurement Setup>Log Stage Details), which consist of signal strength, standard deviation of<br />
samples, number of good and total samples.<br />
Bringing the Benefits of Real-Time Data Collection to the World<br />
18
Events<br />
Occasionally, the radar will log events. Events are used to help troubleshoot the data.<br />
The following actions will cause the radar to log an event:<br />
Setup change (whenever any setting is changed)<br />
Log download (whenever the log is downloaded)<br />
Display On and Display off (whenever the user wakes the unit up by pressing a button)<br />
Command line enter (whenever the user connects via the RS232 port)<br />
Reset (log contains reset type and count)<br />
Errors (such as low battery and sensor failure)<br />
Before cal and after cal (logged whenever the user sets the stage to record the stage before and after<br />
the calibration)<br />
Log in events (if password is enabled), including failure to log in.<br />
The log can be examined via the front panel (the Logged Data menu), or downloaded via command line<br />
(using the LOG command). SDI-12 does not provide access to the log.<br />
Logged Measurement Time<br />
Measurements are not instant. Once initiated, a radar measurement will take the user defined averaging time<br />
plus some overhead to complete. For example, a measurement that starts at 12:00:00, with an averaging time<br />
of 10 seconds will complete at about 12:00:11. That measurement will be logged with 12:00:00 as the<br />
timestamp. The timestamp of the logged measurement is the time the measurement was started.<br />
Log Daily Values<br />
The Radar log the battery voltage into at 23:59:59 each day. Whether it does is controlled by the log daily<br />
values setting (Station Setup > Other Setup > Log Daily Values).<br />
Setup<br />
The radar’s setup is stored in secure memory, meaning it will not be lost if power is removed (for any time<br />
period). The setup of the radar is broken into sections: Measurement Setup, Discharge Setup, and Other<br />
Setup. All setup can be changed through any interface: SDI-12, front panel or RS232 command line.<br />
Setting the setup to defaults (Station Setup > Other Setup > Default Setup) will reset all the settings to factory<br />
defaults.<br />
Connecting Radar to a Logger<br />
The radar will measure on its own schedule regardless of whether it is connected to another logger. This<br />
ensures redundancy of logged data. If the connected logger malfunctions, the radar will keep collecting data.<br />
The digital SDI-12 interface allows for a standardized connection to a logger. SDI-12 also provides power to<br />
the radar. For full details on SDI-12, please refer to the section on page 28.<br />
The radar can be attached to a telemetry device, such as a modem, via its RS232 port. Radar allows full<br />
access to status, setup and data via the RS232 port, using the command line interface (detailed on page 34).<br />
Loggers that do not support SDI-12 should interface via the RS232 port.<br />
To ensure that the logs of the radar and the attached logger match (as far as stage goes), make sure that the<br />
automeasure time and interval of the radar are the same as the measurement time and interval of the logger.<br />
To set the radar’s time and interval, use the Station Setup > Measurement Setup > Automeasure Time and<br />
Automeasure Interval menus.<br />
Bringing the Benefits of Real-Time Data Collection to the World<br />
19
Ensure that the time of the radar and logger match by changing the time of either one (page 20).<br />
Satlink and Radar<br />
When connecting a radar to a Satlink, use the SDI-12 connection. Setup Satlink for an SDI-12 measurement<br />
(please see the Satlink manual for details). Make sure that Satlink measurement time and interval match the<br />
radar’s automeasure time and interval (Station Setup > Measurement Setup > Automeasure Time and<br />
Automeasure Interval).<br />
Satlink will automatically synchronize the radar’s clock via SDI-12. This will happen as soon as Satlink is<br />
started; Satlink will then periodically ensure that radar and Satlink clocks are in sync.<br />
Station Name<br />
The station name can be viewed and set via the front panel Station Name and Time or by using the STATION<br />
NAME command. The name is used to name the file when data is downloaded from the Radar.<br />
Radar Time<br />
Radar time can be viewed and set via the front panel Station Name and Time, via the front panel Station<br />
Name, via the SDI-12 XDT command, or by using the TIME command line.<br />
Radar sports an RTC (real time clock) backed by an internal battery. The RTC keep ticking even if the main<br />
battery to the radar is removed. The RTC will, at worst case drift ±2 minutes per month (0 to +50C). The<br />
lifetime of the RTC battery is about 5 years.<br />
WDID<br />
The WDID is a 7 character code given to stations. The code is included in ???<br />
Battery Voltage<br />
Radar can be powered via either the SDI-12 connector, the battery connector, or via both for redundant power<br />
(see page 9 for connection details). The two power connections are separate – current will not flow from one<br />
to the other.<br />
When reporting battery voltage, radar will report the higher of the two voltages (battery and SDI-12) that can<br />
be supplied to it. Battery voltage can be read from the front panel, SDI-12 M1 command, or BATT<br />
command.<br />
Bringing the Benefits of Real-Time Data Collection to the World<br />
20
Password<br />
You can enable password protection by configuring a password. If password protection is enabled, the user is<br />
allowed view setup and data. However, no changes to setup will be allowed until a password is entered. A<br />
password prompt will automatically appear whenever a setup change is attempted.<br />
Via front panel, go to Station Setup > Other Setup > Password. Press set and enter a password. Press set<br />
again and the password will be enabled.<br />
Using the command line, type "PASSWORD = XXX" to set password to XXX. Type "PASSWORD =" to<br />
disable password usage.<br />
To disable the password, enter a blank password.<br />
Logging out is accomplished by turning off the display, by typing EXIT in the command line, or by powering<br />
down the unit.<br />
SDI-12 is unaffected by password protection.<br />
If you forget the password and want to clear it, reset the unit and press and hold the DOWN key. You must<br />
keep the key pressed until you see the message “Password Cleared” appear on the front panel.<br />
Diagnostics<br />
This section provides details about how <strong>Sutron</strong>’s Radar Level Recorder computes stage based upon radar<br />
sensor data.<br />
The purpose of the radar level sensor is to produce a stage measurement. The measurement cycle consists of<br />
different processes. At the lowest level, raw signal data is acquired the radar sensor. That data is converted<br />
into a subsample. As multiple subsamples are collected, their data is analyzed and processed into a sample.<br />
Numerous samples are finally converted into a stage reading.<br />
Raw Radar Sensor Data<br />
Two measurements come from the radar sensor hardware: distance to water and signal strength. The distance<br />
to water signal coming from the radar sensor is a PWM signal, provided as a percentage. It is computed into<br />
distance to water in feet by multiplying it with the PWM Slope and adding the Factory Offset to it. The signal<br />
strength is expressed as a percent, and is recorded along with stage data.<br />
The diagnostic menu will show the raw PWM signal (expressed as a percentage) along with the signal<br />
strength.<br />
Subsamples<br />
Based upon raw sensor data and the history of previous sensor data, the radar will form a subsample. The<br />
subsamples are coming in at a rate of about 10 per second.<br />
Every new subsample gets checked to see if it is valid. The distance reading of every new subsample (in<br />
percent) is compared to PWM minimum (in percent) and PWM maximum (in percent). We will also compare<br />
the new subsample to the last good subsample and make sure the difference does not exceed the PWM Delta.<br />
The subsample diagnostic menu will show subsample details, including distance to water in PWM, signal<br />
strength, the state of the lock/unlock engine, along with a quality rating.<br />
Lock/Unlock Quality Engine<br />
In addition to checking each new subsample for quality, radar will monitor a brief history of the subsamples<br />
in order to determine the overall quality of the sensor signal. The term ‘unlock’ is used to mean that there is<br />
Bringing the Benefits of Real-Time Data Collection to the World<br />
21
inadequate sensor signal quality to make stage readings, and the term ‘lock’ means that there is good sensor<br />
signal quality. If, at the time when sample is created, the state is unlocked, that sample becomes invalid.<br />
The lock/unlock quality is dependent on these settings:<br />
Signal Lock Count: number of good subsamples required to change state to locked.<br />
Signal CBad Count: number of consecutive bad subsamples required to change the state to unlocked<br />
Signal Unlock Count: number of bad samples required to reset the quality engine a when unlocked<br />
The subsample diagnostic menu shows the state of the lock/unlock engine. Subsamples may be logged by<br />
activating log every subsample setting. Please note that since about 10 subsamples are created every second,<br />
the log will fill up in a matter of hours if this setting is enabled. When log every subsample is enabled, the<br />
log entry “Sub Duty” will record the PWM signal as a percentage. The log entry “Sub SigStr” will represent<br />
the signal strength (also a percentage). Additionally, the lock/unlock engine will report any changes with the<br />
log entry “Lock”. If the value logged with “Lock” is 1 it means the signal locked, a value of 0 means the<br />
signal unlocked, and a value of -1 means the engine restarted.<br />
Bringing the Benefits of Real-Time Data Collection to the World<br />
22
Default, Max, Min Settings<br />
The table below indicates the default settings and the maximum and minimum ranges it may be set to.<br />
Parameter<br />
Default Setting Minimum Maximum Comment<br />
Automeasure Interval 00:15:00 00:00:01 01:00:00<br />
Automeasure Time 00:00:00 00:00:00 23:59:59<br />
Operating Mode Normal 0 = Normal 1 = Continuous<br />
Avg Time 10.000 sec 0 900 seconds<br />
Right Digits 2 0 7<br />
Stage Units Feet 0 3 0=feet,1=m, 2=cm,<br />
3=mm<br />
Measuring Point 1.00000 feet -1000000.00499 1000000.00499 Indirectly set when<br />
user sets stage.<br />
DQAP Disabled 0=Disabled 1=Enabled<br />
Discharge Disabled 0=Disabled 1=Enabled<br />
Discharge Equation Parshall Flume 0=Disabled 1=Enabled<br />
Parshall Flume Width 12 inches 1 600 inches<br />
Coefficient A 1.0000000 -1000000.0049999 1000000.0049999<br />
Coefficient B 1.5000000 -1000000.0049999 1000000.0049999<br />
Gauge Height Shift 0.0000000 -1000000.0049999 1000000.0049999<br />
Weir Coefficient W 1.0000000 -1000000.0049999 1000000.0049999<br />
Station Name <strong>Sutron</strong> Radar 1 Char ASCII 24 char ASCII Numbers included<br />
WDID<br />
Auto Output Disabled 0=Disabled 1=Enabled<br />
Log Every Subsample Disabled 0=Disabled 1=Enabled<br />
Log Every Sample Disabled 0=Disabled 1=Enabled<br />
Log Level Details Disabled 0=Disabled 1=Enabled<br />
Log Daily Values Disabled 0=Disabled 1=Enabled<br />
Sample Form Period 1.0 sec 0.1 10000.0 Seconds<br />
PWM slope 0.755105 Contact Customer<br />
Factory Offset -1.2 Service for further<br />
information on<br />
SigStrCal 3.300 these items.<br />
Bringing the Benefits of Real-Time Data Collection to the World<br />
23
Front Panel Interface<br />
The radar features a two line LCD interface, six buttons and two LEDs. The front panel interface can be used<br />
to setup the radar, examine its status, view the current stage readings, and view logged data.<br />
Navigating the Menus<br />
The menu has a tree structure, like directories in an operating system.<br />
1. The radar menu tree (page 26) can be navigated with the arrow keys. Press ▲ (up) and ▼ (down) to<br />
browse the menu items that are on the same level. On certain menus, press ► (right) to enter a sub<br />
menu, and ◄ (left) to go up to the parent menu.<br />
2. Some menu items offer a means to change setup. To change a value press SET. The prompt will change<br />
and a flashing cursor will appear. You can then use the arrow keys to select a different value.<br />
3. Once you have the desired value on the display, press SET again to make the change permanent or to<br />
cancel a change, press the OFF/CANCEL button.<br />
4. In the case where there are only two possible values for a setting, pressing SET will flip-flop between the<br />
values and the change is made immediately.<br />
Front panel key functions<br />
RIGHT will navigate to a sub-menu (assuming there is one).<br />
LEFT will go back to the parent menu.<br />
UP and DOWN will navigate among the menus on the same level.<br />
SET starts a change or confirms an action.<br />
CANCEL cancels a change or action. The CANCEL key is also labeled OFF.<br />
CANCEL also goes back levels.<br />
Hold CANCEL to go to the top of the menu.<br />
Hold UP or DOWN to change contrast setting.<br />
Turning Display On/Off<br />
The radar will continue to measure and log data as long as a good battery is connected. The display turns off<br />
automatically after 5 minutes of inactivity in order to conserve power. The display can be turned on at any<br />
time by pressing any key.<br />
To turn off the display, press the OFF/Cancel button. You may need to press it several times to exit out of<br />
some menus first. Holding the OFF/Cancel button in any menu will turn off the display.<br />
Backlight<br />
The display is equipped with a backlight to assist in viewing in many different lighting conditions. The<br />
backlight will automatically turn on whenever the display is turned on.<br />
Contrast<br />
If it becomes difficult to read the display, you may need to adjust the contrast. To set the contrast, press and<br />
hold the UP or DOWN arrow buttons until you see the CONTRAST prompt and keep holding the button until<br />
the display is readable. If the display becomes too dark or too light, press the opposite arrow key to reverse<br />
the contrast. Once the display is readable, release the arrow, and this setting will be stored for the next time<br />
the display is turned on.<br />
Bringing the Benefits of Real-Time Data Collection to the World<br />
24
Viewing Current Data<br />
When the display is turned on, the last measured stage will display. The radar will then initiate a new<br />
measurement and display the results as soon as the measurement completes (which is based on averaging<br />
time).<br />
Understanding the “?” indicator.<br />
The radar displays a “?” after a value if there is a question about the quality of the data. This is most likely<br />
due to poor targeting of the radar (see Targeting the Radar on page 46). The “?” is a reminder that user<br />
action is needed for the station to be operational.<br />
If you are viewing the live stage, you may press right to see the details of the measurement. Details like<br />
signal strength and number of good samples may provide clues as to why the reading is bad.<br />
You can look at the events in the log to determine the exact time of the event that caused the questionable<br />
data. This can be used to help reconstruct the data should there be an error.<br />
Viewing Logged Data<br />
The radar will save the stage in its flash memory each time a measurement is made. To view logged data, use<br />
the down arrow to display the menu Logged Data. The press right, and press up/down to select the desired<br />
item (Logged Events, Entire Log) and press the right arrow. The last logged value for the item will be<br />
displayed along with the date/time, and units. Press the down arrow to go back in time and the up arrow to go<br />
forward. When you reach the end of the log, a message will be displayed. Continuing to press the arrow will<br />
wrap to the oldest or most recent values.<br />
Note: when viewing the log, the contrast adjustment is disabled so you can hold an arrow key to “scroll” up<br />
and down through the log.<br />
Bringing the Benefits of Real-Time Data Collection to the World<br />
25
Front Panel Menu Tree<br />
Errors (only show if errors are present)<br />
Hardware error details<br />
Stage (live) and time of reading -- Press set to calibrate<br />
Stage Details<br />
Distance to Water and signal strength (live)<br />
Discharge * (when discharge is enabled)<br />
Battery Voltage<br />
GPS* (when Garmin GPS is enabled)<br />
GPS Status<br />
GPS Time of Last Sync<br />
Local Time Offset<br />
Logged Data<br />
Stage<br />
Discharge * (when discharge is enabled)<br />
Logged Events<br />
All Logged Data<br />
Station Setup<br />
Measurement Setup<br />
Automeasure Interval<br />
Automeasure Time<br />
Operating Mode (Single | Continuous)<br />
Averaging Time<br />
Stage Units (feet | cm | m | mm)<br />
Right Digits<br />
Measurement Point<br />
DQAP Enable<br />
Log Stage Details<br />
Sample Form Period<br />
Discharge Setup<br />
Discharge Enable<br />
Discharge Equation ( Parshall | Weir | Generic )*<br />
Parshall Flume Width (Parshall equation only)*<br />
Weir Coefficient (weir equation only)*<br />
Coefficient A (generic equation only)*<br />
Coefficient B (generic equation only)*<br />
Gauge Height Shift*<br />
Modbus Settings<br />
Modbus Enable<br />
Modbus Device ID<br />
Modbus Protocol<br />
Modbus Parity<br />
Delay before Tx<br />
Delay after Tx<br />
Modbus BaudRate<br />
Other Setup<br />
Station Name<br />
WDID<br />
Garmin GPS<br />
Password<br />
Default Setup<br />
RS232 Baud Rate<br />
RS232 Wakeup<br />
Hardware Flow Ctrl<br />
Auto Output<br />
SDI-12 Address<br />
Bringing the Benefits of Real-Time Data Collection to the World<br />
26
Log Daily Values<br />
Diagnostics<br />
Signal Strength<br />
Raw Sensor Data<br />
Subsample<br />
Sample<br />
Distance<br />
Quality<br />
Min/Max<br />
Log Every Subsample<br />
Log Every Sample<br />
Software Version<br />
Station Name and Time<br />
Bringing the Benefits of Real-Time Data Collection to the World<br />
27
SDI-12 Sensor Operation<br />
The radar can function as an SDI-12 Sensor. This allows the radar to connect to another data logger or<br />
transmitter to provide the data when requested. If you are not using the radar with another data recorder or<br />
transmitter, you can skip this section.<br />
For details on SDI-12 wiring, please refer to page 10.<br />
The most common SDI-12 command used with the radar is the “M” measure command followed by the “D0”<br />
command. The “M” command requests the radar to make a measurement and the “D0” command gets the<br />
data. While there are a lot of other commands available, most users will simply use the M, D0 commands.<br />
Note: The radar ‘Mode’ of operation, i.e., Normal vs. Continuous Mode, will have an impact on the<br />
communication delays experienced with the SDI-12 operation. See section Operating Modes for more details<br />
on operation.<br />
The remainder of this section documents all the SDI-12 commands supported by the radar. Note that most<br />
any setting that can be changed from the front panel, can also be changed via SDI-12.<br />
Changing the SDI-12 address can be accomplished via the front panel (Station Setup > Other Setup > SDI-12<br />
Address).<br />
SDI-12 Reference<br />
The radar will respond to all standard SDI-12 commands. To use the SDI-12 commands you must have a<br />
data logger or interface that supports the SDI-12 standard. The radar is compliant with SDI-12 Specifications<br />
version 1.3. More details on the SDI-12 interface can be found at http://www.sdi-12.org.<br />
The general form of an SDI-12 command is:<br />
aC!<br />
where a is the sensor address 0-9,A-Z,a-z,*, ?. (Addresses * and ? will address any sensor, regardless<br />
of its address.)<br />
C is the command and ! is the last character of the command.<br />
The standard SDI commands are as follows<br />
Name Command(s) Response Example/Notes<br />
Acknowledge Active a! a<br />
I Send Identification aI! A13 SUTRON 1.0<br />
RLRXXXV1.21<br />
Where 1.0 is the board<br />
revision, V1.21 is the<br />
software revision<br />
A Change Address aAb! b<br />
? Address Query ?! a<br />
M<br />
MC<br />
C<br />
CC<br />
Measure Stage and<br />
discharge<br />
aM!<br />
aD0!<br />
atttn<br />
a<br />
+stage<br />
+discharge<br />
+units<br />
+distance<br />
+validity<br />
Bringing the Benefits of Real-Time Data Collection to the World<br />
28<br />
Returns stage in user set<br />
units, discharge (0 if<br />
disabled), units<br />
indicator, and validity.<br />
The validity can be 0valid,<br />
1-sensor failure,<br />
2-data old, 3-system not<br />
configured properly
M1<br />
MC1<br />
C1<br />
CC1<br />
M2<br />
MC2<br />
C2<br />
CC2<br />
M3<br />
MC3<br />
C3<br />
CC3<br />
M4<br />
MC4<br />
C4<br />
CC4<br />
M5<br />
MC5<br />
C5<br />
CC5<br />
M6<br />
MC6<br />
C6<br />
CC6<br />
M7<br />
MC7<br />
C7<br />
CC7<br />
Name Command(s) Response Example/Notes<br />
Measure Distance to<br />
Water and Battery<br />
Measure Stage, Return<br />
stage details<br />
Returns last<br />
automeasured stage and<br />
Related stage details.<br />
This command does not<br />
cause a measurement to<br />
be made.<br />
Return raw radar sensor<br />
readings<br />
Measures and returns<br />
radar subsample data.<br />
Measures and returns<br />
radar sample data.<br />
Return automeasured<br />
stage and discharge. This<br />
command does not cause<br />
a measurement to be<br />
made<br />
aM1!<br />
aD0!<br />
aM2!<br />
aD0!<br />
aM3!<br />
aD0!<br />
aM4!<br />
aD0!<br />
aM5!<br />
aD0!<br />
aM6!<br />
aD0!<br />
aM7!<br />
aD0!<br />
atttn<br />
a<br />
+distance<br />
+battery<br />
atttn<br />
a<br />
+stage<br />
+deviation<br />
+outliers<br />
+total count<br />
+signal strength<br />
+validity<br />
atttn<br />
a<br />
+stage<br />
+deviation<br />
+outliers<br />
+total count<br />
+signal strength<br />
+validity<br />
+age<br />
atttn<br />
a<br />
+duty cycle<br />
+signal strength<br />
atttn<br />
a<br />
+duty cycle<br />
+signal strength<br />
+ quality (0=not graded,<br />
1=good, 2=out of range,<br />
3=delta error, 4=sensor<br />
failure)<br />
+lock/unlock (1=locked)<br />
atttn<br />
a<br />
+distance<br />
+standard deviation<br />
+minimum<br />
+maximum<br />
+signal strength<br />
+good count<br />
+total count<br />
+quality (0=bad, 1=good)<br />
atttn<br />
a<br />
+stage<br />
+discharge<br />
+units<br />
+distance<br />
+validity<br />
+age<br />
Bringing the Benefits of Real-Time Data Collection to the World<br />
29<br />
Returns distance to<br />
water in feet and<br />
battery voltage.<br />
This command does not<br />
cause a measurement to<br />
be made. It returns the<br />
extended information<br />
for the last<br />
measurement.<br />
Age is the number of<br />
seconds since the<br />
measurement was made.<br />
Diagnostic command,<br />
not intended for field<br />
use.<br />
Diagnostic command,<br />
not intended for field<br />
use. May return more<br />
data than allowed by<br />
SDI-12 specification.<br />
Diagnostic command,<br />
not intended for field<br />
use. May return more<br />
data than allowed by<br />
SDI-12 specification.<br />
Age is the number of<br />
seconds since the<br />
measurement was made
M8<br />
MC8<br />
C8<br />
CC8<br />
Name Command(s) Response Example/Notes<br />
Returns last measured<br />
radar sample data (same<br />
as M6, but no new<br />
measurement is initiated)<br />
aM8!<br />
aD0!<br />
atttn<br />
a<br />
+distance<br />
+standard deviation<br />
+minimum<br />
+maximum<br />
+signal strength<br />
+good count<br />
+total count<br />
+quality (0=bad, 1=good)<br />
V Verification aV! Errcount+resets<br />
Bringing the Benefits of Real-Time Data Collection to the World<br />
30<br />
Diagnostic command,<br />
not intended for field<br />
use. May return more<br />
data than allowed by<br />
SDI-12 specification.<br />
Name Command(s) Response Example/Notes<br />
X? Request unknown<br />
address<br />
XAD Set SDI-12 address aXADnAn!<br />
n the new SDI-12<br />
address, repeated<br />
XE Set Measuring Point<br />
*X?! a<br />
Address of the sensor<br />
twice<br />
aXE+d+u!<br />
d is the Measuring<br />
Point in the units<br />
indicated by u.<br />
XS Set Stage aXS+d+u!<br />
d is the desired<br />
reading for the<br />
sensor and in the<br />
units indicated by u.<br />
The sensor will<br />
adjust the Measuring<br />
Point to ensure the<br />
reading matches the<br />
value entered.<br />
XOM Set/display<br />
operating mode<br />
aXOM+m!<br />
m is optional. Omit<br />
m to read the current<br />
mode, include it to<br />
change the mode.<br />
a0011<br />
no response if the addresses<br />
do not match<br />
attt1<br />
attt1<br />
attt1<br />
This command causes<br />
the radar to identify<br />
itself.<br />
Note: a D0 command<br />
issued after will return<br />
the new address.<br />
0XE+0+0<br />
(set the Measuring Point<br />
to 0 causing all stages to<br />
be inverse of the<br />
distance to water.)<br />
0XE+15.25+0<br />
(set the Measuring Point<br />
to 15.25ft)<br />
Note: a D0 command<br />
issued after XE is<br />
complete will display<br />
the new Measuring<br />
Point in the current units<br />
(as set by the XUP<br />
command).<br />
Example: 0XS+7.87+0<br />
(sensor is at 7.87 feet,<br />
adjust Measuring Point<br />
to ensure this reading)<br />
Note: a D0 command<br />
issued after XS is<br />
complete will display<br />
the Measuring Point in<br />
the current units (as set<br />
by the XUP command).<br />
Example: 0XOM+0!<br />
(puts device into single<br />
mode)<br />
Note: a D0 command<br />
issued after XS is
Name Command(s) Response Example/Notes<br />
XT Set/display<br />
averaging time<br />
XUP Set/display stage<br />
units & number of<br />
right digits<br />
m = 0, single mode,<br />
measure only when<br />
data is requested<br />
m = 1, continuous<br />
mode, measure<br />
continuously and<br />
provide data when<br />
requested.<br />
aXT+t!<br />
t is optional. Omit t<br />
to read the current<br />
value, include it to<br />
change.<br />
t = averaging time in<br />
seconds (0 to 900<br />
seconds)<br />
aXUP+n+d!<br />
Both n and d are<br />
optional. Include<br />
them if you want to<br />
change the values.<br />
n = 0 feet water<br />
n = 1 m water<br />
n = 2 cm of water<br />
n = 3 mm water<br />
d = number of<br />
places right of the<br />
decimal<br />
attt1<br />
attt2<br />
XFD Set factory defaults aXFD! a0011<br />
XOP Set/display auto<br />
serial output<br />
aXOP+a!<br />
a is optional.<br />
Include it to change<br />
the value.<br />
a = 0 disable output<br />
a = 1 enable output<br />
a0011<br />
Bringing the Benefits of Real-Time Data Collection to the World<br />
31<br />
complete will display<br />
the operating mode.<br />
(Continuous mode is<br />
disabled in version<br />
1.43)<br />
Example: 0XT+10!<br />
(sets the averaging time<br />
to 10 seconds)<br />
Note: A D0 command<br />
issued after will return<br />
the averaging time.<br />
Example: 0XUP+1+2!<br />
select m with 2 right<br />
digits<br />
Note: a D0 command<br />
issued after the XUP<br />
will return the value of<br />
the units that are<br />
selected and the number<br />
of digits right of the<br />
decimal point.<br />
Note: a D0 command<br />
issued after the XFD<br />
command will return the<br />
operating mode.<br />
Note: a D0 command<br />
issued after command<br />
will return the auto<br />
serial output.
Name Command(s) Response Example/Notes<br />
XDT Set/display date and aXDT!<br />
aYYYY/MM/DD<br />
Example set date time<br />
time<br />
HH:MM:SS+q+g<br />
command:<br />
this command reads<br />
0XDT2005/09/01<br />
the current time a is address<br />
13:15:00!<br />
YYYY is the year<br />
Sets the date to the 1st<br />
aXDTYYYY/MM/ MM is the month (01 to 12) of September2005, and<br />
DD HH:MM:SS! DD is the day of the month<br />
(01 to 31)<br />
the time to 1:15:00 PM.<br />
a is address HH is the hour (military time<br />
XDT is the<br />
0 to 23)<br />
command to set the MM is the minutes<br />
date and time SS is the seconds<br />
YYYY is the year q is a single digit that<br />
MM is the month indicates the quality of the<br />
(01 to 12)<br />
time. 0 means the time is<br />
DD is the day of the invalid. 1 can mean that time<br />
month (01 to 31) was set since boot up (if no<br />
HH is the hour GPS is present), or that the<br />
(military time 0 to time has been synced to the<br />
23)<br />
GPS in the last 12 hours (if a<br />
MM is the minutes GPS is present).<br />
SS is the seconds g is a single digit that<br />
indicates the presence of the<br />
GPS. 0 means no GPS is<br />
present, 1 means that a GPS is<br />
present.<br />
XXS Generic setup See page 33 for<br />
command<br />
details<br />
Bringing the Benefits of Real-Time Data Collection to the World<br />
32
XXS Generic Change Radar Setup Command<br />
This command is used to view and change all setup data in the unit. It is used in the following manner:<br />
XXS+s+n+v1+v2+v3+…+vx where<br />
s is the setup identifier and must be equal to 1<br />
n is the setup variable to start making changes at.<br />
v1 is the new value to write for the first variable<br />
v2 is the value to write for the next variable<br />
The setup variables are accessed using their order in the software meta variable map as seen in the following<br />
table. The values than can be used for any of the variables can be seen in the radar Settings and Radar<br />
Settings sections.<br />
1. Automeasure Interval<br />
2. Automeasure Time<br />
3. Operating Mode<br />
4. Avg Time<br />
5. Right Digits<br />
6. Stage Units<br />
7. Measuring Point<br />
8. DQAP Enable<br />
9. Discharge Enable<br />
10. Discharge Equation<br />
11. Parshall Width<br />
12. Coefficient A<br />
13. Coefficient B<br />
14. Gauge Height Shift<br />
15. Weir Coefficient W<br />
16. Station Name<br />
17. WDID<br />
18. Auto Output<br />
19. Log Every Subsample<br />
20. Log Every Sample<br />
21. Log Stage Details<br />
22. Log Daily Values<br />
23. Sample Form Period<br />
24. Garmin GPS Enable<br />
25. GPS Local Time Offset<br />
An example command to change the right digits to 5 is:<br />
XXS+1+5+5<br />
You can also change right digits to 6 and stage units to 2 together in the same command by typing:<br />
XXS+1+5+5+2<br />
To read a setup value, issue command XXS+1+n!, where n is the setup variable whose value you are<br />
interested in. For example, to read the current right digits, issue command XXS+1+5! and follow it up with a<br />
D0! command. The reply to D0 will have the right digits.<br />
Any settings that allow for a negative value can be set using a ‘-‘ as a delimiter.<br />
Changing the station name can use either a ‘+’ or ‘-‘ delimiter and may contain spaces:<br />
XXS+1+16+New Name would change the station name to “New Name”.<br />
Bringing the Benefits of Real-Time Data Collection to the World<br />
33
RS232 Command Line Interface<br />
The RS232 interface provides a simple way to connect the radar to PCs, modems and other communications<br />
devices. Details on the DB9 connector are on page 10.<br />
Microsoft Windows usually comes with a program called HyperTerminal. It can be found by going to the<br />
Windows start menu, Programs, Accessories, Communications.<br />
By default the RS232 interface operates at 115200 Baud, no parity, 8 data bits, 1 stop bit. Changing the baud<br />
rate can be done via the front panel: Station Setup > Other Settings > Baud Rate, or via the command line by<br />
typing “BAUD RATE”.<br />
If connecting to a PC, use a standard DB9 serial cable. If connecting to a modem or a logger, you are likely<br />
to need a null modem adapter.<br />
To start command line mode, send carriage return or line feed (or both). If using HyperTerminal or a similar<br />
program, simply press ENTER. Radar will respond with a prompt ><br />
Once in command line mode, type “HELP” to get a list of supported commands.<br />
RS232 Setup<br />
The setting RS232 Wakeup controls what is required to wake the unit up via the RS232 connection. The<br />
options are:<br />
Wake on RTS (default)<br />
Wake on DTR<br />
Wake on either RTS or DTR<br />
Always on<br />
If setup to wake on RTS, DTR, and RTS or DTR, the connected device must assert said line for<br />
communication to work. At least half a second needs to occur between the assertion of the correct control<br />
line and the start of communication (automatically done by HyperTerminal). The unit can also be setup to be<br />
always on, which increases power consumption but requires neither RTS nor DTR to establish RS232<br />
communication. If setting up the unit with a modem, it is likely that Wake on DTR would be the correct<br />
option that results in lowest power consumption. However, it will depend on the modem. Access this setting<br />
via the front panel: Station Setup > Other Settings, or via the command line.<br />
Please note that the unit will always assert DSR (as long as it has power).<br />
Hardware flow control via lines RTS and CTS (a.k.a. hardware handshaking) can be enabled via the<br />
Hardware Flow Ctrl setting. Enabling the setting can improve communication, especially if using a modem.<br />
When handshaking is on, the receiver is able to pause the data flow from the transmitter. Access this setting<br />
via the front panel: Station Setup > Other Settings, or via the command line.<br />
Please note that if RS232 Wakeup is set to wake on RTS, it is not possible to use Hardware Flow Ctrl.<br />
Machine to Machine Communication<br />
All commands may be preceded with an !. If they are, there is no echo, and a concise reply meant for<br />
machine to machine interaction is returned. Commands would be preceded by an ! if they were sent by an<br />
Xpert or some such computer.<br />
Viewing Stage<br />
To initiate a new stage measurement, type MEAS. To see the last automeasured stage, including details, type<br />
LAST. The output by the radar will look like this:<br />
Radar Reading<br />
Stage 7.01 feet<br />
Bringing the Benefits of Real-Time Data Collection to the World<br />
34
Discharge 52.21 CFS<br />
Distance 23.38 feet<br />
Good Samples 2<br />
Total Samples 2<br />
Standard Deviation 0.00<br />
Signal Strength 59.7%<br />
For details on what each of the measurements means, please refer to Stage Details on page 15.<br />
For a concise version, try !LAST or !MEAS;<br />
7.01,23.38,53.21,<br />
2,2,0.01,59.7<br />
<strong>Download</strong>ing the Log<br />
The radar will save the stage in its flash memory each time a measurement is made. This data is then<br />
available to download to via the RS232 port. The command “LOG” command will start a Y-Modem transfer<br />
of the log to the connected device. There are optional parameters that alter what data is downloaded as<br />
follows:<br />
“LOG” with no parameters will download since last.<br />
“LOG ALL” gets whole log.<br />
“LOG X” gets X last days ("LOG 3" gets last 3 days worth of data)<br />
“LOG timeStart” gets data since provided date<br />
“LOG timeStart timeEnd” gets data between provided dates<br />
time can be YYYY/MM/DD HH:MM:SS or YYYY/MM/DD or HH:MM:SS<br />
e.g. "LOG 12:00:00 13:00:00"<br />
e.g. "LOG 2006/01/20 12:00:00 2006/01/21 12:00:00"<br />
Appending NH will omit the header : « LOG ALL NH »<br />
“LOG HELP” Shows details on how to use the download command.<br />
Auto Output<br />
When the radar has auto output mode enabled (via front panel, Station Setup>Other Settings>Auto Output,<br />
command line AUTO OUTPUT), it will automatically send data out on the RS232 port. The data will come<br />
out at whatever baud rate is setup (via front panel, Station Setup>Other Settings>Baud Rate, command line<br />
BAUD RATE). If connected via HyperTerminal, and if command line mode is active, type EXIT to leave<br />
command line mode and to capture the auto output.<br />
The data auto output is the stage. It is output as fast as it is measured (which depends on user settings), once<br />
a second at most. The data is ASCII. This is an example of the output:<br />
46.3<br />
46.3<br />
46.4<br />
46.4<br />
Target Mode<br />
In order to help setup the Radar so that its antenna correctly points at the water’s surface, the TARGET<br />
command may be issued. Once issued, the Radar will continuously output distance to water and signal<br />
strength. readings. The readings are output once a second. To ensure fresh data is output, make sure that the<br />
sample form period is one second or less (which it is at default).<br />
RS232 Command Reference<br />
Documentation Legend:<br />
Bringing the Benefits of Real-Time Data Collection to the World<br />
35
+ If any command is followed by +, it means that as long as the command starts with the indicated<br />
word, it will be accepted.<br />
E.g. MEAS + means that typing “MEAS”, “MEASURE”, or “MEASXXX” will all have<br />
the same effect.<br />
0 If a 0 follows a listed command, it means that the command can optionally be followed by the<br />
character 0.<br />
E.g. “DIAG” will show the system diagnostic status. “DIAG 0” will first show current<br />
status and then clear the status.<br />
! NOTE:<br />
All commands may be preceded with an !. If they are, a concise reply meant for machine to<br />
machine interaction is returned. Commands would be preceded by an ! if they were sent by<br />
an Xpert or some such computer.<br />
E.g. “MEAS” will show<br />
Radar Reading<br />
Stage 23.04 feet<br />
Distance 23.30 feet<br />
Good Samples 2<br />
Total Samples 2<br />
Standard Deviation 0.01<br />
Signal Strength 63.5%<br />
“!MEAS” will show<br />
23.05,23.29,0.00,<br />
2,2,0.00,63.0<br />
List of commands<br />
BATT +<br />
Shows the current battery reading.<br />
DIAG + 0<br />
Shows system diagnostics, including system resets. If followed by 0, it will clear system resets.<br />
DOWNLOAD<br />
See LOG<br />
EXIT<br />
Quits command line.<br />
HELP<br />
Brings up the end user help (lists commands).<br />
HI<br />
System replies with “Hello”<br />
LAST +<br />
Shows the last automeasured reading.<br />
LOG<br />
This command is used to download the log. It can be followed by optional parameters indicating<br />
what part of the log to download.<br />
LOG with no parameters will download since last.<br />
“LOG ALL” gets whole log.<br />
“LOG X” gets X last days ("LOG 3" gets last 3 days worth of data)<br />
“LOG timeStart” gets data since provided date<br />
“LOG timeStart timeEnd” gets data between provided dates<br />
time can be YYYY/MM/DD HH:MM:SS or YYYY/MM/DD or HH:MM:SS<br />
e.g. "LOG 12:00:00 13:00:00"<br />
e.g. "LOG 2006/01/20 12:00:00 2006/01/21 12:00:00"<br />
The file name for the downloaded log has the format<br />
Stationname_log_YYYYMMDD.csv where YYYYMMDD is the date of the first data in<br />
the log file<br />
Bringing the Benefits of Real-Time Data Collection to the World<br />
36
The data in the log file consists of some header lines to document important station information<br />
followed by data. The following are examples of the header lines :<br />
Station Name, WDID, model and version, Measuring Point, Operating Mode, Avg Time, DQAP, Sample Form Period<br />
<strong>Sutron</strong> Radar, 20003, RDR ver 1.11, 48.24659 feet, Normal, 10.000 sec, Disabled, 1.0 sec<br />
PWM Slope, Factory Offset, SigStrCal<br />
0.75743, -2.216, 3.195<br />
Discharge, Equation, Parshall Flume Width, Weir Coefficient W, Coefficient A, Coefficient B, Gauge Height Shift<br />
Enabled, Generic: A*(Stage^B), 12 inches, 1, 1, 1.5, 0.1<br />
The header lines are followed by data in the following format :<br />
Name, Date, Time, Value, Units, Quality<br />
The following are examples of logged data :<br />
04/13/2009,10:51:25,Stage,-3.91,feet,<br />
04/13/2009,10:51:25,Distance,3.91,feet,<br />
04/13/2009,10:51:25,Standard Deviation,0.00,,<br />
04/13/2009,10:51:25,Signal Strength,101.0,,<br />
04/13/2009,10:51:25,Good Samples,5,,<br />
04/13/2009,10:51:25,Total Samples,5,,<br />
LOG HELP<br />
Shows details on how to use the download command.<br />
STAGE = 14.5<br />
Changes the current stage to 14.5 (of whatever units are currently chosen). User can choose any<br />
number, not just 14.5. Please see the section Setting Stage on page 14.<br />
MEAS +<br />
Initiates, waits for, and shows the results of sensor measurements.<br />
REBOOT<br />
Does a software resets of the system.<br />
RESETS + 0<br />
Shows system diagnostics, including system resets. If followed by 0, it will clear system diagnostic<br />
status.<br />
SETUP<br />
If provided without any other parameters, it lists all setup details. That includes each setup variable<br />
and its current value.<br />
Can be followed by a setup variable name and a new value for that variable.<br />
E.g. “CHANGE STATION NAME = SUTRON”<br />
If SETUP DEFAULT is issued, it will reset the entire setup to defaults.<br />
STATUS 0<br />
Shows system status including time, boot time, battery readings, last Radar measurements, current<br />
onboard sensor readings, and any hardware errors that may exist. If followed by 0, it clears the<br />
hardware errors.<br />
TARGET<br />
Continuously measures and outputs sample data, including distance to water and signal strength.<br />
TIME<br />
Shows the current system date and time. If followed by a new time, it changes the system time.<br />
UPG +<br />
Initiates a system software upgrade. It needs to be followed by the YModem transfer of an .upg file<br />
specific to the product. Both the main application and the boot loader are upgraded this way (but<br />
each needs its own .upg file).<br />
VER +<br />
Shows the current software version, including build date and time and the boot loader version.<br />
Bringing the Benefits of Real-Time Data Collection to the World<br />
37
List of setup variables<br />
Type SETUP to get a list of the whole setup. Every setup variable can be viewed by typing its name.<br />
E.g. “STATION NAME” will show the current station name.<br />
Every setup variable can be changed by typing its name = new value.<br />
E.g. “STATION NAME = SUTRON” will set the station name to “SUTRON”.<br />
AUTO OUTPUT<br />
AUTOMEASURE INTERVAL<br />
AUTOMEASURE TIME<br />
AVG TIME<br />
COEFFICIENT A<br />
COEFFICIENT B<br />
DISCHARGE ENABLE<br />
DISCHARGE EQUATION<br />
DQAP ENABLE<br />
GAUGE HEIGHT SHIFT<br />
HARDWARE FLOW CTRL<br />
STAGE UNITS<br />
LOG STAGE DETAILS<br />
LOG DAILY VALUES<br />
MEASURING POINT<br />
OPERATING MODE<br />
PARSHALL WIDTH<br />
RIGHT DIGITS<br />
RS232 BAUD RATE<br />
RS232 WAKEUP<br />
STATION NAME<br />
WDID<br />
WEIR COEFFICIENT W<br />
List of calibration setup variables<br />
These settings are set at the factory for optimum operation and should not be changed. If they are, radar may<br />
stop functioning, Note: Consult <strong>Sutron</strong> Customer Service for further information regarding factory<br />
calibration.<br />
Setup Transfer via Hyperterminal<br />
It is possible to capture a Radar’s setup and save it to file. Using HyperTerminal, establish RS232 connection<br />
first. Once you are able to talk to the Radar, use HyperTerminal’s Transfer menu and select Capture Text.<br />
Then type !SETUP on the command line. The Radar will stream out its entire setup and it will be saved in<br />
the file selected. Make sure to tell HyperTerminal to stop text capture after getting the setup in the file.<br />
Once the setup is saved to file, feel free to edit the file, changing any of the settings. To send a setup file to<br />
the Radar, HyperTerminal will need to be properly configured to delay after sending every line. To do so,<br />
user HyperTerminal’s File, Properties menu. Click on the Settings tab and click the ASCII Setup button.<br />
Change the Line delay to 1000 milliseconds and change the Character delay to 5 milliseconds. If these<br />
changes are not made, HyperTerminal will send the file too fast for the Radar to capture any but the first few<br />
settings. Once the changes are made, choose HyperTerminal’s Transfer menu and click Send Text File.<br />
Select the file with the saved setup. You will see the transfer take place on HyperTerminal’s main window.<br />
Radar will report which settings have been changed.<br />
Connecting a Modem<br />
It is possible to connect a modem to the Radar, allowing for remote access to the station. Use the RS232 port<br />
to connect the modem. Most modems will need a null modem adapter between the modem and the Radar.<br />
Bringing the Benefits of Real-Time Data Collection to the World<br />
38
The modem will need to be configured before it can be used. Please make sure to test out the modem-Radar<br />
connection before deploying them in the field. The following modem settings must be configured:<br />
Autoanswer: enable (otherwise a connection will never be established)<br />
Connect timeout: enable (otherwise the modem will keep the Radar awake, increasing power<br />
consumption)<br />
Command echo: disable (otherwise the modem and the Radar will forever talk to each other,<br />
preventing further connections and increasing power consumption)<br />
Telnet mode: enable (this is required only if using a modem over TCP/IP – if not enabled, log<br />
downloads may fail, especially if using HyperTerminal)<br />
RTS: enable (this is likely on by default – unless the setting RS232 Wakeup is changed, the Radar<br />
will not notice the modem unless RTS is on)<br />
Carrier Detect: always on (also known as LSD Action, DCD, and CD)<br />
Baud rate, parity, etc: set this up to match the settings of the Radar (Radar defaults are 115200<br />
Baud, no parity, 8 data bits, 1 stop bit)<br />
Xpert-Xlite Modem 8080-0005<br />
<strong>Sutron</strong> manufactures a modem (Xpert-Xlite Modem part number 8080-0005) that is suitable for use with the<br />
Radar. On the Radar, setup RS232 Wakeup to wake on RTS (it is that way by default).<br />
A null modem cable is needed between the device and the modem since they are both configured as DCE<br />
devices. If the null modem cable routes pin 9 through from end to end, you can power the modem from the<br />
device, but most null modem adapters leave pin 9 disconnected. In that case, just connect the power (5V-16V<br />
DC) to the power connector. Note: this can be done even if the cable routes power through pin 9. The modem<br />
will utilize whichever is providing the higher voltage. The modem also must be configured to power up on<br />
RTS instead of DTR and to output CD on the DSR pin.<br />
Set J4 to pins 1-2 to have the modem wake up on RTS<br />
Set J5 to pins 1-2 to route CD out the DSR pin<br />
The default settings from <strong>Sutron</strong> for the modem will work. If the settings have been changed, issue these<br />
commands to the modem:<br />
AT&F<br />
ATS0=1<br />
ATE0Q1&D0&W<br />
This is what the commands mean:<br />
AT&F set to factory defaults<br />
S0=1 answer on first ring<br />
E0 don't echo characters<br />
Q1 don't send result codes<br />
&D0 ignore DTR<br />
&W save settings into profile.<br />
Raven Modem<br />
A Raven modem allows you to access the Radar through the Internet. The Raven should be ordered with a<br />
fixed IP address. Using that IP address, you will be able to use HyperTerminal or other TCP/IP aware<br />
communications programs to use the command line interface of the Radar.<br />
Make sure to place a null modem adapter between the Raven and the Radar.<br />
The Raven modem must be configured as follows:<br />
Device Port 3001<br />
Configure Serial Port 115200,8N1<br />
Bringing the Benefits of Real-Time Data Collection to the World<br />
39
Command Echo 0<br />
TCP Auto Answer 2<br />
TCP Connect Timeout 30<br />
TCP Idle Timeout 2<br />
Telnet Echo Mode 0<br />
UDP Auto Answer 2<br />
You can connect the Raven to the same battery powering the Raven; however, remember that it will increase<br />
the power consumption (both when the modem is idle and when it is connected). As a result, you will need to<br />
make sure your battery is large enough to provide the power needed by the station.<br />
Bringing the Benefits of Real-Time Data Collection to the World<br />
40
Discharge<br />
What the Radar Can Do For You<br />
The radar was specifically designed to eliminate most of the labor involved in working up records from a<br />
discharge measurement site. Traditionally, the stage values have been recorded as a line on a strip chart.<br />
Discharge has been computed by drawing lines to represent the mean daily stage, and then looking up the<br />
discharge in a rating table or graph. The radar eliminates the need for hand computations and data recording.<br />
The radar supports real-time calculation of discharge for the following:<br />
Parshall flumes<br />
Broad-crested weirs<br />
B<br />
Any flow measuring device whose rating takes the form Discharge A * Stage <br />
and B are constants<br />
Bringing the Benefits of Real-Time Data Collection to the World<br />
41<br />
, where A<br />
You can eliminate the need for after-the-fact hand calculations by enabling discharge calculation and entering<br />
the coefficients for your flume or weir.<br />
Discharge Setup Sequence<br />
Very little extra effort is required to make an radar record discharge as well as stage. The steps are as<br />
follows:<br />
1. Set up stage (see Setting Stage on page 14)<br />
2. Follow the steps in the next section to enable discharge recording and enter the correct coefficients for<br />
your flume or weir<br />
Correctly Recording Discharge<br />
Enabling The Computation<br />
Discharge calculation can be enabled either from the front panel or via the command line interface. Via the<br />
front panel, go to Station Setup > Discharge Setup > Discharge Enable and press set to enable discharge.<br />
Once discharge is enabled, press down to choose the discharge equation: The choices are:<br />
Parshall Flume<br />
Weir<br />
Generic<br />
WORD OF CAUTION<br />
The radar follows standard computer “execution order” rules when solving the discharge equations. The<br />
B<br />
exponential calculation ( Stage ) is made first, followed by the multiplication by the constant A. Rating<br />
tables (see next page) are computed this way.<br />
B<br />
A Stage<br />
B<br />
is NOT the same as A Stage <br />
. If you are checking values in a table, or creating your<br />
own equation by curve fitting values in a table, be sure to do the calculations in the same order as done by the<br />
RADAR.
Selecting the Calculation Type<br />
Rating Curves and Equations<br />
Every flow measurement device is rated to determine the relationship between the stage at a fixed location<br />
(staff gage) and the discharge. The ratings are presented as equations and/or tables that allow the user to<br />
determine the discharge. A typical rating table is illustrated in the figure below.<br />
State of Colorado<br />
Division of Water Resources<br />
Office of State Engineer Computed by: RVS<br />
Division 1 Checked by: RVS<br />
Rating Table ID: Jumbo Outlet #1 @ 22.8'<br />
JUMBOSCO01<br />
Weir<br />
Time of Last Edit: 23-Oct-2002<br />
A 73.994<br />
EQ: Q=73.994(GH)^1.8537 B 1.8537<br />
GH 0.00 0.01 0.02 0.03 0.04 0.05 0.06 0.07 0.08 0.09<br />
Feet cfs Cfs cfs cfs cfs cfs cfs cfs cfs cfs<br />
0.00<br />
0.10 1.04 1.24 1.45 1.69 1.93 2.20 2.48 2.77 3.08 3.41<br />
0.20 3.75 4.10 4.47 4.85 5.25 5.66 6.09 6.53 6.99 7.46<br />
0.30 7.94 8.44 8.95 9.48 10.02 10.57 11.14 11.72 12.31 12.92<br />
0.40 13.5 14.2 14.8 15.5 16.2 16.8 17.5 18.3 19.0 19.7<br />
0.50 20.5 21.2 22.0 22.8 23.6 24.4 25.3 26.1 27.0 27.8<br />
0.60 28.7 29.6 30.5 31.4 32.4 33.3 34.3 35.2 36.2 37.2<br />
0.70 38.2 39.2 40.2 41.3 42.3 43.4 44.5 45.6 46.7 47.8<br />
0.80 48.9 50.1 51.2 52.4 53.6 54.7 55.9 57.2 58.4 59.6<br />
0.90 60.9 62.1 63.4 64.7 66.0 67.3 68.6 69.9 71.3 72.6<br />
1.00 74.0 75.4 76.8 78.2 79.6 81.0 82.4 83.9 85.3 86.8<br />
1.10 88.3 89.8 91.3 92.8 94.3 95.9 97.4 99.0 101 102<br />
1.20 104 105 107 109 110 112 114 115 117 119<br />
1.30 120 122 124 126 127 129 131 133 134 136<br />
1.40 138 140 142 144 145 147 149 151 153 155<br />
1.50 157 159 161 163 165 167 169 171 173 175<br />
1.60 177 179 181 183 185 187 189 191 194 196<br />
1.70 198 200 202 204 207 209 211 213 215 218<br />
1.80 220 222 225 227 229 231 234 236 238 241<br />
1.90 243 246 248 250 253 255 258 260 262 265<br />
2.00 267 270 272 275 277 280 282 285 288 290<br />
Bringing the Benefits of Real-Time Data Collection to the World<br />
42
The figure illustrates a typical rating table as provided by the State of Colorado’s Division of Water<br />
Resources. Note at the top that the rating is for a weir and that the equation upon which the table is based is<br />
provided. The type of device, along with the equation, determine how you should set up the radar.<br />
Base your radar setup primarily on the equation, if one is given.<br />
The radar is designed to support discharge calculations based on the general formula<br />
B<br />
<br />
Discharge A * Stage<br />
where A and B are constants. The values of A and B are determined by the flow measuring device you are<br />
using. Here is how to decide.<br />
1. Are you using a Parshall flume? If so, select Parshall Flume as the discharge calculation type.<br />
2. Are you using a weir? Examine the coefficient B in the equation. If the coefficient is EXACTLY 1.5<br />
or 3/2, then select Weir as the calculation type.<br />
3. If you are not using a Parshall Flume or weir, or the B coefficient is NOT 1.5, then select Generic as the<br />
calculation type.<br />
In the example table above, the device type is weir, and the equation is:<br />
1.8537<br />
Q 73.994 * GH<br />
Note that since the B coefficient is 1.8537 the correct calculation type will be Generic, and NOT Weir. This<br />
is because the B coefficient is NOT 1.5.<br />
The following paragraphs provide additional information on how the radar computes discharge for the three<br />
calculation types.<br />
Parshall Flume<br />
Parshall flumes are one of the most widely used discharge measuring devices in the world. The following<br />
equation family is used to compute the discharge for Parshall flumes:<br />
W, in feet Discharge equation, Q in CFS<br />
0.25 (3 inches)<br />
0.5 (6 inches)<br />
0.75 (9 inches)<br />
Q 0.992 H<br />
Q 2.06 H<br />
Q 3.07 H<br />
1.547<br />
Bringing the Benefits of Real-Time Data Collection to the World<br />
43<br />
1.58<br />
1.53<br />
0.026<br />
1 to 8 1.522 W <br />
Q 4W<br />
H<br />
10 to 50 Q 3.6875 W 2.5 H<br />
(Reference: Open Channel Hydraulics, Chow, Ven Tee, McGraw Hill Book Company, New York, 1959)<br />
If you are using a Parshall flume you will only have to enter the throat width, W. The radar will compute the<br />
appropriate values for A and B in the discharge equation. Note that these equations DO NOT account for<br />
submerged outlet conditions.<br />
1.6
Weir<br />
Weirs are also widely used for discharge measurement, but, unlike Parshall flumes, are not standardized.<br />
There is an infinite variety of widths, side shapes, and constructions. In general, the discharge over a weir<br />
can be represented by the equation:<br />
D isch arg e K L Stage<br />
where K is a coefficient determined by the rating process, and L is the length of the crest. Examine the rating<br />
equation for your weir carefully. Some weirs will provide the coefficient K and some will provide the<br />
product K L . You will need the PRODUCT, K L to enter as W in the setup. For example, if the weir<br />
equation is given as:<br />
1.5<br />
Q 73.994 GH<br />
then you would enter 73.994 for W in the setup.<br />
General-Purpose Equation<br />
The general purpose equation should be used for any non-standard flume or weir. As long as the device<br />
rating can be expressed in the form:<br />
B<br />
Q A GH<br />
then the radar can be used to compute the discharge. For example, from the rating table presented earlier we<br />
were given the discharge equation:<br />
1.8537<br />
Q 73.994 * GH<br />
Enter the value 73.99 for A in the setup and 1.8537 for B. The procedures for entering coefficients are given<br />
in the next section.<br />
Entering the Coefficients<br />
The flume and weir constants are entered after you make your selection for the computation type (Parshall<br />
Flume, Weir, Generic).<br />
If you are setting your radar up from the front panel, the coefficient entry is “context sensitive.” That is, the<br />
radar will determine what you need to enter.<br />
If you select Parshall Flume as the device type and scroll down one position you will see the prompt<br />
“Parshall Flume Width”, followed by a value. Press the SET key to change the width. When you press SET<br />
you will see the prompt “Change width”, followed by the current value. Use the UP/DOWN arrow keys to<br />
scroll through the available widths.<br />
If you select Weir as the device type and scroll down one position you will see the prompt “Weir Coefficient<br />
W”. Press the SET key to change the value. Note that W represents the K*L product in the general weir<br />
equation. When you press SET you will see the prompt “Change Weir Coefficient W”, followed by a value<br />
containing a blinking cursor. Use the arrow keys to position the cursor and to scroll the individual digits.<br />
Press SET to make the coefficient permanent after you are done editing.<br />
Bringing the Benefits of Real-Time Data Collection to the World<br />
44<br />
3<br />
2
If you select Generic as the device type and scroll down one position you will see the prompt “Coefficient A”,<br />
followed by a value. Press SET to change the value. You will see the prompt “Change Coefficient A”,<br />
followed by a value containing a blinking cursor. Use the arrow keys to position the cursor and to scroll the<br />
individual digits. Press SET to make the coefficient permanent after you are done editing. Press the down<br />
arrow key after Setting the value of Coefficient A. You will see the prompt “Coefficient B”, followed by a<br />
value. Press SET to change the value. You will see the prompt “Change Coefficient B”, followed by a value<br />
containing a blinking cursor. Use the same procedures you used to set and store Coefficient A.<br />
Bringing the Benefits of Real-Time Data Collection to the World<br />
45
Installation<br />
Electrical Connections:<br />
Refer to the Cabling section on page 9 for a description of the electrical connections.<br />
Mount the Radar<br />
Be sure to pick a location for the radar where it has a clear, unobstructed view of the water below it. To see<br />
the radio path seen by radar, use <strong>Sutron</strong> RLR Communicator (see Appendix B). The minimum distance for<br />
the sensor is 5 feet so make sure that the sensor is at least 5 feet above the highest stage that can be measured.<br />
The maximum distance from the sensor to the water is 60ft. Read the next section titled “Targeting the<br />
Radar” for additional before mounting the radar.<br />
The RLR-0001-1 radar is designed to mount with the front panel display facing up. In this orientation, the<br />
radar antenna points down to the water surface. You may switch the orientation of the antenna by opening the<br />
enclosure and changing the mounting plate so the antenna points to the side of the enclosure. Do not install<br />
the RLR-0001-1 outdoors without an additional protective enclosure. The radar mounts to a panel or surface<br />
through four holes that are accessible in the corners of the enclosure<br />
The RLR-0003-1 antenna enclosure is designed with a 5/8” bolt for connection to a mounting arm. The bolt<br />
and the swivel bracket can be adjusted to allow the radar to point directly to the water surface no matter what<br />
the angle is of the mounting arm. The adjustments are made by loosening the two screws in the sides of the<br />
swivel bracket and also rotating the bracket relative to the bolt.<br />
Targeting the Radar<br />
The radar sensor operates by emitting a pulse and capturing its reflection. The pulse is meant to be reflected<br />
on the surface of water. To operate properly, the antenna emitting the pulse must be carefully pointed at the<br />
water surface.<br />
For best results, mount the radar directly above the water surface, such that the radar beam is<br />
perpendicular to the water. The radar will not operate well if the beam strikes the water at an angle.<br />
The Half-power beamwidth of the radar is 32 degrees -- +/-16 degrees off a center line). The radar can get a<br />
reflection off anything that is within the area of the beamwidth. The following table shows the width of the<br />
beam at different distances from the water. Make sure that this area is free from obstructions.<br />
Distance to Water Beamwidth (radius in feet)<br />
10 3<br />
20 6<br />
30 9<br />
40 12<br />
50 15<br />
60 18<br />
Bringing the Benefits of Real-Time Data Collection to the World<br />
46
Figure 1: Illustration of radar beam pattern<br />
When installing the radar, please use the front panel diagnostic feature (Diagnostic > Signal Quality).<br />
The radar gives a signal strength expressed as a percentage 0 to 100%. Before mounting the enclosure move<br />
the enclosure a small amount in each direction and note the change in the signal strength. When you have<br />
found the maximum signal strength, mount the radar in the same orientation. You may also use the circular<br />
level to point the antenna at the water surface.<br />
If using the front panel is not convenient or not available, try the command line TARGET mode. It will<br />
continuously output Radar readings on the RS232 port which may a useful aid during installation.<br />
Please see the section Quick Install for more installation tips.<br />
Bringing the Benefits of Real-Time Data Collection to the World<br />
47
FIRMWARE Upgrade<br />
The radar level recorder has been designed using the most modern techniques such that at any time the system<br />
firmware may be upgraded while it is in the field preventing the need to ever return a unit to the factory for<br />
firmware upgrades. The factory may offer new features or bug fixes that may only be accessed through<br />
firmware upgrades. The techniques below will illustrate how to install the upgraded firmware into the radar<br />
unit.<br />
Methods for upgrade:<br />
There are several possible methods to use to upgrade the software in the radar unit. The first step in all three<br />
methods is to download from the <strong>Sutron</strong> web site the program upgrade file, such as<br />
‘v1_24mainRLR1260.upg’, found at http://www.sutron.com/downloads/software.htm. Select the radar and<br />
download the UPG file to a temporary folder or desktop location where it may be accessed at a later time.<br />
Method 1: Using ‘UPGRADE’ command using Hyperterm:<br />
Open and run Hyperterm on a PC. Set the properties to:<br />
Baud Rate: 115200<br />
Bits: 8<br />
Parity: None<br />
Stop Bits: 1<br />
Start with the radar unit powered up and running.<br />
Connect DB-9 serial cable and establish communications by typing ‘enter’. (connect port)<br />
Once the prompt is found, type ‘UPGRADE” or ‘UPG’.<br />
Now the system is waiting for Hyperterm to send the file.<br />
An upper case “C” will repeat every 2 seconds or so over the serial port. Select ‘Send File” and<br />
choose ‘Y-Modem’ and then select the upgrade file name previously stored on the computer.<br />
Once the download is completed, the system will reboot.<br />
Type the command ‘Ver’ to confirm that the upgrade was successful<br />
Method 2: Using Hyperterm and ‘Escape’ key:<br />
Open and run Hyperterm on a PC. Set the properties to:<br />
Baud Rate: 115200<br />
Bits: 8<br />
Parity: None<br />
Stop Bits: 1<br />
Start with the radar unit powered DOWN.<br />
Open the serial port with hyperterm.<br />
Power up the radar unit simultaneously while holding the ‘Escape’ key on the keyboard of the<br />
computer running Hyperterm. Release the escape key once the unit has powered up.<br />
An upper case “C” will repeat every 2 seconds or so over the serial port. At this time, use ‘Send<br />
File’ and choose ‘Y-Modem’ and then select the upgrade file name previously stored on the<br />
computer.<br />
Once the download is completed, the system will reboot.<br />
Type the command ‘Ver’ to confirm that the upgrade was successful.<br />
Bringing the Benefits of Real-Time Data Collection to the World<br />
48
GPS<br />
It is possible to use a GPS to provide the RLR with an accurate, self setting clock. RLR can be connected to<br />
a Garmin GPS 16HVS. RLR needs to be have software version 1.15 or newer to support GPS.<br />
Timekeeping<br />
When equipped with a GPS, the RLR will keep UTC time. UTC (Universal Coordinated Time) is an<br />
internationally accept time standard. UTC will differ from the local time by a number of hours. The user can<br />
setup the RLR so that it keeps local time by changing the variable Local Time Offset. To get EST, set the<br />
local time offset to -5 hours.<br />
If a <strong>Sutron</strong> Satlink (versions 6.17 and newer) is connected to the RLR via SDI-12 (in addition to the Garmin<br />
GPS), note that Satlink will set the clock of the RLR once per day. Please ensure that Satlink’s local time<br />
offset is equal to that of the RLR.<br />
An RLR equipped with a GPS will provide a timing accuracy of ± 1 second.<br />
GPS Installation and Setup<br />
When first installing the GPS, make sure the GPS is positioned so that it has a clear view of the sky. Make<br />
sure to connect the GPS to the RLR via RS232. <strong>Sutron</strong> provides a custom RJ45 to RS232 connector for this<br />
purpose (the diagram for the connector is on page 51).<br />
After connecting the two devices, go the Station Setup menu on the front panel of the RLR. Find the entry<br />
called Garmin GPS and press set to enable the GPS. Then go back to the top of the menu, and hit the down<br />
button until the GPS status menu is shown. If RLR is communicating with the GPS, the menu will say<br />
GPS initializing. If the GPS has acquired a time fix, the RLR will show GPS functioning.<br />
Pressing right in the GPS status menu will provide more details.<br />
If the GPS has locked on satellites and is providing accurate time, the menu will show a message such as<br />
GPS has valid time<br />
5 satellites used in time fix<br />
Pressing down from the detailed status menu will show the last GPS time sync. The time show is the time<br />
when the GPS last had a time fix. If it has been more than 12 hours since the last valid time fix, the GPS is<br />
not working properly and may need to be repositioned (please see page 49).<br />
The next entry in the menu is local time offset. The user can setup the RLR so that it keeps local time by<br />
changing the variable Local Time Offset. To get EST, set the local time offset to -5 hours.<br />
When installing, it is recommended that the user wait until the GPS has valid time before leaving the station.<br />
If the GPS does not acquire the time in ten minutes, the GPS should be repositioned so that it has a better<br />
view of the sky.<br />
Keep in mind that whenever the display is turned on, RLR will power up the GPS. This helps with GPS<br />
positioning. As long as the display is on, the RLR will provide power the GPS, allowing it to track satellites.<br />
When the display is off, the RLR will power the GPS once an hour for up to 15 minutes.<br />
GPS Positioning<br />
If the RLR is reporting that the GPS cannot get a time fix, it means that the GPS is unable to get a clear view<br />
of the sky. It could also be the case that the GPS is picking up interference. The best solution is to reposition<br />
the GPS. The GPS needs to have a clear view of the sky in order to properly function.<br />
Bringing the Benefits of Real-Time Data Collection to the World<br />
49
Place the GPS antenna in the most open space possible. Do not place it directly under anything nor directly<br />
beside something. Always attempt to achieve a "full sky" view with the antenna.<br />
Place the GPS antenna high up on a pedestal or in a protected location. Flat surfaces may tend to cover with<br />
ice and snow more so than elevated locations. Keep away from areas where birds may nest. Placement is<br />
very important and great care should be taken in selecting the location.<br />
GPS Operation<br />
Once every hour, the RLR will wake up the GPS. Once the GPS has acquired a time fix (should not take<br />
more than 40 seconds), the RLR will set its clock and put the GPS in low power mode. Powering the GPS<br />
once an hour provides the optimal power consumption.<br />
In addition, whenever the display is turned on, RLR will power up the GPS. This allows the user to see<br />
whether the GPS can acquire a time fix and helps in positioning the antenna.<br />
GPS Errors<br />
If the GPS is either not communicating with the RLR or if the GPS cannot acquire a time fix, the RLR will<br />
blink the red LED to indicate that there is a problem. In addition, the RLR will show a message describing<br />
the problem on the front panel. Once a day, the RLR will write an event to the log indicating that it has GPS<br />
problems.<br />
The RLR reporting “No GPS Detected” can indicate that the connector between the GPS and RLR is bad<br />
(please refer to the section on the connector on page 51) or that the RLR does not have its jumpers set<br />
properly (please see the section on page 50 about Jumpers)<br />
If the GPS cannot get a time fix, please see the section on GPS Positioning on page 49.<br />
If the RLR reports “GPS Comm Failure”, it means the RLR is detecting data on the RS232 line, but that the<br />
data is incomprehensible. It could indicate that the GPS has been improperly configured. If possible, try<br />
using a different GPS module.<br />
If a faulty GPS is connect to the RLR, of it the GSP is not connected to the RLR, the RLR will take a full<br />
minute before deciding it cannot talk to the GPS. Ensure that the RLR is given enough time to talk to the<br />
GPS before leaving the station.<br />
Jumpers<br />
There is a jumper inside the RLR that ensures that the RLR provides 12 Volts on RS232 which the Garmin<br />
GPS requires in order to function. Normally, <strong>Sutron</strong> sets this jumper so that the unit can work with a GPS.<br />
However, if the RLR is reporting “No GPS Detected”, it may be the case that the jumper is not properly<br />
setup.<br />
There is a way to determine the jumper setup without opening the unit. It does require a voltmeter. Firstly,<br />
enable the Garmin GPS setting via the front panel. Then, measure the voltage across pins 5 and 9 of the<br />
RS232. Those are the two rightmost pins (closest to right side panel). One pin is above the other. If the<br />
voltage is NOT 12V, GPS will NOT work. You will then need to open the unit and set the jumper.<br />
Bringing the Benefits of Real-Time Data Collection to the World<br />
50
To setup the jumper, the case must be opened. Once the case is open, the jumper is easily accessible. Place a<br />
connector on jumper J8 so that it connects Vbat to the middle pin.<br />
In addition to J8, there is another jumper needs to be properly configured in order for the unit to provide<br />
power to the GPS. However, this jumper is properly setup at the factory and it is unlikely to be the cause of<br />
the problem. The jumper in question is J6 (located next to J8). It should have a connector across pins 2 and<br />
3 or have no connector at all.<br />
RJ45 to RS232 Connector<br />
A custom connector is required to get the <strong>Sutron</strong> and the Garmin GPS together. The connector bridges the<br />
RJ45 on the Garmin GPS to the RS232 on the <strong>Sutron</strong> unit. The table below provides the wiring diagram for<br />
the connector.<br />
Note: The colors on the Garmin GPS RJ45 do not match the colors of the RJ45 to RS232 converter.<br />
Bringing the Benefits of Real-Time Data Collection to the World<br />
51
Rj45 pin<br />
Garmin<br />
plug color<br />
RJ45 to Rs232<br />
converter<br />
RS232 on<br />
<strong>Sutron</strong> unit<br />
Function comments<br />
1 Red Blue 9 Power 8 to 40V for 16HVS<br />
2 Black Orange 5 Ground<br />
3 Yellow Black 8 CTS Remote power<br />
on/off<br />
Bringing the Benefits of Real-Time Data Collection to the World<br />
52<br />
On if
Modbus<br />
RLR can be configured as a Modbus slave device. In this mode, the unit will respond to properly formed<br />
Modbus messages in either RTU (default) or ASCII format. Keep in mind that when Modbus has been<br />
enabled, the unit will not be capable of connecting to a PC/PDA to download a log or make setup changes,<br />
but AutoPoll can be used to access log data. For more information on AutoPoll, please visit www.sutron.com<br />
To enable Modbus, go to the Station Setup menu on the front panel and press right when the Modbus Setup<br />
option is shown. The first option shown is the current status of Modbus, enabled or disabled. Pressing Set<br />
will switch between the two options. If Modbus is disabled and it is turned on, a warning message will<br />
display showing that GPS and PC communications will cease to work. Hitting Set will enable Modbus.<br />
Modbus Menu Options<br />
After enabling Modbus, other setup options become available allowing more customization of the unit.<br />
Initially, each of these settings is defaulted to those expected by the Modbus protocol.<br />
Modbus Enabled<br />
Default is DISABLED. Enabling will cause the unit to not communicate properly with any other type of<br />
device on the DB9 connector for example a PC/PDA or Garmin GPS unit.<br />
Modbus Device ID<br />
Default is 1. The device ID is the address that is used by the Modbus master to select which device to<br />
communicate with. Each slave on the bus must have a unique device ID ranging from 1 – 247. Address ‘0’ is<br />
reserved as the broadcast address.<br />
Modbus Protocol<br />
Default is RTU. There are two protocols available to the user, RTU and ASCII.<br />
In RTU mode a compatible Modbus master device must generate messages, as strict timing is required for a<br />
successful communication. This mode allows for better data throughput than ASCII mode for the same baud<br />
rate.<br />
When using Modbus over a radio, use ASCII rather than RTU mode. Radios tend to break up Modbus data<br />
packets as they are sent over the air. Since RTU does not allow for a timeout between the bytes of the packet,<br />
communications errors occur.<br />
In ASCII mode, the user may connect to the device using a serial communication program (i.e.<br />
HyperTerminal or ProComm) set to 7 data bits and 1 stop bit. Messages can then be sent to the unit by typing<br />
the proper command. Each command is prefixed with a ‘:’ and ended with a carriage-return / line-feed<br />
( usually just the ‘Enter’ key). This mode offers much less throughput than RTU since 2 ASCII<br />
characters are required to describe a single binary byte (e.g., the value 0xB5 would be communicated by<br />
sending the ASCII characters ‘B’ and ‘5’). Since a Cyclic Redundancy Check (CRC) is required on each<br />
message, the ability to send the message via HyperTerminal is almost of no use unless the CRC can be<br />
generated by the user.<br />
Note: Care must be taken to make sure the selected protocol matches that of the master or there will be<br />
communication problems.<br />
Modbus Parity<br />
Default is None. Available choices include Even, Odd and None.<br />
Bringing the Benefits of Real-Time Data Collection to the World<br />
53
Note: Care must be taken to make sure the selected parity matches that of the master or there will be<br />
communication problems.<br />
Modbus Delay before Tx<br />
Default is 10ms. This identifies the number of milliseconds to wait after asserting CTS before starting data<br />
transmission. This is useful if the device is connected to a radio requires keying initialization before data<br />
transmission. The possible delay ranges are 10ms – 2000ms.<br />
Modbus Delay after Tx<br />
Default is 10ms. This identifies the number of milliseconds to wait after data transmission is complete before<br />
de-asserting CTS. This is useful if the device is connected to a radio that requires a hold-off time after data<br />
transmission has completed. The possible delay ranges are 10ms – 2000ms.<br />
Modbus Baud Rate<br />
Default is 19.2 Kbps. Available communication speeds range from 1200bps – 115 Kbps.<br />
Note: Care must be taken to make sure the selected speed matches that of the master or there will be<br />
communication problems.<br />
Modbus Function Codes<br />
The following table identifies the functions that are supported. Each diagnostic counter is cleared when the<br />
device is powered up or reset.<br />
Code Hex Subcode Hex<br />
Read Holding Registers 0x03<br />
Read Input Register 0x04<br />
Write Single Register 0x06<br />
Diagnostic 0x08 Return Query Data 0x00<br />
Diagnostic 0x08 Clear Counters 0x0A<br />
Diagnostic 0x08 Return Bus Message Count 0x0B<br />
Diagnostic 0x08 Return Bus Comm Error 0x0C<br />
Diagnostic 0x08 Return Bus Exception Count 0x0D<br />
Diagnostic 0x08 Return Slave Message Count 0x0E<br />
Diagnostic 0x08 Return Slave Broadcast Count 0x0F<br />
Diagnostic 0x08 Return Bus Char Overrun Count 0x12<br />
Write Multiple Registers 0x10<br />
User Defined Code 0x41 GetLog GL<br />
Identifying Registers<br />
There are two types of data that can be accessed using the Modbus protocol. These include Holding and<br />
Input registers.<br />
Bringing the Benefits of Real-Time Data Collection to the World<br />
54
Holding Registers<br />
Holding registers are reserved for the purpose of setting and getting data such as the date and time and<br />
diagnostic counts if the ability to send the above Diagnostic (0x08) command is not available. The following<br />
table identifies the holding registers and their locations. Each of these registers is an unsigned 16-bit value (if<br />
readings registers using an Xpert, set the data type to ushort).<br />
Data Register Valid Data Values<br />
Hour of current time 1001 0 – 23<br />
Minute of current time 1002 0 – 59<br />
Second of current time 1003 0 – 59<br />
Year of current time 1004 > 2000<br />
Month of current date 1005 1 – 12<br />
Day of current month 1006 1 – 31<br />
Recording status<br />
1007 1 means running<br />
0 means stopped<br />
Reset Unit 1008 Write 1 to reset<br />
Modbus Protocol 1009<br />
0 – RTU<br />
1 – ASCII<br />
Force Measurement * 1010 0 – force all active<br />
measurements<br />
1-16 force that<br />
measurement only<br />
Bus Message Count 1011 Read Only<br />
Bus Comm Error 1012 Read Only<br />
Slave Exception Count 1013 Read Only<br />
Slave Message Count 1014 Read Only<br />
Broadcast Message Count 1015 Read Only<br />
Char Overrun Count 1016 Read Only<br />
Modbus Enable 1022 Read/Write<br />
0=OFF<br />
1=ON<br />
*Note: When forcing a measurement, be sure to wait the proper amount of time for a measurement to finish<br />
before requesting data.<br />
Input Registers<br />
Input registers return the last measured data from the device including stage, discharge, today and yesterday’s<br />
volume and battery voltage. Ideally these values should be requested on a schedule slightly lagging the<br />
measurement schedule on the RLR. This will ensure data will follow that found in the RLR log. If the last<br />
measured data is not acceptable, a live reading can be forced by writing a ‘1’ to the Force Measurement<br />
(1010) holding register. Care must be taken to allow enough time to pass for taking a measurement before<br />
requesting the data, especially if an analog reading is being taken.<br />
Since the unit works with floating point numbers and Modbus only allows for 16-bit registers, a multiple<br />
register read can be used to access the entire reading. The Modbus master device should be configured to<br />
treat these reads as a single floating point number. For example, if accessing Last measured Stage via an<br />
Xpert, read 1 value of type float starting at register 1. If the quality is also desired, change the number of<br />
values to 2 and choose ushort for the second reading type. The complete list of registers and their locations<br />
are below.<br />
Bringing the Benefits of Real-Time Data Collection to the World<br />
55
Data Register<br />
Last measured Stage (MSW) 1<br />
Last measured Stage (LSW) 2<br />
Quality (see below)* 3<br />
Last measured Discharge (MSW) 4<br />
Last measured Discharge (LSW) 5<br />
Last measured Distance to Water<br />
(MSW)<br />
6<br />
Last measured Distance to<br />
Water(LSW)<br />
7<br />
Last measured Signal Strength<br />
(MSW)<br />
8<br />
Last measured Signal Strength<br />
(LSW)<br />
9<br />
Last measured Standard Deviation<br />
(MSW)<br />
10<br />
Last measured Standard Deviation<br />
(LSW)<br />
11<br />
Battery Voltage (MSW) 12<br />
Battery Voltage (LSW) 13<br />
*Quality – the quality register will hold the value 1 if the reading is valid, and the value 0 if an error occurred<br />
during the reading. Quality relates to Stage, Discharge, Distance to Water, Signal Strength, and Standard<br />
Deviation.<br />
Bringing the Benefits of Real-Time Data Collection to the World<br />
56
Get Log Command<br />
The Get Log subcode is used to retrieve log data from the unit. The format of the command is as follows:<br />
GL,logfilename,datetime,recordID,numbytes<br />
The logfilename can be used to return log entries of specific types. The available types are data,<br />
events, and all.<br />
The datetime value must be in the following format: MM/DD/YYYY HH:MM:SS.<br />
The numbytes value refers to the number of data bytes from the log entry to include in the response,<br />
not the number of bytes to store in the return packet. Since the master station or transport medium<br />
may be limited in the number of bytes that can be handled in a single packet, the numbytes value<br />
should be sized small enough to allow for header and CRC information, as well as translation to<br />
ASCII if that is the selected protocol (the ASCII protocol uses two bytes to represent every data<br />
byte). If numbytes is *, the all log records found will be returned. Regardless of the requested<br />
numbytes, only complete log records are returned.<br />
The format of the reply is as follows:<br />
GLR,status,recordID,numbytes,data[numbytes,data]<br />
The value of status can be any of the following values:<br />
Value Description<br />
0 Ok.<br />
1 File not found.<br />
6 Record not found.<br />
7 Command format error<br />
The datetime value in the response message is the datetime of the returned record and, therefore, may be<br />
different from the datetime in the GetLog command statement.<br />
The data to the end of the file can be read by leaving datetime at the desired starting point and incrementing<br />
recordID until the status indicates record not found. The [numbytes,data] represents an additional record of<br />
data if there is room in the message.<br />
Example:<br />
command: GL,data,02/07/2007 15:50:00,80,0<br />
reply: GLR,0,0,38,02/07/2007,15:51:00,VBAT,13.16,Volts,G<br />
37,10/07/2003,15:51:10,A,10.89,5.2,-25.4<br />
command: GL,data,02/07/2007 15:50:00,80,2<br />
reply: GLR,0,2,37,02/07/2007,15:54:00,C,10.89,5.2,-25.4,0<br />
The GLR response will contain as many log records as can fit into the response.<br />
The numbytes value in the GLR response does not include the comma preceding the data, and refers to the<br />
number of data bytes from the log that are being returned, not the number of packet bytes used to store the<br />
response (which would be twice the data bytes when ASCII protocol is selected).<br />
Bringing the Benefits of Real-Time Data Collection to the World<br />
57<br />
Wrapped for<br />
illustration<br />
purposes only.
Appendix A – Specifications for the radar<br />
Radar Type (FCC) 6.6 GHz pulse echo<br />
FCC ID HDBRLR-0003-1<br />
FCC Standard: Part 15.250<br />
Radar Type (NTIA) 6.2 GHz pulse echo<br />
Beam width ±16° HPBW<br />
Range 60 feet (18.3 meters)<br />
Resolution 0.01 ft<br />
Clock Internal real-time clock w/battery backup ±2 minutes a month (0 to<br />
+ 50C)<br />
Log Intervals User selectable<br />
Sampling rate 10 Hz<br />
Averaging Intervals User selectable<br />
Log capacity > 300,000 readings<br />
Flash memory for data & events<br />
Operator Interface 6-Button front panel w/2-line display<br />
(RLR-0001-1 only)<br />
SDI-12 & command line via RS-232<br />
Data <strong>Download</strong>s Laptop, desktop, pocket PC via command line<br />
Password Required Password Option for Setup Changes & Stage Adjustment<br />
Setup Data Setup Stored in Non-Volatile Flash Memory<br />
Status Lights Two on Front Panel Provide "Heartbeat" & Run/Error Status (RLR<br />
-0001-1 only)<br />
Mechanical RLR-0001-1:<br />
Enclosure : NEMA-4 plastic<br />
Dimensions: 5.2"X 7.1" X 5.75"<br />
Weight: 2 lbs<br />
RLR-0003-1 models:<br />
Enclosure : NEMA-4 ABS plastic<br />
Dimensions: Cylindrical<br />
Diameter = 6.625 inches<br />
Height = 12 inches<br />
Weight: 6.85 lbs<br />
Environmental IP66 and IP68 rated<br />
Operating Temperature -40 to +60 °C<br />
LCD operates to -10° C<br />
Data Connection For RLR-0001-1 only<br />
RS 232 DB9 (female) for direct connection to<br />
PC/PDA/cell modem<br />
Provides +5V on pin 9 w/capacity of 71 mA to<br />
power external devices, ie, Bluetooth, etc.<br />
Power Consumption
Ordering Information<br />
Part Number Description<br />
RLR-0001-1* RLR, NTIA, display, 10 foot SDI-12 cable<br />
RLR-0003-1 REVF RLR, FCC, no display, 25 foot removable cable<br />
RLR-0003-1 REVH RLR, NTIA, no display, 25 foot non-removable cable<br />
RLR-0003-1 REVN RLR, NTIA, no display, 25 foot removable cable<br />
6661-1265-2 NEMA-4 enclosure for RLR-0001-1. Order separately.<br />
*Do not install the RLR-0001-1 outdoors without an enclosure such as the 6661-1265-2<br />
Bringing the Benefits of Real-Time Data Collection to the World<br />
<strong>Sutron</strong> <strong>Corporation</strong>, 21300 Ridgetop Circle, Sterling, Virginia 20166-6520<br />
59
Appendix B – <strong>Sutron</strong> RLR Communicator<br />
<strong>Sutron</strong> RLR communicator program can be used to visualize the radio path seen by <strong>Sutron</strong> Radar. The RLR<br />
communicator's radio path or sweep display will show the reflections the radar is seeing and is a great tool to<br />
quickly identify whether stationary objects like pier on a bridge is causing the radar to register incorrect<br />
targets.<br />
The RLR Communicator program can be downloaded from here:<br />
http://www.sutron.com/products/RadarLevelRecorder2.htm<br />
Sections below explain how to use the software and understand the radar sweeps or radio path.<br />
Quick Instructions for RLR Communicator<br />
Select your RS-232<br />
port through this menu<br />
Graph Palette - use this<br />
perform zoom, pan<br />
operations<br />
When RS-232 port is correct,<br />
the button is enabled and<br />
should say "Start Sweeps"<br />
1. Select "communication -> configure serial port"<br />
to select the serial port and the baud rate.<br />
2. When a correct serial port is selected, the green<br />
"Start Sweeps" will be enabled. Press it to start<br />
capturing sweeps.<br />
3. Press "Stop Sweeps" button to stop acquisition;<br />
4. To close the software, select "File - > Close"<br />
Bringing the Benefits of Real-Time Data Collection to the World<br />
60
Understanding <strong>Sutron</strong> Radar Sweeps<br />
1. Radar scans the area in front of it for possible targets. When targets are present, they usually<br />
present themselves as echoes in the radar scans.<br />
2. In the above illustration, a strong target is located at 5.02 feet, and it presents itself as strong<br />
echo. The second echo at 10 feet is a secondary echo of the target.<br />
3. <strong>Sutron</strong> Radar identifies the first echo, which crosses the threshold (Red Line), as the primary<br />
target.<br />
4. When installing radars, the sweeps can be used as a tool to validate whether a radar is seeing<br />
a correct target, consistently. If the radar is registering other echo as primary target, it is<br />
required to move the radar so that the interfering echo doesn't come before the primary<br />
echo.<br />
Bringing the Benefits of Real-Time Data Collection to the World<br />
61
Appendix C – <strong>Sutron</strong> Customer Service Policy<br />
Dear Customer:<br />
CUSTOMER SERVICE POLICY<br />
Thank you for making the important decision to purchase <strong>Sutron</strong> equipment. All <strong>Sutron</strong> equipment is<br />
manufactured and tested to the highest quality standards as set by <strong>Sutron</strong>’s Quality Assurance Department.<br />
Our Customer Service Representatives have years of experience with equipment, systems, and services. They<br />
are electronic technicians with field and applications experience, not just with a technical background.<br />
Customer Phone Support<br />
Customer Service Representatives routinely handle a wide variety of questions every day. If questions arise,<br />
please feel free to contact me or one of the Customer Service Representatives. We are available from 8:00 am<br />
to 5:00 pm Monday through Friday and will be happy to take your call.<br />
We can answer most sensor and interface questions on the first call. If we cannot quickly answer a question<br />
on an interface, we will work with you until we find a solution.<br />
Sometimes a problem is application related. Although we pride ourselves on handling 95% of application<br />
related questions over the phone, we maintain constant contact with our Integrated Systems Division and<br />
Engineering Division for additional assistance.<br />
Introductory Training<br />
Training is an important part of the <strong>Sutron</strong> Customer Service philosophy. The <strong>Sutron</strong> training policy is<br />
simple---If you buy <strong>Sutron</strong> equipment, you get <strong>Sutron</strong> training! Without the proper training, you cannot take<br />
advantage of the benefits and advantages that <strong>Sutron</strong> equipment provides. We often supply on-site<br />
introductory training at your facility for no charge. You provide the classroom, students, equipment, and<br />
coffee---we'll provide the instructor.<br />
On-Site Visits<br />
Of course not all problems can be fixed over the phone. Sometimes a customer needs an on-site technician to<br />
identify site related problems or troubleshoot a network. <strong>Sutron</strong> can provide these services at a reasonable<br />
cost. Call for details. If you would like to learn more about <strong>Sutron</strong> products email sales@sutron.com<br />
Thanks again for your order,<br />
Paul Delisi<br />
Customer Service Manager<br />
<strong>Sutron</strong> <strong>Corporation</strong><br />
Bringing the Benefits of Real-Time Data Collection to the World<br />
62
Appendix D – Commercial Warranty<br />
SUTRON MANUFACTURED EQUIPMENT<br />
THE SUTRON CORPORATION WARRANTS that the equipment manufactured by its manufacturing<br />
division shall conform to applicable specifications and shall remain free from defects in workmanship and<br />
material for a period ending two years from the date of shipment from <strong>Sutron</strong>’s plant.<br />
<strong>Sutron</strong>’s obligation under this Warranty shall be limited to repair at the factory (21300 Ridgetop Circle,<br />
Sterling, VA 20166), or at its option, replacement of defective product. In no event shall <strong>Sutron</strong> be<br />
responsible for incidental or consequential damages, whether or not foreseeable or whether or not <strong>Sutron</strong> has<br />
knowledge of the possibility of such damages. This warranty shall not apply to products that have been<br />
damaged through negligence, accident, misuse, or acts of nature such as floods, fires, earthquakes, lightning<br />
strikes, etc.<br />
<strong>Sutron</strong>’s liability, whether in contract or in tort, arising out of warranties or representations, instructions or<br />
defects from any cause, shall be limited exclusively to repair or replacement parts under the aforesaid<br />
conditions.<br />
<strong>Sutron</strong> requires the return of the defective electronic products or parts to the factory to establish claim under<br />
this warranty. The customer shall prepay transportation charges to the factory. <strong>Sutron</strong> shall pay transportation<br />
for the return of the repaired equipment to the customer when the validity of the damage claim has been<br />
established. Otherwise, <strong>Sutron</strong> will prepay shipment and bill the customer. All shipments shall be<br />
accomplished by best-way surface freight. <strong>Sutron</strong> shall in no event assume any responsibility for repairs or<br />
alterations made other than by <strong>Sutron</strong>. Any products repaired or replaced under this warranty will be<br />
warranted for the balance of the warranty period or for a period of 90 days from the repair shipment date,<br />
whichever is greater. Products repaired at cost will be warranted for 90 days from the date of shipment.<br />
NON-SUTRON MANUFACTURED EQUIPMENT<br />
The above Warranty applies only to products manufactured by <strong>Sutron</strong>. Equipment provided, but not<br />
manufactured by <strong>Sutron</strong>, is warranted and will be repaired to the extent of and according to the current terms<br />
and conditions of the respective equipment manufacturers.<br />
REPAIR AND RETURN POLICY<br />
<strong>Sutron</strong> maintains a repair department at the factory, 22400 Davis Drive, Sterling, VA 20164. Turn around<br />
time normally ranges from 10-30 days after <strong>Sutron</strong> receives equipment for repair. Call Customer Service at<br />
(703) 406-2800 for a Return Material Authorization (RMA) number. Return the defective equipment to<br />
the factory, transportation charges paid.<br />
EXTENDED WARRANTY AND ON-SITE MAINTENANCE<br />
Extended warranty and on-site maintenance contracts are available. Price quotations may be obtained from<br />
<strong>Sutron</strong> customer service representatives.<br />
Bringing the Benefits of Real-Time Data Collection to the World<br />
63
Appendix E – FCC Information<br />
The <strong>Sutron</strong> Radar model RLR-0003-1 has been designed and tested to comply with the FCC Code of Federal<br />
Regulations Title 47 Part 15 rules for intentional and unintentional radiating devices. Under no circumstance<br />
shall the user open and modify/change in any way the hardware or software content of the product. Opening<br />
of the product (thereby breaking the tamper seals) and/or any of its sub modules for any reason not expressly<br />
approved by the manufacturer will violate any warranty and risk generating illegal emissions that may cause<br />
interference with other equipment. This is a direct violation of the FCC rules.<br />
This equipment has been tested and found to comply with the limits for a Class B digital device, pursuant to<br />
Part 15 of the FCC Rules. These limits are designed to provide reasonable protection against harmful<br />
interference in a residential installation. This equipment generates, uses and can radiate radio frequency<br />
energy and, if not installed and used in accordance with the instructions, may cause harmful interference to<br />
radio communications. However, there is no guarantee that interference will not occur in a particular<br />
installation. If this equipment does cause harmful interference to radio or television reception, which can be<br />
determined by turning the equipment off and on, the user is encouraged to try to correct the interference by<br />
one or more of the following measures:<br />
--Reorient or relocate the receiving antenna.<br />
--Increase the separation between the equipment and receiver.<br />
--Connect the equipment into an outlet on a circuit different from that to which the receiver is connected.<br />
--Consult the dealer or an experienced radio/TV technician for help.<br />
Additional Compliance Information:<br />
1) <strong>Sutron</strong> Water Level Sensor Model Number ‘ RLR-0003-1’.<br />
2) This device complies with part 15 of the FCC Rules. Operation is subject to the following two<br />
conditions: (1) this device may not cause harmful interference, and (2) this device must accept any<br />
interference received, including interference that may cause undesired operation.<br />
3) Contact Information:<br />
<strong>Sutron</strong> <strong>Corporation</strong><br />
22400 Davis Drive<br />
Sterling, VA 20164-4444<br />
Phone: 703-406-2800<br />
Fax: 703-406-2801<br />
Web: http://www.sutron.com/<br />
Bringing the Benefits of Real-Time Data Collection to the World<br />
64
INDEX<br />
Bringing the Benefits of Real-Time Data Collection to the World<br />
65
? 25<br />
Auto Output ....................................................... 35<br />
Automeasure ...................................................... 16<br />
averaging ............................................................ 17<br />
avg time .............................................................. 17<br />
Backlight ............................................................ 24<br />
Battery voltage ................................................... 20<br />
beamwidth .......................................................... 46<br />
Calculating ......................................................... 13<br />
clock ................................................................... 20<br />
Command line .................................................... 34<br />
Connections<br />
DB9 ................................................................ 10<br />
Power ............................................................. 10<br />
RS-232 ........................................................... 10<br />
SDI-12 ............................................................ 10<br />
continous operating mode ......................................<br />
Contrast .............................................................. 24<br />
DB9 .................................................................... 10<br />
Discharge ........................................................... 41<br />
Display<br />
Turning on/off ................................................ 24<br />
Distance to water ................................................ 14<br />
DQAP ................................................................ 17<br />
Error in reading .................................................. 15<br />
Error in Reading ................................................. 13<br />
events ................................................................. 19<br />
Front panel ......................................................... 24<br />
key functions .................................................. 24<br />
Turning on/off ................................................ 24<br />
Front Panel<br />
Menu .............................................................. 26<br />
GPS .................................................................... 49<br />
Hardware Flow Control...................................... 34<br />
Install<br />
Quick ........................................................ 11, 46<br />
Installation ................................................... 46, 48<br />
Last Automeasured............................................. 18<br />
LED .................................................................... 13<br />
local time offset .................................................. 49<br />
lock/unlock ................................................... 21, 23<br />
Log ..................................................................... 18<br />
<strong>Download</strong> ....................................................... 35<br />
Events ............................................................. 19<br />
Format ............................................................ 18<br />
Timestamp ..................................................... 19<br />
Log every sample ............................................... 17<br />
Log every subsample ......................................... 22<br />
Logger<br />
connecting to .................................................. 19<br />
Satlink ............................................................ 20<br />
Measurement point ............................................ 14<br />
Menu Tree ......................................................... 26<br />
Modbus .............................................................. 53<br />
modem ............................................................... 38<br />
Raven ............................................................. 39<br />
Modem<br />
Xpert .............................................................. 39<br />
normal operating mode ...................................... 16<br />
operating modes ................................................. 16<br />
Parshall flume .................................................... 41<br />
password ............................................................ 21<br />
PWM settings .................................................... 21<br />
quality ................................................................ 15<br />
right digits .......................................................... 15<br />
RS-232 ............................................................... 10<br />
RS232 Wakeup .................................................. 34<br />
RTC ................................................................... 20<br />
sample ................................................................ 17<br />
Satlink ................................................................ 20<br />
SDI-12<br />
Connections ................................................... 10<br />
Operation ....................................................... 28<br />
Reference ....................................................... 28<br />
setup<br />
file .................................................................. 38<br />
Setup<br />
capturing ........................................................ 38<br />
saving ............................................................. 38<br />
signal strength .................................................... 15<br />
stage<br />
details ............................................................. 15<br />
measuring ....................................................... 15<br />
right digits ...................................................... 15<br />
units ............................................................... 15<br />
Stage .................................................................. 14<br />
stage details........................................................ 18<br />
Starting radar ..................................................... 13<br />
Stopping radar ................................................... 13<br />
subsample .......................................................... 21<br />
<strong>Sutron</strong> Standard CSV ......................................... 18<br />
Bringing the Benefits of Real-Time Data Collection to the World<br />
<strong>Sutron</strong> <strong>Corporation</strong>, 21300 Ridgetop Circle, Sterling, Virginia 20166-6520<br />
66
Target mode ....................................................... 35<br />
Targeting radar ................................................... 46<br />
terminal block ...................................................... 9<br />
time .................................................................... 20<br />
units ................................................................... 15<br />
Upgrade ............................................................. 48<br />
Weir ................................................................... 41<br />
Bringing the Benefits of Real-Time Data Collection to the World<br />
67