screening elite genotypes and ipm of defoliators in groundnut
screening elite genotypes and ipm of defoliators in groundnut
screening elite genotypes and ipm of defoliators in groundnut
You also want an ePaper? Increase the reach of your titles
YUMPU automatically turns print PDFs into web optimized ePapers that Google loves.
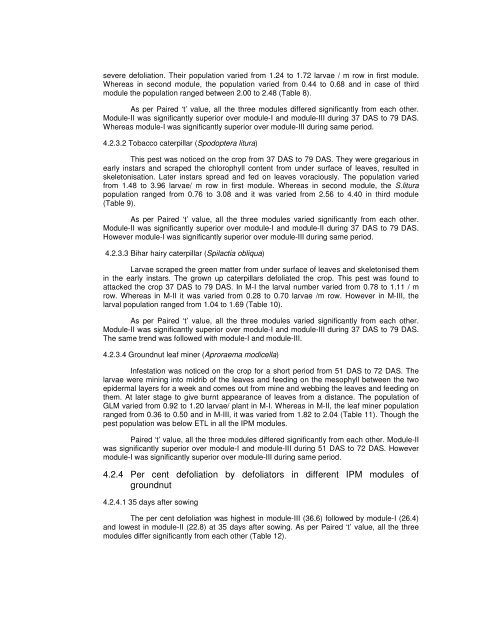
severe defoliation. Their population varied from 1.24 to 1.72 larvae / m row <strong>in</strong> first module.<br />
Whereas <strong>in</strong> second module, the population varied from 0.44 to 0.68 <strong>and</strong> <strong>in</strong> case <strong>of</strong> third<br />
module the population ranged between 2.00 to 2.48 (Table 8).<br />
As per Paired ‘t’ value, all the three modules differed significantly from each other.<br />
Module-II was significantly superior over module-I <strong>and</strong> module-III dur<strong>in</strong>g 37 DAS to 79 DAS.<br />
Whereas module-I was significantly superior over module-III dur<strong>in</strong>g same period.<br />
4.2.3.2 Tobacco caterpillar (Spodoptera litura)<br />
This pest was noticed on the crop from 37 DAS to 79 DAS. They were gregarious <strong>in</strong><br />
early <strong>in</strong>stars <strong>and</strong> scraped the chlorophyll content from under surface <strong>of</strong> leaves, resulted <strong>in</strong><br />
skeletonisation. Later <strong>in</strong>stars spread <strong>and</strong> fed on leaves voraciously. The population varied<br />
from 1.48 to 3.96 larvae/ m row <strong>in</strong> first module. Whereas <strong>in</strong> second module, the S.litura<br />
population ranged from 0.76 to 3.08 <strong>and</strong> it was varied from 2.56 to 4.40 <strong>in</strong> third module<br />
(Table 9).<br />
As per Paired ‘t’ value, all the three modules varied significantly from each other.<br />
Module-II was significantly superior over module-I <strong>and</strong> module-II dur<strong>in</strong>g 37 DAS to 79 DAS.<br />
However module-I was significantly superior over module-III dur<strong>in</strong>g same period.<br />
4.2.3.3 Bihar hairy caterpillar (Spilactia obliqua)<br />
Larvae scraped the green matter from under surface <strong>of</strong> leaves <strong>and</strong> skeletonised them<br />
<strong>in</strong> the early <strong>in</strong>stars. The grown up caterpillars defoliated the crop. This pest was found to<br />
attacked the crop 37 DAS to 79 DAS. In M-I the larval number varied from 0.78 to 1.11 / m<br />
row. Whereas <strong>in</strong> M-II it was varied from 0.28 to 0.70 larvae /m row. However <strong>in</strong> M-III, the<br />
larval population ranged from 1.04 to 1.69 (Table 10).<br />
As per Paired ‘t’ value, all the three modules varied significantly from each other.<br />
Module-II was significantly superior over module-I <strong>and</strong> module-III dur<strong>in</strong>g 37 DAS to 79 DAS.<br />
The same trend was followed with module-I <strong>and</strong> module-III.<br />
4.2.3.4 Groundnut leaf m<strong>in</strong>er (Aproraema modicella)<br />
Infestation was noticed on the crop for a short period from 51 DAS to 72 DAS. The<br />
larvae were m<strong>in</strong><strong>in</strong>g <strong>in</strong>to midrib <strong>of</strong> the leaves <strong>and</strong> feed<strong>in</strong>g on the mesophyll between the two<br />
epidermal layers for a week <strong>and</strong> comes out from m<strong>in</strong>e <strong>and</strong> webb<strong>in</strong>g the leaves <strong>and</strong> feed<strong>in</strong>g on<br />
them. At later stage to give burnt appearance <strong>of</strong> leaves from a distance. The population <strong>of</strong><br />
GLM varied from 0.92 to 1.20 larvae/ plant <strong>in</strong> M-I. Whereas <strong>in</strong> M-II, the leaf m<strong>in</strong>er population<br />
ranged from 0.36 to 0.50 <strong>and</strong> <strong>in</strong> M-III, it was varied from 1.82 to 2.04 (Table 11). Though the<br />
pest population was below ETL <strong>in</strong> all the IPM modules.<br />
Paired ‘t’ value, all the three modules differed significantly from each other. Module-II<br />
was significantly superior over module-I <strong>and</strong> module-III dur<strong>in</strong>g 51 DAS to 72 DAS. However<br />
module-I was significantly superior over module-III dur<strong>in</strong>g same period.<br />
4.2.4 Per cent defoliation by <strong>defoliators</strong> <strong>in</strong> different IPM modules <strong>of</strong><br />
<strong>groundnut</strong><br />
4.2.4.1 35 days after sow<strong>in</strong>g<br />
The per cent defoliation was highest <strong>in</strong> module-III (36.6) followed by module-I (26.4)<br />
<strong>and</strong> lowest <strong>in</strong> module-II (22.8) at 35 days after sow<strong>in</strong>g. As per Paired ‘t’ value, all the three<br />
modules differ significantly from each other (Table 12).


