

Annual Report 2012
Annual Report 2012
Annual Report 2012

Create successful ePaper yourself
Turn your PDF publications into a flip-book with our unique Google optimized e-Paper software.
MANAGEMENT’S DISCUSSION AND ANALYSIS<br />
THE FOLLOWING DISCUSSION AND ANALYSIS SHOULD BE READ IN CONJUNCTION WITH THE<br />
COMPANY’S AUDITED FINANCIAL STATEMENTS AND THE ACCOMPANYING NOTES. PARTS OF THE<br />
FOLLOWING CONCERNED FINANCIAL DATA WERE ABSTRACTED FROM THE COMPANY’S AUDITED<br />
FINANCIAL STATEMENTS THAT HAVE BEEN PREPARED ACCORDING TO THE INTERNATIONAL<br />
FINANCIAL REPORTING STANDARDS, UNLESS OTHERWISE STATED. THE PRICES IN THE FOLLOWING<br />
DISCUSSION DO NOT INCLUDE VALUE-ADDED TAX.<br />
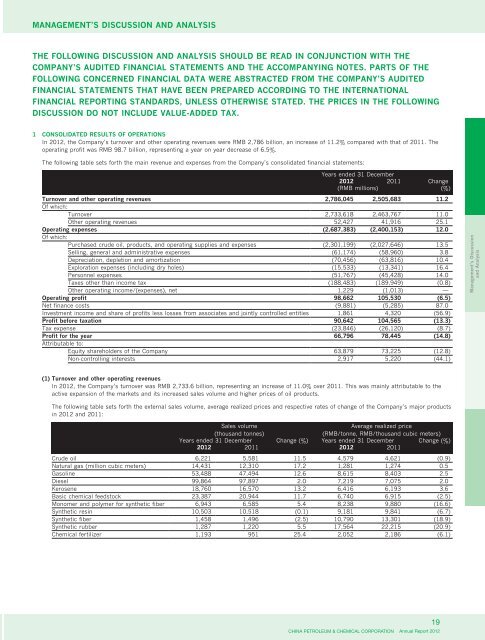
1 CONSOLIDATED RESULTS OF OPERATIONS<br />
In <strong>2012</strong>, the Company’s turnover and other operating revenues were RMB 2,786 billion, an increase of 11.2% compared with that of 2011. The<br />
operating profit was RMB 98.7 billion, representing a year on year decrease of 6.5%.<br />
The following table sets forth the main revenue and expenses from the Company’s consolidated financial statements:<br />
Years ended 31 December<br />
<strong>2012</strong> 2011 Change<br />
(RMB millions) (%)<br />
Turnover and other operating revenues 2,786,045 2,505,683 11.2<br />
Of which:<br />
Turnover 2,733,618 2,463,767 11.0<br />
Other operating revenues 52,427 41,916 25.1<br />
Operating expenses (2,687,383) (2,400,153) 12.0<br />
Of which:<br />
Purchased crude oil, products, and operating supplies and expenses (2,301,199) (2,027,646) 13.5<br />
Selling, general and administrative expenses (61,174) (58,960) 3.8<br />
Depreciation, depletion and amortization (70,456) (63,816) 10.4<br />
Exploration expenses (including dry holes) (15,533) (13,341) 16.4<br />
Personnel expenses (51,767) (45,428) 14.0<br />
Taxes other than income tax (188,483) (189,949) (0.8)<br />
Other operating income/(expenses), net 1,229 (1,013) —<br />
Operating profit 98,662 105,530 (6.5)<br />
Net finance costs (9,881) (5,285) 87.0<br />
Investment income and share of profits less losses from associates and jointly controlled entities 1,861 4,320 (56.9)<br />
Profit before taxation 90,642 104,565 (13.3)<br />
Tax expense (23,846) (26,120) (8.7)<br />
Profit for the year 66,796 78,445 (14.8)<br />
Attributable to:<br />
Equity shareholders of the Company 63,879 73,225 (12.8)<br />
Non-controlling interests 2,917 5,220 (44.1)<br />
(1) Turnover and other operating revenues<br />
In <strong>2012</strong>, the Company’s turnover was RMB 2,733.6 billion, representing an increase of 11.0% over 2011. This was mainly attributable to the<br />
active expansion of the markets and its increased sales volume and higher prices of oil products.<br />
The following table sets forth the external sales volume, average realized prices and respective rates of change of the Company’s major products<br />
in <strong>2012</strong> and 2011:<br />
Sales volume<br />
Average realized price<br />
(thousand tonnes)<br />
(RMB/tonne, RMB/thousand cubic meters)<br />
Years ended 31 December Change (%) Years ended 31 December Change (%)<br />
<strong>2012</strong> 2011 <strong>2012</strong> 2011<br />
Crude oil 6,221 5,581 11.5 4,579 4,621 (0.9)<br />
Natural gas (million cubic meters) 14,431 12,310 17.2 1,281 1,274 0.5<br />
Gasoline 53,488 47,494 12.6 8,615 8,403 2.5<br />
Diesel 99,864 97,897 2.0 7,219 7,075 2.0<br />
Kerosene 18,760 16,570 13.2 6,416 6,193 3.6<br />
Basic chemical feedstock 23,387 20,944 11.7 6,740 6,915 (2.5)<br />
Monomer and polymer for synthetic fiber 6,943 6,585 5.4 8,238 9,880 (16.6)<br />
Synthetic resin 10,503 10,518 (0.1) 9,181 9,841 (6.7)<br />
Synthetic fiber 1,458 1,496 (2.5) 10,790 13,301 (18.9)<br />
Synthetic rubber 1,287 1,220 5.5 17,564 22,215 (20.9)<br />
Chemical fertilizer 1,193 951 25.4 2,052 2,186 (6.1)<br />
19<br />
CHINA PETROLEUM & CHEMICAL CORPORATION <strong>Annual</strong> <strong>Report</strong> <strong>2012</strong><br />
Management’s Discussion<br />
and Analysis