

Annual Report 2012
Annual Report 2012
Annual Report 2012

You also want an ePaper? Increase the reach of your titles
YUMPU automatically turns print PDFs into web optimized ePapers that Google loves.
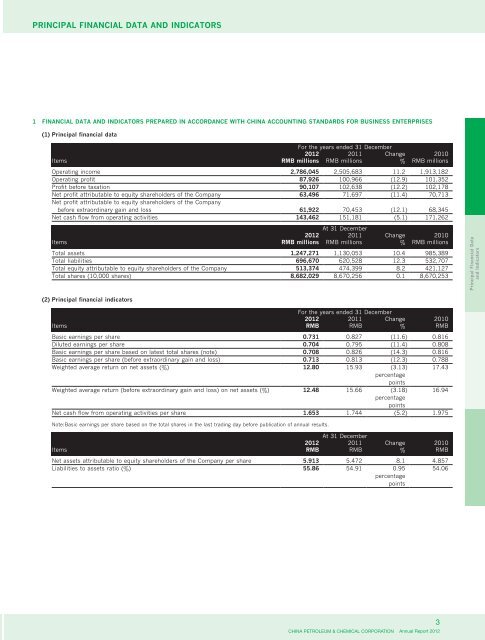
PRINCIPAL FINANCIAL DATA AND INDICATORS<br />
1 FINANCIAL DATA AND INDICATORS PREPARED IN ACCORDANCE WITH CHINA ACCOUNTING STANDARDS FOR BUSINESS ENTERPRISES<br />
(1) Principal financial data<br />
For the years ended 31 December<br />
<strong>2012</strong> 2011 Change 2010<br />
Items RMB millions RMB millions % RMB millions<br />
Operating income 2,786,045 2,505,683 11.2 1,913,182<br />
Operating profit 87,926 100,966 (12.9) 101,352<br />
Profit before taxation 90,107 102,638 (12.2) 102,178<br />
Net profit attributable to equity shareholders of the Company 63,496 71,697 (11.4) 70,713<br />
Net profit attributable to equity shareholders of the Company<br />
before extraordinary gain and loss 61,922 70,453 (12.1) 68,345<br />
Net cash flow from operating activities 143,462 151,181 (5.1) 171,262<br />
At 31 December<br />
<strong>2012</strong> 2011 Change 2010<br />
Items RMB millions RMB millions % RMB millions<br />
Total assets 1,247,271 1,130,053 10.4 985,389<br />
Total liabilities 696,670 620,528 12.3 532,707<br />
Total equity attributable to equity shareholders of the Company 513,374 474,399 8.2 421,127<br />
Total shares (10,000 shares) 8,682,029 8,670,256 0.1 8,670,253<br />
(2) Principal financial indicators<br />
For the years ended 31 December<br />
<strong>2012</strong> 2011 Change 2010<br />
Items RMB RMB % RMB<br />
Basic earnings per share 0.731 0.827 (11.6) 0.816<br />
Diluted earnings per share 0.704 0.795 (11.4) 0.808<br />
Basic earnings per share based on latest total shares (note) 0.708 0.826 (14.3) 0.816<br />
Basic earnings per share (before extraordinary gain and loss) 0.713 0.813 (12.3) 0.788<br />
Weighted average return on net assets (%) 12.80 15.93 (3.13) 17.43<br />
percentage<br />
points<br />
Weighted average return (before extraordinary gain and loss) on net assets (%) 12.48 15.66 (3.18) 16.94<br />
percentage<br />
points<br />
Net cash flow from operating activities per share 1.653 1.744 (5.2) 1.975<br />
Note: Basic earnings per share based on the total shares in the last trading day before publication of annual results.<br />
At 31 December<br />
<strong>2012</strong> 2011 Change 2010<br />
Items RMB RMB % RMB<br />
Net assets attributable to equity shareholders of the Company per share 5.913 5.472 8.1 4.857<br />
Liabilities to assets ratio (%) 55.86 54.91 0.95 54.06<br />
percentage<br />
points<br />
CHINA PETROLEUM & CHEMICAL CORPORATION <strong>Annual</strong> <strong>Report</strong> <strong>2012</strong><br />
3<br />
Principal Financial Data<br />
and Indicators