

Annual Report 2012
Annual Report 2012
Annual Report 2012

You also want an ePaper? Increase the reach of your titles
YUMPU automatically turns print PDFs into web optimized ePapers that Google loves.
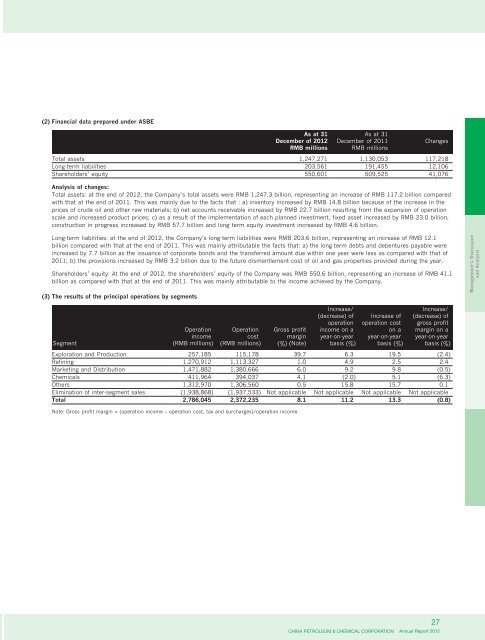
(2) Financial data prepared under ASBE<br />
As at 31 As at 31<br />
December of <strong>2012</strong> December of 2011 Changes<br />
RMB millions RMB millions<br />
Total assets 1,247,271 1,130,053 117,218<br />
Long-term liabilities 203,561 191,455 12,106<br />
Shareholders’ equity 550,601 509,525 41,076<br />
Analysis of changes:<br />
Total assets: at the end of <strong>2012</strong>, the Company’s total assets were RMB 1,247.3 billion, representing an increase of RMB 117.2 billion compared<br />
with that at the end of 2011. This was mainly due to the facts that : a) inventory increased by RMB 14.8 billion because of the increase in the<br />
prices of crude oil and other raw materials; b) net accounts receivable increased by RMB 22.7 billion resulting from the expansion of operation<br />
scale and increased product prices; c) as a result of the implementation of each planned investment, fixed asset increased by RMB 23.0 billion,<br />
construction in progress increased by RMB 57.7 billion and long term equity investment increased by RMB 4.6 billion.<br />
Long-term liabilities: at the end of <strong>2012</strong>, the Company’s long-term liabilities were RMB 203.6 billion, representing an increase of RMB 12.1<br />
billion compared with that at the end of 2011. This was mainly attributable the facts that: a) the long-term debts and debentures payable were<br />
increased by 7.7 billion as the issuance of corporate bonds and the transferred amount due within one year were less as compared with that of<br />
2011; b) the provisions increased by RMB 3.2 billion due to the future dismantlement cost of oil and gas properties provided during the year.<br />
Shareholders’ equity: At the end of <strong>2012</strong>, the shareholders’ equity of the Company was RMB 550.6 billion, representing an increase of RMB 41.1<br />
billion as compared with that at the end of 2011. This was mainly attributable to the income achieved by the Company.<br />
(3) The results of the principal operations by segments<br />
Segment<br />
Operation<br />
income<br />
(RMB millions)<br />
Operation<br />
cost<br />
(RMB millions)<br />
Gross profit<br />
margin<br />
(%) (Note)<br />
Increase/ Increase/<br />
(decrease) of<br />
operation<br />
income on a<br />
year-on-year<br />
basis (%)<br />
Increase of<br />
operation cost<br />
on a<br />
year-on-year<br />
basis (%)<br />
(decrease) of<br />
gross profit<br />
margin on a<br />
year-on-year<br />
basis (%)<br />
Exploration and Production 257,185 115,178 39.7 6.3 19.5 (2.4)<br />
Refining 1,270,912 1,113,327 1.0 4.9 2.5 2.4<br />
Marketing and Distribution 1,471,882 1,380,666 6.0 9.2 9.8 (0.5)<br />
Chemicals 411,964 394,037 4.1 (2.0) 5.1 (6.3)<br />
Others 1,312,970 1,306,560 0.5 15.8 15.7 0.1<br />
Elimination of inter-segment sales (1,938,868) (1,937,533) Not applicable Not applicable Not applicable Not applicable<br />
Total 2,786,045 2,372,235 8.1 11.2 13.3 (0.8)<br />
Note: Gross profit margin = (operation income – operation cost, tax and surcharges)/operation income.<br />
27<br />
CHINA PETROLEUM & CHEMICAL CORPORATION <strong>Annual</strong> <strong>Report</strong> <strong>2012</strong><br />
Management’s Discussion<br />
and Analysis