

Annual Report 2012
Annual Report 2012
Annual Report 2012

You also want an ePaper? Increase the reach of your titles
YUMPU automatically turns print PDFs into web optimized ePapers that Google loves.
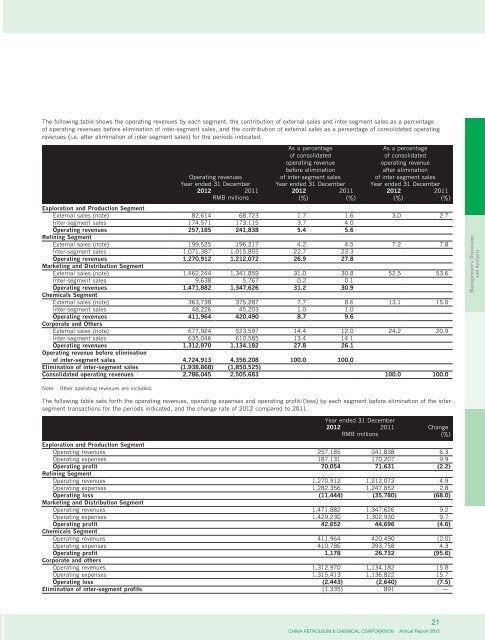
The following table shows the operating revenues by each segment, the contribution of external sales and inter-segment sales as a percentage<br />
of operating revenues before elimination of inter-segment sales, and the contribution of external sales as a percentage of consolidated operating<br />
revenues (i.e. after elimination of inter-segment sales) for the periods indicated.<br />
Operating revenues<br />
As a percentage<br />
of consolidated<br />
operating revenue<br />
before elimination<br />
of inter-segment sales<br />
As a percentage<br />
of consolidated<br />
operating revenue<br />
after elimination<br />
of inter-segment sales<br />
Year ended 31 December Year ended 31 December Year ended 31 December<br />
<strong>2012</strong> 2011 <strong>2012</strong> 2011 <strong>2012</strong> 2011<br />
RMB millions (%) (%) (%) (%)<br />
Exploration and Production Segment<br />
External sales (note) 82,614 68,723 1.7 1.6 3.0 2.7<br />
Inter-segment sales 174,571 173,115 3.7 4.0<br />
Operating revenues 257,185 241,838 5.4 5.6<br />
Refining Segment<br />
External sales (note) 199,525 196,217 4.2 4.5 7.2 7.8<br />
Inter-segment sales 1,071,387 1,015,855 22.7 23.3<br />
Operating revenues 1,270,912 1,212,072 26.9 27.8<br />
Marketing and Distribution Segment<br />
External sales (note) 1,462,244 1,341,859 31.0 30.8 52.5 53.6<br />
Inter-segment sales 9,638 5,767 0.2 0.1<br />
Operating revenues 1,471,882 1,347,626 31.2 30.9<br />
Chemicals Segment<br />
External sales (note) 363,738 375,287 7.7 8.6 13.1 15.0<br />
Inter-segment sales 48,226 45,203 1.0 1.0<br />
Operating revenues 411,964 420,490 8.7 9.6<br />
Corporate and Others<br />
External sales (note) 677,924 523,597 14.4 12.0 24.2 20.9<br />
Inter-segment sales 635,046 610,585 13.4 14.1<br />
Operating revenues 1,312,970 1,134,182 27.8 26.1<br />
Operating revenue before elimination<br />
of inter-segment sales 4,724,913 4,356,208 100.0 100.0<br />
Elimination of inter-segment sales (1,938,868) (1,850,525)<br />
Consolidated operating revenues 2,786,045 2,505,683 100.0 100.0<br />
Note: Other operating revenues are included.<br />
The following table sets forth the operating revenues, operating expenses and operating profit/(loss) by each segment before elimination of the intersegment<br />
transactions for the periods indicated, and the change rate of <strong>2012</strong> compared to 2011.<br />
Year ended 31 December<br />
<strong>2012</strong> 2011 Change<br />
RMB millions (%)<br />
Exploration and Production Segment<br />
Operating revenues 257,185 241,838 6.3<br />
Operating expenses 187,131 170,207 9.9<br />
Operating profit 70,054 71,631 (2.2)<br />
Refining Segment<br />
Operating revenues 1,270,912 1,212,072 4.9<br />
Operating expenses 1,282,356 1,247,852 2.8<br />
Operating loss (11,444) (35,780) (68.0)<br />
Marketing and Distribution Segment<br />
Operating revenues 1,471,882 1,347,626 9.2<br />
Operating expenses 1,429,230 1,302,930 9.7<br />
Operating profit 42,652 44,696 (4.6)<br />
Chemicals Segment<br />
Operating revenues 411,964 420,490 (2.0)<br />
Operating expenses 410,786 393,758 4.3<br />
Operating profit 1,178 26,732 (95.6)<br />
Corporate and others<br />
Operating revenues 1,312,970 1,134,182 15.8<br />
Operating expenses 1,315,413 1,136,822 15.7<br />
Operating loss (2,443) (2,640) (7.5)<br />
Elimination of inter-segment profits (1,335) 891 —<br />
21<br />
CHINA PETROLEUM & CHEMICAL CORPORATION <strong>Annual</strong> <strong>Report</strong> <strong>2012</strong><br />
Management’s Discussion<br />
and Analysis