Financial Responsibility, Personality Traits and Financial Decision ...
Financial Responsibility, Personality Traits and Financial Decision ...
Financial Responsibility, Personality Traits and Financial Decision ...
You also want an ePaper? Increase the reach of your titles
YUMPU automatically turns print PDFs into web optimized ePapers that Google loves.
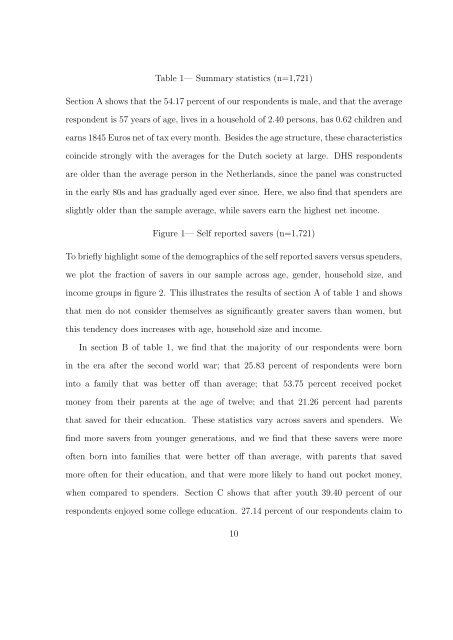
Table 1— Summary statistics (n=1,721)<br />
Section A shows that the 54.17 percent of our respondents is male, <strong>and</strong> that the average<br />
respondent is 57 years of age, lives in a household of 2.40 persons, has 0.62 children <strong>and</strong><br />
earns 1845 Euros net of tax every month. Besides the age structure, these characteristics<br />
coincide strongly with the averages for the Dutch society at large. DHS respondents<br />
are older than the average person in the Netherl<strong>and</strong>s, since the panel was constructed<br />
in the early 80s <strong>and</strong> has gradually aged ever since. Here, we also find that spenders are<br />
slightly older than the sample average, while savers earn the highest net income.<br />
Figure 1— Self reported savers (n=1,721)<br />
To briefly highlight some of the demographics of the self reported savers versus spenders,<br />
we plot the fraction of savers in our sample across age, gender, household size, <strong>and</strong><br />
income groups in figure 2. This illustrates the results of section A of table 1 <strong>and</strong> shows<br />
that men do not consider themselves as significantly greater savers than women, but<br />
this tendency does increases with age, household size <strong>and</strong> income.<br />
In section B of table 1, we find that the majority of our respondents were born<br />
in the era after the second world war; that 25.83 percent of respondents were born<br />
into a family that was better off than average; that 53.75 percent received pocket<br />
money from their parents at the age of twelve; <strong>and</strong> that 21.26 percent had parents<br />
that saved for their education. These statistics vary across savers <strong>and</strong> spenders. We<br />
find more savers from younger generations, <strong>and</strong> we find that these savers were more<br />
often born into families that were better off than average, with parents that saved<br />
more often for their education, <strong>and</strong> that were more likely to h<strong>and</strong> out pocket money,<br />
when compared to spenders. Section C shows that after youth 39.40 percent of our<br />
respondents enjoyed some college education. 27.14 percent of our respondents claim to<br />
10


