abstract models of noc-based mpsocs for design space exploration
abstract models of noc-based mpsocs for design space exploration
abstract models of noc-based mpsocs for design space exploration
Create successful ePaper yourself
Turn your PDF publications into a flip-book with our unique Google optimized e-Paper software.
!<br />
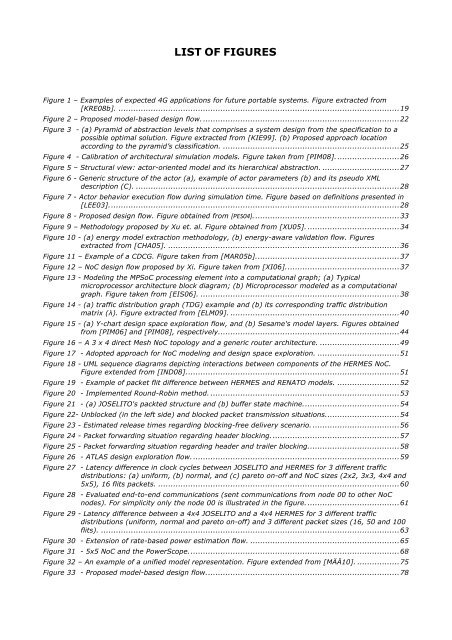
LIST OF FIGURES<br />
Figure 1 – Examples <strong>of</strong> expected 4G applications <strong>for</strong> future portable systems. Figure extracted from<br />
[KRE08b]. ................................................................................................................. 19!<br />
Figure 2 – Proposed model-<strong>based</strong> <strong>design</strong> flow. ............................................................................... 22!<br />
Figure 3 - (a) Pyramid <strong>of</strong> <strong>abstract</strong>ion levels that comprises a system <strong>design</strong> from the specification to a<br />
possible optimal solution. Figure extracted from [KIE99]. (b) Proposed approach location<br />
according to the pyramid’s classification. ....................................................................... 25!<br />
Figure 4 - Calibration <strong>of</strong> architectural simulation <strong>models</strong>. Figure taken from [PIM08]. ......................... 26!<br />
Figure 5 – Structural view: actor-oriented model and its hierarchical <strong>abstract</strong>ion. ............................... 27!<br />
Figure 6 - Generic structure <strong>of</strong> the actor (a), example <strong>of</strong> actor parameters (b) and its pseudo XML<br />
description (C). .......................................................................................................... 28!<br />
Figure 7 - Actor behavior execution flow during simulation time. Figure <strong>based</strong> on definitions presented in<br />
[LEE03]. .................................................................................................................... 28!<br />
Figure 8 - Proposed <strong>design</strong> flow. Figure obtained from [PES04]. .......................................................... 33!<br />
Figure 9 – Methodology proposed by Xu et. al. Figure obtained from [XU05]. ..................................... 34!<br />
Figure 10 - (a) energy model extraction methodology, (b) energy-aware validation flow. Figures<br />
extracted from [CHA05]. ............................................................................................. 36!<br />
Figure 11 – Example <strong>of</strong> a CDCG. Figure taken from [MAR05b]. ......................................................... 37!<br />
Figure 12 – NoC <strong>design</strong> flow proposed by Xi. Figure taken from [XI06]. ............................................. 37!<br />
Figure 13 - Modeling the MPSoC processing element into a computational graph; (a) Typical<br />
microprocessor architecture block diagram; (b) Microprocessor modeled as a computational<br />
graph. Figure taken from [EIS06]. ................................................................................ 38!<br />
Figure 14 - (a) traffic distribution graph (TDG) example and (b) its corresponding traffic distribution<br />
matrix (λ). Figure extracted from [ELM09]. .................................................................... 40!<br />
Figure 15 - (a) Y-chart <strong>design</strong> <strong>space</strong> <strong>exploration</strong> flow, and (b) Sesame's model layers. Figures obtained<br />
from [PIM06] and [PIM08], respectively. ........................................................................ 44!<br />
Figure 16 – A 3 x 4 direct Mesh NoC topology and a generic router architecture. ................................ 49!<br />
Figure 17 - Adopted approach <strong>for</strong> NoC modeling and <strong>design</strong> <strong>space</strong> <strong>exploration</strong>. ................................. 51!<br />
Figure 18 - UML sequence diagrams depicting interactions between components <strong>of</strong> the HERMES NoC.<br />
Figure extended from [IND08]. ..................................................................................... 51!<br />
Figure 19 - Example <strong>of</strong> packet flit difference between HERMES and RENATO <strong>models</strong>. ......................... 52!<br />
Figure 20 - Implemented Round-Robin method. ............................................................................ 53!<br />
Figure 21 - (a) JOSELITO's packted structure and (b) buffer state machine. ...................................... 54!<br />
Figure 22- Unblocked (in the left side) and blocked packet transmission situations. ............................. 54!<br />
Figure 23 - Estimated release times regarding blocking-free delivery scenario. ................................... 56!<br />
Figure 24 - Packet <strong>for</strong>warding situation regarding header blocking. ................................................... 57!<br />
Figure 25 - Packet <strong>for</strong>warding situation regarding header and trailer blocking. .................................... 58!<br />
Figure 26 - ATLAS <strong>design</strong> <strong>exploration</strong> flow. ................................................................................... 59!<br />
Figure 27 - Latency difference in clock cycles between JOSELITO and HERMES <strong>for</strong> 3 different traffic<br />
distributions: (a) uni<strong>for</strong>m, (b) normal, and (c) pareto on-<strong>of</strong>f and NoC sizes (2x2, 3x3, 4x4 and<br />
5x5), 16 flits packets. ................................................................................................. 60!<br />
Figure 28 - Evaluated end-to-end communications (sent communications from node 00 to other NoC<br />
nodes). For simplicity only the node 00 is illustrated in the figure. ..................................... 61!<br />
Figure 29 - Latency difference between a 4x4 JOSELITO and a 4x4 HERMES <strong>for</strong> 3 different traffic<br />
distributions (uni<strong>for</strong>m, normal and pareto on-<strong>of</strong>f) and 3 different packet sizes (16, 50 and 100<br />
flits). ........................................................................................................................ 63!<br />
Figure 30 - Extension <strong>of</strong> rate-<strong>based</strong> power estimation flow. ............................................................ 65!<br />
Figure 31 - 5x5 NoC and the PowerScope. .................................................................................... 68!<br />
Figure 32 – An example <strong>of</strong> a unified model representation. Figure extended from [MÄÄ10]. ................. 75!<br />
Figure 33 - Proposed model-<strong>based</strong> <strong>design</strong> flow. ............................................................................. 78!


