abstract models of noc-based mpsocs for design space exploration
abstract models of noc-based mpsocs for design space exploration
abstract models of noc-based mpsocs for design space exploration
Create successful ePaper yourself
Turn your PDF publications into a flip-book with our unique Google optimized e-Paper software.
!<br />
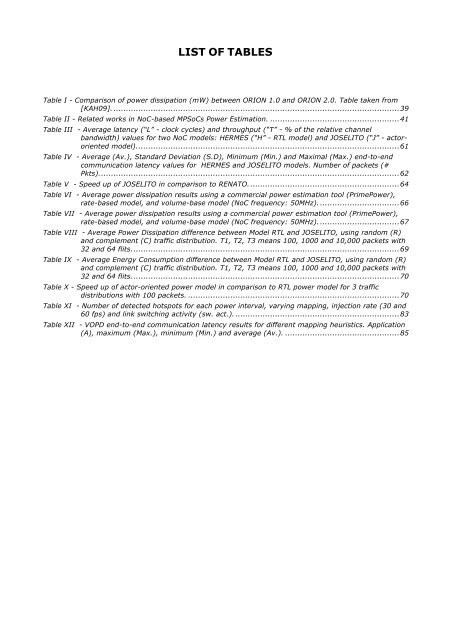
LIST OF TABLES<br />
Table I - Comparison <strong>of</strong> power dissipation (mW) between ORION 1.0 and ORION 2.0. Table taken from<br />
[KAH09]. ................................................................................................................... 39!<br />
Table II - Related works in NoC-<strong>based</strong> MPSoCs Power Estimation. .................................................... 41!<br />
Table III - Average latency (“L” - clock cycles) and throughput (“T” - % <strong>of</strong> the relative channel<br />
bandwidth) values <strong>for</strong> two NoC <strong>models</strong>: HERMES (“H” - RTL model) and JOSELITO (“J” - actororiented<br />
model). ......................................................................................................... 61!<br />
Table IV - Average (Av.), Standard Deviation (S.D), Minimum (Min.) and Maximal (Max.) end-to-end<br />
communication latency values <strong>for</strong> HERMES and JOSELITO <strong>models</strong>. Number <strong>of</strong> packets (#<br />
Pkts). ........................................................................................................................ 62!<br />
Table V - Speed up <strong>of</strong> JOSELITO in comparison to RENATO. ............................................................ 64!<br />
Table VI - Average power dissipation results using a commercial power estimation tool (PrimePower),<br />
rate-<strong>based</strong> model, and volume-base model (NoC frequency: 50MHz). ................................ 66!<br />
Table VII - Average power dissipation results using a commercial power estimation tool (PrimePower),<br />
rate-<strong>based</strong> model, and volume-base model (NoC frequency: 50MHz). ................................ 67!<br />
Table VIII - Average Power Dissipation difference between Model RTL and JOSELITO, using random (R)<br />
and complement (C) traffic distribution. T1, T2, T3 means 100, 1000 and 10,000 packets with<br />
32 and 64 flits. ........................................................................................................... 69!<br />
Table IX - Average Energy Consumption difference between Model RTL and JOSELITO, using random (R)<br />
and complement (C) traffic distribution. T1, T2, T3 means 100, 1000 and 10,000 packets with<br />
32 and 64 flits. ........................................................................................................... 70!<br />
Table X - Speed up <strong>of</strong> actor-oriented power model in comparison to RTL power model <strong>for</strong> 3 traffic<br />
distributions with 100 packets. ..................................................................................... 70!<br />
Table XI - Number <strong>of</strong> detected hotspots <strong>for</strong> each power interval, varying mapping, injection rate (30 and<br />
60 fps) and link switching activity (sw. act.). .................................................................. 83!<br />
Table XII - VOPD end-to-end communication latency results <strong>for</strong> different mapping heuristics. Application<br />
(A), maximum (Max.), minimum (Min.) and average (Av.). .............................................. 85!


