President
President
President

Create successful ePaper yourself
Turn your PDF publications into a flip-book with our unique Google optimized e-Paper software.
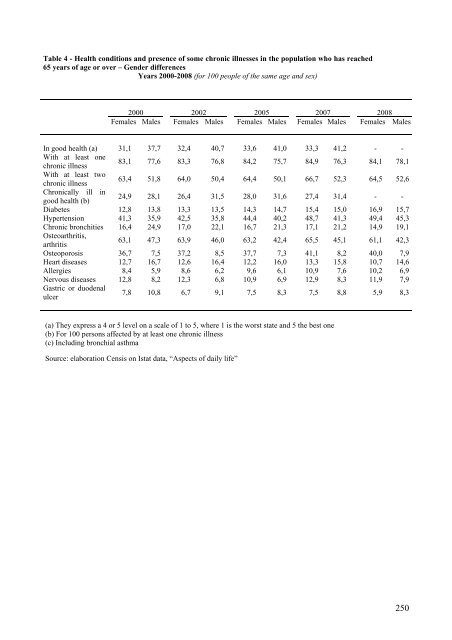
Table 4 - Health conditions and presence of some chronic illnesses in the population who has reached<br />
65 years of age or over – Gender differences<br />
Years 2000-2008 (for 100 people of the same age and sex)<br />
2000 2002 2005 2007 2008<br />
Females Males Females Males Females Males Females Males Females Males<br />
In good health (a) 31,1 37,7 32,4 40,7 33,6 41,0 33,3 41,2 - -<br />
With at least one<br />
chronic illness<br />
83,1 77,6 83,3 76,8 84,2 75,7 84,9 76,3 84,1 78,1<br />
With at least two<br />
chronic illness<br />
63,4 51,8 64,0 50,4 64,4 50,1 66,7 52,3 64,5 52,6<br />
Chronically ill in<br />
good health (b)<br />
24,9 28,1 26,4 31,5 28,0 31,6 27,4 31,4 - -<br />
Diabetes 12,8 13,8 13,3 13,5 14,3 14,7 15,4 15,0 16,9 15,7<br />
Hypertension 41,3 35,9 42,5 35,8 44,4 40,2 48,7 41,3 49,4 45,3<br />
Chronic bronchities 16,4 24,9 17,0 22,1 16,7 21,3 17,1 21,2 14,9 19,1<br />
Osteoarthritis,<br />
arthritis<br />
63,1 47,3 63,9 46,0 63,2 42,4 65,5 45,1 61,1 42,3<br />
Osteoporosis 36,7 7,5 37,2 8,5 37,7 7,3 41,1 8,2 40,0 7,9<br />
Heart diseases 12,7 16,7 12,6 16,4 12,2 16,0 13,3 15,8 10,7 14,6<br />
Allergies 8,4 5,9 8,6 6,2 9,6 6,1 10,9 7,6 10,2 6,9<br />
Nervous diseases 12,8 8,2 12,3 6,8 10,9 6,9 12,9 8,3 11,9 7,9<br />
Gastric or duodenal<br />
ulcer<br />
7,8 10,8 6,7 9,1 7,5 8,3 7,5 8,8 5,9 8,3<br />
(a) They express a 4 or 5 level on a scale of 1 to 5, where 1 is the worst state and 5 the best one<br />
(b) For 100 persons affected by at least one chronic illness<br />
(c) Including bronchial asthma<br />
Source: elaboration Censis on Istat data, “Aspects of daily life”<br />
250