

Annual Report 2007 - The Australian Nanotechnology Network
Annual Report 2007 - The Australian Nanotechnology Network
Annual Report 2007 - The Australian Nanotechnology Network

You also want an ePaper? Increase the reach of your titles
YUMPU automatically turns print PDFs into web optimized ePapers that Google loves.
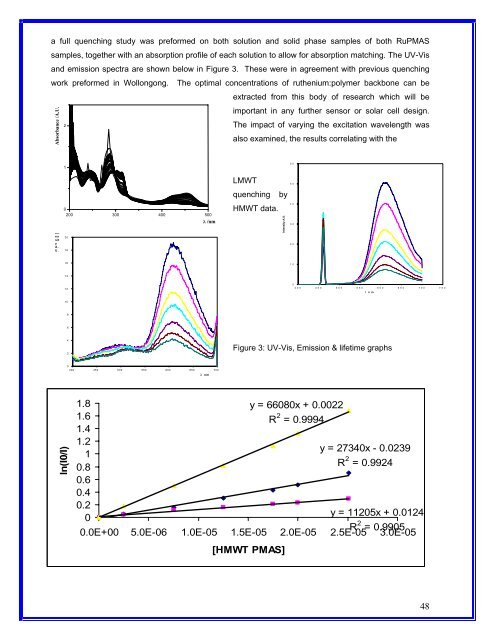
a full quenching study was preformed on both solution and solid phase samples of both RuPMAS<br />
samples, together with an absorption profile of each solution to allow for absorption matching. <strong>The</strong> UV-Vis<br />
and emission spectra are shown below in Figure 3. <strong>The</strong>se were in agreement with previous quenching<br />
work preformed in Wollongong. <strong>The</strong> optimal concentrations of ruthenium:polymer backbone can be<br />
extracted from this body of research which will be<br />
important in any further sensor or solar cell design.<br />
2<br />
<strong>The</strong> impact of varying the excitation wavelength was<br />
also examined, the results correlating with the<br />
Absorbance /A.U.<br />
Int<br />
en<br />
sit<br />
y<br />
A.<br />
U.<br />
1<br />
0<br />
200 300 400 500<br />
λ /nm<br />
20<br />
18<br />
16<br />
14<br />
12<br />
10<br />
8<br />
6<br />
4<br />
2<br />
ln(I0/I)<br />
0<br />
400 450 500 550 600 650 700<br />
λ nm<br />
LMWT<br />
quenching by<br />
HMWT data.<br />
Intensity A.U.<br />
60<br />
50<br />
40<br />
30<br />
20<br />
10<br />
0<br />
400 450 500 550 600 650 700 750<br />
l n m<br />
Figure 3: UV-Vis, Emission & lifetime graphs<br />
y = 66080x + 0.0022<br />
R 2 = 0.9994<br />
y = 27340x - 0.0239<br />
R 2 = 0.9924<br />
y = 11205x + 0.0124<br />
R 2 1.8<br />
1.6<br />
1.4<br />
1.2<br />
1<br />
0.8<br />
0.6<br />
0.4<br />
0.2<br />
0<br />
0.0E+00 5.0E-06 1.0E-05 1.5E-05 2.0E-05<br />
= 0.9905<br />
2.5E-05 3.0E-05<br />
[HMWT PMAS]<br />
48
