

Engineering geology of British rocks and soils Mudstones of the ...
Engineering geology of British rocks and soils Mudstones of the ...
Engineering geology of British rocks and soils Mudstones of the ...

You also want an ePaper? Increase the reach of your titles
YUMPU automatically turns print PDFs into web optimized ePapers that Google loves.
Plasticity index (%)<br />
Plasticity index (%)<br />
Plasticity index (%) Plasticity index (%)<br />
50<br />
40<br />
30<br />
20<br />
10<br />
0<br />
40<br />
30<br />
20<br />
10<br />
0<br />
40<br />
30<br />
20<br />
10<br />
0<br />
40<br />
30<br />
20<br />
10<br />
0<br />
0<br />
Area 1 LKM Area 1 LKSB<br />
Area 1 MKM Area 2<br />
Area 3 Twm Area 4<br />
Area 5 Area 6<br />
10 20 30 40 50 60 70 80 90<br />
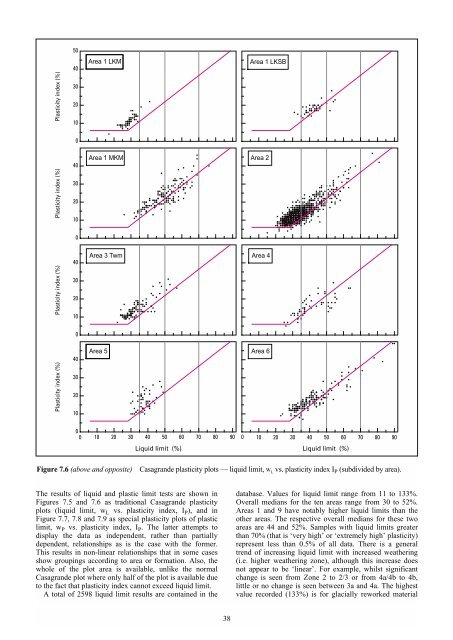
The results <strong>of</strong> liquid <strong>and</strong> plastic limit tests are shown in<br />
Figures 7.5 <strong>and</strong> 7.6 as traditional Casagr<strong>and</strong>e plasticity<br />
plots (liquid limit, w L vs. plasticity index, I P), <strong>and</strong> in<br />
Figure 7.7, 7.8 <strong>and</strong> 7.9 as special plasticity plots <strong>of</strong> plastic<br />
limit, w P vs. plasticity index, I P. The latter attempts to<br />
display <strong>the</strong> data as independent, ra<strong>the</strong>r than partially<br />
dependent, relationships as is <strong>the</strong> case with <strong>the</strong> former.<br />
This results in non-linear relationships that in some cases<br />
show groupings according to area or formation. Also, <strong>the</strong><br />
whole <strong>of</strong> <strong>the</strong> plot area is available, unlike <strong>the</strong> normal<br />
Casagr<strong>and</strong>e plot where only half <strong>of</strong> <strong>the</strong> plot is available due<br />
to <strong>the</strong> fact that plasticity index cannot exceed liquid limit.<br />
A total <strong>of</strong> 2598 liquid limit results are contained in <strong>the</strong><br />
Liquid limit (%) Liquid limit (%)<br />
38<br />
0<br />
10 20 30 40 50 60 70 80 90<br />
Figure 7.6 (above <strong>and</strong> opposite) Casagr<strong>and</strong>e plasticity plots — liquid limit, W L vs. plasticity index I P (subdivided by area).<br />
database. Values for liquid limit range from 11 to 133%.<br />
Overall medians for <strong>the</strong> ten areas range from 30 to 52%.<br />
Areas 1 <strong>and</strong> 9 have notably higher liquid limits than <strong>the</strong><br />
o<strong>the</strong>r areas. The respective overall medians for <strong>the</strong>se two<br />
areas are 44 <strong>and</strong> 52%. Samples with liquid limits greater<br />
than 70% (that is ‘very high’ or ‘extremely high’ plasticity)<br />
represent less than 0.5% <strong>of</strong> all data. There is a general<br />
trend <strong>of</strong> increasing liquid limit with increased wea<strong>the</strong>ring<br />
(i.e. higher wea<strong>the</strong>ring zone), although this increase does<br />
not appear to be ‘linear’. For example, whilst significant<br />
change is seen from Zone 2 to 2/3 or from 4a/4b to 4b,<br />
little or no change is seen between 3a <strong>and</strong> 4a. The highest<br />
value recorded (133%) is for glacially reworked material


