using image fusion and classification to profile a human ... - asprs
using image fusion and classification to profile a human ... - asprs
using image fusion and classification to profile a human ... - asprs

Create successful ePaper yourself
Turn your PDF publications into a flip-book with our unique Google optimized e-Paper software.
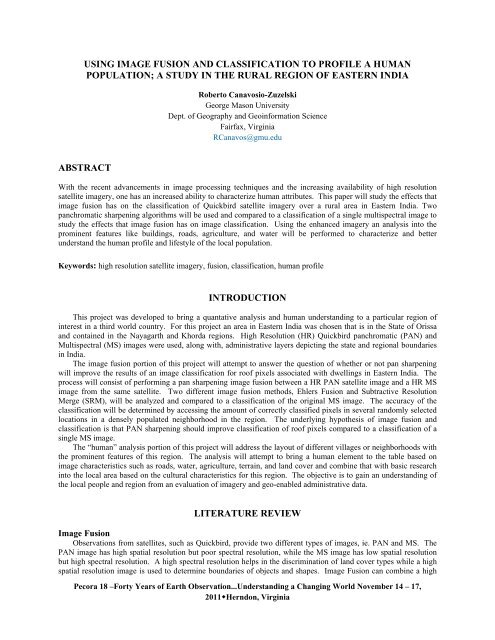
USING IMAGE FUSION AND CLASSIFICATION TO PROFILE A HUMAN<br />
POPULATION; A STUDY IN THE RURAL REGION OF EASTERN INDIA<br />
ABSTRACT<br />
Rober<strong>to</strong> Canavosio-Zuzelski<br />
George Mason University<br />
Dept. of Geography <strong>and</strong> Geoinformation Science<br />
Fairfax, Virginia<br />
RCanavos@gmu.edu<br />
With the recent advancements in <strong>image</strong> processing techniques <strong>and</strong> the increasing availability of high resolution<br />
satellite <strong>image</strong>ry, one has an increased ability <strong>to</strong> characterize <strong>human</strong> attributes. This paper will study the effects that<br />
<strong>image</strong> <strong>fusion</strong> has on the <strong>classification</strong> of Quickbird satellite <strong>image</strong>ry over a rural area in Eastern India. Two<br />
panchromatic sharpening algorithms will be used <strong>and</strong> compared <strong>to</strong> a <strong>classification</strong> of a single multispectral <strong>image</strong> <strong>to</strong><br />
study the effects that <strong>image</strong> <strong>fusion</strong> has on <strong>image</strong> <strong>classification</strong>. Using the enhanced <strong>image</strong>ry an analysis in<strong>to</strong> the<br />
prominent features like buildings, roads, agriculture, <strong>and</strong> water will be performed <strong>to</strong> characterize <strong>and</strong> better<br />
underst<strong>and</strong> the <strong>human</strong> <strong>profile</strong> <strong>and</strong> lifestyle of the local population.<br />
Keywords: high resolution satellite <strong>image</strong>ry, <strong>fusion</strong>, <strong>classification</strong>, <strong>human</strong> <strong>profile</strong><br />
INTRODUCTION<br />
This project was developed <strong>to</strong> bring a quantative analysis <strong>and</strong> <strong>human</strong> underst<strong>and</strong>ing <strong>to</strong> a particular region of<br />
interest in a third world country. For this project an area in Eastern India was chosen that is in the State of Orissa<br />
<strong>and</strong> contained in the Nayagarth <strong>and</strong> Khorda regions. High Resolution (HR) Quickbird panchromatic (PAN) <strong>and</strong><br />
Multispectral (MS) <strong>image</strong>s were used, along with, administrative layers depicting the state <strong>and</strong> regional boundaries<br />
in India.<br />
The <strong>image</strong> <strong>fusion</strong> portion of this project will attempt <strong>to</strong> answer the question of whether or not pan sharpening<br />
will improve the results of an <strong>image</strong> <strong>classification</strong> for roof pixels associated with dwellings in Eastern India. The<br />
process will consist of performing a pan sharpening <strong>image</strong> <strong>fusion</strong> between a HR PAN satellite <strong>image</strong> <strong>and</strong> a HR MS<br />
<strong>image</strong> from the same satellite. Two different <strong>image</strong> <strong>fusion</strong> methods, Ehlers Fusion <strong>and</strong> Subtractive Resolution<br />
Merge (SRM), will be analyzed <strong>and</strong> compared <strong>to</strong> a <strong>classification</strong> of the original MS <strong>image</strong>. The accuracy of the<br />
<strong>classification</strong> will be determined by accessing the amount of correctly classified pixels in several r<strong>and</strong>omly selected<br />
locations in a densely populated neighborhood in the region. The underlying hypothesis of <strong>image</strong> <strong>fusion</strong> <strong>and</strong><br />
<strong>classification</strong> is that PAN sharpening should improve <strong>classification</strong> of roof pixels compared <strong>to</strong> a <strong>classification</strong> of a<br />
single MS <strong>image</strong>.<br />
The “<strong>human</strong>” analysis portion of this project will address the layout of different villages or neighborhoods with<br />
the prominent features of this region. The analysis will attempt <strong>to</strong> bring a <strong>human</strong> element <strong>to</strong> the table based on<br />
<strong>image</strong> characteristics such as roads, water, agriculture, terrain, <strong>and</strong> l<strong>and</strong> cover <strong>and</strong> combine that with basic research<br />
in<strong>to</strong> the local area based on the cultural characteristics for this region. The objective is <strong>to</strong> gain an underst<strong>and</strong>ing of<br />
the local people <strong>and</strong> region from an evaluation of <strong>image</strong>ry <strong>and</strong> geo-enabled administrative data.<br />
LITERATURE REVIEW<br />
Image Fusion<br />
Observations from satellites, such as Quickbird, provide two different types of <strong>image</strong>s, ie. PAN <strong>and</strong> MS. The<br />
PAN <strong>image</strong> has high spatial resolution but poor spectral resolution, while the MS <strong>image</strong> has low spatial resolution<br />
but high spectral resolution. A high spectral resolution helps in the discrimination of l<strong>and</strong> cover types while a high<br />
spatial resolution <strong>image</strong> is used <strong>to</strong> determine boundaries of objects <strong>and</strong> shapes. Image Fusion can combine a high<br />
Pecora 18 –Forty Years of Earth Observation...Underst<strong>and</strong>ing a Changing World November 14 – 17,<br />
2011Herndon, Virginia
spatial resolution PAN <strong>image</strong> with a low spatial resolution MS <strong>image</strong> <strong>to</strong> create a new MS <strong>image</strong> with high spatial<br />
resolution (Li <strong>and</strong> Li, 2010). While a lot of research has been done on developing algorithms for different <strong>fusion</strong><br />
techniques not much work has been done on the effect of <strong>fusion</strong> on successive applications like <strong>image</strong> <strong>classification</strong><br />
(Li <strong>and</strong> Li, 2010). Several different types of <strong>image</strong> <strong>fusion</strong> techniques exist for combining a PAN <strong>and</strong> MS <strong>image</strong>,<br />
including Brovey Transform (BT), Modified Intensity-Hue-Saturation (M-HIS), Principal Component Analysis<br />
(PCA), High Pass Filter (HPF), Smoothing Filter-based Intensity Modulation (SFIM), Wavelet transform, Ehlers<br />
Fusion, (Li <strong>and</strong> Li, 2010) <strong>and</strong> Subtractive Resolution Merge (SRM) ( Zheng Rong-er , Jie, Yi, <strong>and</strong> Tingwei, 2008).<br />
The SRM <strong>fusion</strong> method was chosen for this project because it is based on a fairly new concept of combining<br />
<strong>image</strong> segmentation with a RGB color analysis <strong>to</strong> group pixels in<strong>to</strong> like categories. The color model is based on<br />
mixing colors of cyan, magenta, yellow, <strong>and</strong> black <strong>to</strong> form other colors. Additional colors are added <strong>to</strong> the scene<br />
based on the “brightness” of MS value for that color. The resulting fused <strong>image</strong> is more color diverse based on<br />
measurements in the MS <strong>image</strong> (Zhang, Wang, Chen, Zhang, 2005).<br />
The Ehlers Fusion method was developed <strong>to</strong> specifically address preserving spectral <strong>image</strong> characteristics when<br />
combining with a HR PAN <strong>image</strong>. The principle idea being the HR <strong>image</strong> has <strong>to</strong> sharpen the MS <strong>image</strong> without<br />
adding new gray level information <strong>to</strong> its spectral components. The Ehlers method should enhance high frequency<br />
changes such as edges <strong>and</strong> high frequency gray level changes in an <strong>image</strong> without altering the MS components in<br />
homogeneous regions (Ehlers, 2004). To do this Ehlers method combines a st<strong>and</strong>ard IHS transform with fast<br />
Fourier transform filtering of both the PAN <strong>image</strong> <strong>and</strong> the intensity component of the MS <strong>image</strong> (Li <strong>and</strong> Li, 2010).<br />
The Ehlers method was chosen for this project because it combines the best parts of several existing algorithms <strong>to</strong><br />
address the shortfalls of each of those methods.<br />
Other approaches <strong>to</strong> <strong>classification</strong> <strong>and</strong> feature extraction of remote sensing <strong>image</strong>s involve <strong>classification</strong> of HR<br />
PAN <strong>image</strong>s in urban areas <strong>using</strong> morphological <strong>and</strong> neural approaches. This work combines <strong>image</strong> segmentation<br />
with edge detection <strong>and</strong> region growing <strong>to</strong> make use of how features are oriented amongst each other instead of<br />
strictly <strong>using</strong> feature boundaries (Benediktsson, Pesaresi, <strong>and</strong> Arnason, 2003). A very recent study conducted by the<br />
University of Mississippi suggests that information extraction from HR <strong>image</strong>ry is sometimes hampered by the<br />
limited number of spectral channels available from the systems <strong>and</strong> that st<strong>and</strong>ard supervised <strong>classification</strong><br />
algorithms found in commercial software packages may misclassify different features with similar spectral<br />
characteristics; leading <strong>to</strong> a high occurrence of false positives (Momm, Gunter, <strong>and</strong> Easson, 2010). To counteract<br />
this authors use object geometry <strong>to</strong> group like pixels in subsequent <strong>image</strong>s, before <strong>and</strong> after hurricane Katrina. The<br />
draw back with this approach is that it relies on two datasets with one complementing the other, <strong>and</strong> in a general<br />
sense these datasets may not always be available for every area of interest.<br />
Settlement Morphology<br />
The concept of settlement morphology was chosen <strong>to</strong> bring a “Human” aspect <strong>to</strong> the project. The idea is <strong>to</strong> look<br />
at some basic layouts of different neighborhoods in this region <strong>and</strong> characterize the main physical attributes that go<br />
in<strong>to</strong> how the neighborhoods are laid out. For example, where the roads are in relation <strong>to</strong> where the houses are, is<br />
there a reason that the neighborhoods are located where they are, <strong>and</strong> what does the local l<strong>and</strong> cover say about how<br />
the neighborhoods were formed. To this end the following studies were reviewed related <strong>to</strong> this <strong>to</strong>pic.<br />
A current flagship study on this <strong>to</strong>pic entitled “Introduction <strong>to</strong> the Issue on Remote Sensing of Human<br />
Settlements: Status <strong>and</strong> Challenges” were the authors suggest a quantitative evaluation of the physical properties of<br />
a given area, including l<strong>and</strong> covers, material status, <strong>and</strong> l<strong>and</strong> usage (Gamba, Tupin, <strong>and</strong> Weng, 2008) was reviewed.<br />
The report displays some innovative researches going on in this field <strong>and</strong> provides an overview of the state-of-theart,<br />
along with, describing some of the challenges going forward. A key conclusion of the study was that more work<br />
on classifying HR <strong>image</strong>ry is needed due <strong>to</strong> the high spatial <strong>and</strong> spectral resolutions. Along these same lines, a<br />
paper discussing global trends in the remote sensing of <strong>human</strong> settlements (Forster, 2010) was reviewed. The study<br />
presents a brief his<strong>to</strong>ry of the <strong>to</strong>pic, examines the properties of current remote sensing systems <strong>and</strong> their acquired<br />
data, <strong>and</strong> presents some processing methods <strong>and</strong> urban applications.<br />
An integrative assessment of informal settlements <strong>using</strong> HR remote sensing data was conducted in the Delhi<br />
area of India (Niebergall, Loew, <strong>and</strong> Mauser, 2008). The study investigates the potential <strong>to</strong> use HR remote sensing<br />
data <strong>to</strong> identify urban structures <strong>and</strong> dynamic within the Delhi region. The paper presents a semi-au<strong>to</strong>mated, object<br />
oriented <strong>classification</strong> approach which allows for the identification of informal settlements within urban areas. The<br />
goal of the study is <strong>to</strong> provide indica<strong>to</strong>rs <strong>to</strong> identify socio-economic structures <strong>and</strong> their dynamics. Information on<br />
population <strong>and</strong> water related parameters are derived.<br />
A study in Central Canada used SPOT XS <strong>image</strong>ry <strong>to</strong> map exurbanite residential developments on the<br />
assumption that individual sites, under current development, possess a unique spectral signature (Brunger <strong>and</strong><br />
Treitx, 1987). The satellite <strong>image</strong>ry was cross referenced with <strong>to</strong>pographic maps <strong>and</strong> aerial pho<strong>to</strong>s <strong>and</strong> found <strong>to</strong><br />
Pecora 18 –Forty Years of Earth Observation...Underst<strong>and</strong>ing a Changing World November 14 – 17,<br />
2011Herndon, Virginia
educe <strong>classification</strong> error. Extraction of urban settlements <strong>using</strong> an au<strong>to</strong>matic approach on HR IKONOS <strong>image</strong>ry<br />
was performed (Tarantino et. al, 2003). The authors performed a maximum likelihood pixel <strong>classification</strong> on PAN<br />
sharpened <strong>image</strong>ry (1-meter resolution) <strong>to</strong> analyze changes in urban areas. Another study looked at population<br />
distribution characteristics <strong>and</strong> patterns based on remote sensing <strong>and</strong> GIS in a mountainous region in China (Shuwen<br />
et. al, 2006). A key conclusion is that population distribution is disperse <strong>and</strong> diverse in this region <strong>and</strong> that<br />
agriculture production is dominant.<br />
METHODOLOGY<br />
The <strong>image</strong> <strong>fusion</strong> portion of this project was developed <strong>to</strong> study the effects that pan sharpening <strong>image</strong> <strong>fusion</strong><br />
has on the <strong>classification</strong> of roof pixels for structures in a densely populated neighborhood in the Nayagarth Region<br />
of Eastern India. The processes consisted of cropping a local area of interest from the larger dataset, <strong>and</strong> performing<br />
a pan sharpening between a PAN <strong>image</strong> <strong>and</strong> a MS <strong>image</strong> from the Quickbird satellite. Two different <strong>fusion</strong><br />
algorithms were used, the Ehlers Fusion algorithm <strong>and</strong> the SRM algorithm. Once the pan sharpening was completed<br />
a two different <strong>classification</strong>s were performed, sub-pixel identification <strong>and</strong> a fully supervised maximum likelihood<br />
<strong>classification</strong> was performed on each <strong>image</strong>, along with a <strong>classification</strong> of the original MS <strong>image</strong>. The sub-pixel<br />
identification approach just classified the pixels that were the same in a single training category (roof), whereas, the<br />
fully supervised <strong>classification</strong> classified 10 categories of pixels based on training classes for vegetation, agriculture<br />
1-4, water, paved road, dirt road, structure (roof), <strong>and</strong> shadow. The results were compared between the 3 <strong>image</strong>s for<br />
both <strong>classification</strong> methods based on a visual interpretation of correctly classified roof pixels for 10 r<strong>and</strong>om<br />
buildings in the neighborhood. A vec<strong>to</strong>r shape file of the 10 roof outlines were created from the PAN <strong>image</strong>, once<br />
the <strong>classification</strong>s were complete the same shape file was used with the 3 classified <strong>image</strong>s <strong>to</strong> estimate a percentage<br />
of correctly identified roof pixels. The objective of the roof <strong>classification</strong> is <strong>to</strong> au<strong>to</strong>matically determine what areas<br />
in the <strong>image</strong> contain structures <strong>and</strong> <strong>to</strong> study what that layout can tell us about the people <strong>and</strong> culture in this region.<br />
The ERDAS Imagine software package was utilized <strong>to</strong> perform the <strong>image</strong> <strong>fusion</strong> <strong>and</strong> subsequent pixel<br />
<strong>classification</strong>s.<br />
The settlement morphology <strong>and</strong> cultural analysis portion of this project consisted of measuring the vegetation,<br />
roads, structures, <strong>and</strong> water areas in two different neighborhoods of a rural area in the State of Orissa, Nayagarth<br />
Region, in Eastern India. The measurements were taken <strong>using</strong> ArcGIS with the sites being labeled one <strong>and</strong> two.<br />
Once the measurements were taken, data analysis was conducted <strong>to</strong> analyze what the spatial relationship between<br />
the features can reveal about the people who live here. Features such as geography, population, agriculture,<br />
transportation networks, <strong>and</strong> industry were analyzed in the <strong>image</strong>ry <strong>to</strong> gain an underst<strong>and</strong>ing of the local region. To<br />
facilitate the analysis administrative layers were used <strong>to</strong> help underst<strong>and</strong> where the local area of interest falls in<br />
relation <strong>to</strong> the larger structure of the country in general. Once a general area was determined, based on India’s<br />
car<strong>to</strong>graphic <strong>and</strong> political layout, some basic research in<strong>to</strong> the people <strong>and</strong> region was conducted <strong>to</strong> confirm the<br />
assumptions based on the <strong>image</strong>ry <strong>and</strong> <strong>to</strong> provide more detailed <strong>profile</strong> of the local population.<br />
DESCRIPTION OF DATASETS<br />
The datasets used for this project consisted of a 65cm resolution PAN <strong>image</strong> <strong>and</strong> a 2.5 meter resolution MS<br />
<strong>image</strong> from the Quickbird satellite. Both <strong>image</strong>s were taken on December 11, 2004 <strong>and</strong> were found at the website<br />
of the Global L<strong>and</strong>site Facility at the University of Maryl<strong>and</strong>, College Park. The <strong>image</strong>s are of an 11km by 11km<br />
area of Eastern India in the State of Orissa, in the Nayagarth <strong>and</strong> Khordha regions, just north of Chilka Lake <strong>and</strong><br />
close <strong>to</strong> the shoreline of the Bay of Bengal. This area is very rural <strong>and</strong> appears <strong>to</strong> be focused around agriculture with<br />
the villages or neighborhoods being very compact <strong>and</strong> densely populated.<br />
Administrative layers (Diva-GIS, 2011) containing state <strong>and</strong> region boundaries were used <strong>and</strong> geo-referenced <strong>to</strong><br />
the <strong>image</strong>ry <strong>to</strong> provide an underst<strong>and</strong>ing of where the local project site falls in relation these higher level boundaries<br />
recognized by the country. Table 1 contains the bounding geographic coordinates for this dataset.<br />
Pecora 18 –Forty Years of Earth Observation...Underst<strong>and</strong>ing a Changing World November 14 – 17,<br />
2011Herndon, Virginia
Table 1. Geographic Coordinates for Area of Interest<br />
Corner Latitude (DD.MM.SS) Longitude (DD.MM.SS)<br />
Northwest N 20.00.32 E 85.16.32<br />
Northeast N 20.00.32 E 85.22.56<br />
Southwest N 19.54.25 E 85.16.32<br />
Southeast N 19.54.25 E 85.22.56<br />
DATA ANALYSIS<br />
Image Fusion<br />
Since the original Quickbird satellite <strong>image</strong> is large, 11km by 11km, cropping was used <strong>to</strong> isolate one of the<br />
larger neighborhoods. This neighborhood was selected because it had many ho<strong>using</strong> structures, vegetation, several<br />
different kinds of agriculture fields, <strong>and</strong> roadways. The Ehlers Fusion <strong>and</strong> SRM Fusion algorithms were used <strong>to</strong><br />
develop the “fused” <strong>image</strong>s. Figures 1-4 depict the original PAN <strong>and</strong> MS <strong>image</strong>s along with the resulting fused<br />
<strong>image</strong>s.<br />
Figure 1. Original PAN Image Figure 2. Original MS Image<br />
Figure 3. SRM Fused Image Figure 4. Ehlers Fused Image<br />
The fused <strong>image</strong>s both have increased spatial <strong>and</strong> spectral resolution as a result of the pan sharpening operation.<br />
The Ehlers Fusion has retained more of the original MS spectral characteristics where the SRM <strong>image</strong> appears<br />
somewhat washed out, most likely, the result of retaining more characteristics from the PAN <strong>image</strong>. Once the pan<br />
sharpening was performed the <strong>image</strong>s were classified <strong>using</strong> the sub-pixel classifier according <strong>to</strong> the selected training<br />
Pecora 18 –Forty Years of Earth Observation...Underst<strong>and</strong>ing a Changing World November 14 – 17,<br />
2011Herndon, Virginia
dataset. The same training dataset was used for both <strong>image</strong>s. Figures 5-7 depict the results of the sub-pixel<br />
<strong>classification</strong> for each fused <strong>image</strong>.<br />
Figure 5. Original MS Image Sub-Pix Class Figure 6. Ehlers Image Sub-Pix Class<br />
Figure 7. SRM Image Sub-Pix Class<br />
Note the large amount of false positive results of pixels being classified as roof. After the sub-pixel<br />
<strong>classification</strong> was completed <strong>and</strong> analyzed a fully supervised maximum likelihood <strong>classification</strong> was performed <strong>to</strong><br />
investigate whether or not this approach could improve the sub-pixel <strong>classification</strong> results. Figure 8 shows the<br />
training classes that were used <strong>to</strong> develop the supervised <strong>classification</strong>s with the same training classes being defined<br />
for the MS, Ehlers, <strong>and</strong> SRM <strong>image</strong>s.<br />
Figure 8. Fully Supervised Training Classes<br />
The training classes were chosen based on multiple representative samples for each category, with special<br />
attention <strong>to</strong> only include “pure” pixels in each group. The results of the fully supervised ML <strong>classification</strong> are<br />
contained in Figures 9-11. Note the differences in the roof structure <strong>classification</strong>s (red pixels) in each <strong>image</strong>. Each<br />
<strong>image</strong> contains a large amount of false positive hits, with the Ehlers <strong>image</strong> producing the least among the 3.<br />
Pecora 18 –Forty Years of Earth Observation...Underst<strong>and</strong>ing a Changing World November 14 – 17,<br />
2011Herndon, Virginia
Figure 9. Original MS Fully Supervised Class Figure 10. Ehler’s Fully Supervised ML Class<br />
Figure 11. SRM Fully Supervised ML Class<br />
Settlement Morphology<br />
Two sites were picked <strong>to</strong> analyze settlement morphology <strong>and</strong> the subsequent “<strong>human</strong>” interpretation based on<br />
the <strong>image</strong> analysis. Each of the sites is similar in size <strong>and</strong> in the same general region. Figures 12 <strong>and</strong> 13 depict the<br />
neighborhoods with the roadways measured in brown, the vegetation outline in green, the ho<strong>using</strong> structures in<br />
yellow, <strong>and</strong> the water ponds in blue. The measurements were made <strong>using</strong> the SRM fused <strong>image</strong> but overlaid on the<br />
PAN <strong>image</strong> <strong>to</strong> highlight the different colors.<br />
Figure 12. Neighborhood #1 Figure 13. Neighborhood #2<br />
Pecora 18 –Forty Years of Earth Observation...Underst<strong>and</strong>ing a Changing World November 14 – 17,<br />
2011Herndon, Virginia
RESULTS<br />
The <strong>image</strong> <strong>fusion</strong> between the Quickbird PAN <strong>image</strong> <strong>and</strong> the MS <strong>image</strong> was successful <strong>using</strong> the Ehlers <strong>and</strong> the<br />
SRM pan sharpening algorithms. The fused <strong>image</strong>s provide some definite advantages for combining high spatial<br />
<strong>and</strong> high spectral resolution <strong>image</strong>ry. One major difference between the fused <strong>image</strong>s <strong>and</strong> the original MS <strong>image</strong> is<br />
the pixel resolution, where the fused <strong>image</strong>s have a 65 cm resolution compared <strong>to</strong> the original MS <strong>image</strong> at 2.5<br />
meters. Consequently, this resulted in different pixel <strong>classification</strong>s for each <strong>image</strong> based on the roof training class.<br />
A sub-pixel classifier was used <strong>to</strong> identify all of the pixels in the <strong>image</strong> that are of the same category of roof training<br />
class. Table 2 summarizes the percentage of correct pixels, based on 10 r<strong>and</strong>omly selected roof structures spread<br />
throughout the scene, for each original MS <strong>image</strong> <strong>and</strong> each fused <strong>image</strong>. Table 3 shows the percentages of incorrectly<br />
identified pixels, based on a different 10 r<strong>and</strong>om locations spread throughout the scene. The percentages<br />
were estimated by visual quantative analysis of each area.<br />
Table 2. Percentage of Correctly Identified Pixels<br />
Location Original MS<br />
Image<br />
Ehlers Fusion SRM Fusion<br />
1 55 95 80<br />
2 60 95 80<br />
3 45 90 70<br />
4 90 95 85<br />
5 80 95 90<br />
6 60 80 50<br />
7 60 50 55<br />
8 40 95 75<br />
9 85 95 65<br />
10 20 80 10<br />
Average % Correct 60% 87% 66%<br />
Table 3. Percentage of IN-Correctly Identified Pixels<br />
Location Original<br />
MS Image<br />
Ehlers Fusion SRM Fusion<br />
1 80 90 85<br />
2 85 70 80<br />
3 5 60 5<br />
4 75 55 0<br />
5 0 0 0<br />
6 70 50 5<br />
7 5 0 0<br />
8 0 10 0<br />
9 0 5 5<br />
10 0 0 0<br />
Average % IN-Correct 32% 34% 18%<br />
Table 2 indicates the Ehlers Fusion algorithm outperformed the SRM method <strong>and</strong> the original MS <strong>image</strong> by a<br />
significant margin, based on the average percentage of correctly identified pixels. The SRM method did marginally<br />
better than the original MS <strong>image</strong>, even though the spatial resolution is much better. It is important <strong>to</strong> remember the<br />
fused <strong>image</strong>s have a pixel resolution of 65 cm, whereas, the original MS <strong>image</strong> is at 2.5 meters. So, it is conceivable<br />
Pecora 18 –Forty Years of Earth Observation...Underst<strong>and</strong>ing a Changing World November 14 – 17,<br />
2011Herndon, Virginia
that some pan sharpening algorithms might not perform as well, on a <strong>classification</strong> basis, as an <strong>image</strong> that has not<br />
been sharpened. Table 3 indicates the percentage of pixels that have been in-correctly identified, with the SRM<br />
method performing the best. Notice the original MS <strong>image</strong> <strong>and</strong> the Ehlers Fusion method resulted in about the same<br />
percentage of incorrectly identified pixels, even though the spatial resolutions are quite different. Taking in<strong>to</strong><br />
account the percentage of correct pixels minus the percentage of in-correct pixels resulted in an “adjusted<br />
performance” value summarized in Table 4.<br />
Table 4. Adjusted Performance<br />
Original MS<br />
Image<br />
Ehlers Fusion SRM Fusion<br />
“Adjusted Performance” 28% 53% 48%<br />
The adjusted performance still shows the Ehlers algorithm performing better but is much closer <strong>to</strong> the SRM<br />
method when taking correct <strong>and</strong> in-correct pixels in<strong>to</strong> account. In this case both the pan sharpened <strong>image</strong>s<br />
outperformed the original MS <strong>classification</strong> by a noticeable amount.<br />
After the sub-pixel <strong>classification</strong> was complete an attempt <strong>to</strong> improve the <strong>classification</strong> results based on a fully<br />
supervised maximum likelihood (ML) <strong>classification</strong> was investigated, as depicted in Figures 9-12. The training<br />
classes were designed according <strong>to</strong> Figure 8 <strong>and</strong> were the same for all of the <strong>image</strong>s. The thought here was that<br />
most of the false positive hits came on agriculture field areas <strong>and</strong> if several more classes were specified in these<br />
areas that maybe the roof <strong>classification</strong> could be improved. The roof pixels are shown in red <strong>and</strong> even after the ML<br />
<strong>classification</strong> there were a significant number of false positive hits. Note the southeast corner of Figures 9 <strong>and</strong> 11<br />
where the agriculture field is classified as roof, whereas, the Ehlers method shows the majority of these same fields<br />
being correctly identified as agriculture pixels.<br />
Image & Cultural Analysis<br />
To analyze settlement morphology in each <strong>image</strong> some major attributes, including roadways, vegetation,<br />
agriculture, ho<strong>using</strong>, <strong>and</strong> water areas, were located <strong>and</strong> measured in the pan sharpened <strong>image</strong>ry. This fused <strong>image</strong><br />
(SRM method) provided an advantage over the original MS <strong>image</strong> because of the increased spatial detail while<br />
maintaining the spectral information in the MS <strong>image</strong>. The following analysis was developed based on two<br />
categories of information, <strong>image</strong> analysis <strong>and</strong> basic research of the region in general. The latter being the result of<br />
the administrative layers obtained that facilitated the underst<strong>and</strong>ing of where <strong>and</strong> how this area of interest is referred<br />
<strong>to</strong> by the people of India.<br />
Geography. The settlements used for this project are located in the Nayagarh district, State of Orissa, in<br />
Eastern India. They are located <strong>to</strong>wards the west of Puri district surrounded by Cuttack district in the North,<br />
Phulbani district in the West, Ganjam district in the South <strong>and</strong> Khurda district in the East. The District of Nayagarh<br />
lies between 19 degrees 54 minutes <strong>to</strong> 20 degrees 32 minutes North latitude <strong>and</strong> 84 degrees 29minutes <strong>to</strong> 85 degrees<br />
27 minutes East longitude. This district is situated in the hilly ranges in the West <strong>and</strong> its northeastern parts have<br />
formed small well cultivated fertile valleys intersected by small streams. This district is at a higher altitude than sea<br />
level so the potential for flood events is decreased compared <strong>to</strong> some of the surrounding Districts. The Mahanadi<br />
River flows along the Eastern boundary with the Khurda district (District of Nayagarh, 2010).<br />
Agriculture/L<strong>and</strong>use. The majority of the surrounding l<strong>and</strong> cover is being used for agriculture purposes, which<br />
includes extensive <strong>and</strong> intricate farming practices. From the <strong>image</strong>ry, once can conclude that the different spectral<br />
colors correspond <strong>to</strong> different types of crops, soil, <strong>and</strong> moisture content. It is also important <strong>to</strong> note that the majority<br />
of the scene (area) is devoted <strong>to</strong> agriculture purposes, with the usable l<strong>and</strong> being maximized for farming. Several<br />
areas show the planned removal of vegetation <strong>to</strong> maximize crop area, as evidenced by geometric clearing lines. This<br />
indicates that farming is very important <strong>to</strong> these residents <strong>and</strong> contributes <strong>to</strong> a large part of the economy in this<br />
region. Another indica<strong>to</strong>r of the importance of agriculture in this region is the intricate design of irrigation ditches<br />
around each crop. Over 76% of the people in the State of Orissa are dependent on agriculture for their livelihood.<br />
The cropped area of the state is approximately 8,750,000 square hectares with the majority being irrigated <strong>to</strong> grow<br />
rice, pulses, oil-seeds, jute, mesta, sugarcane, coconut <strong>and</strong> turmeric. Overall, the State of Orissa contributes onetenth<br />
<strong>to</strong> the <strong>to</strong>tal rice production of India (State of Orissa/Rural Development, 2010).<br />
Roadways. The majority of roadways in this region are non pavement dirt roadways that snake through the<br />
settlements, fields, <strong>and</strong> crops. It appears the roadways take the path of least resistance which would be typical of a<br />
system that has originated over time <strong>and</strong> not built <strong>and</strong> engineered at one time with formal construction services. The<br />
small numbers of roads in this region indicate there are not a lot of places <strong>to</strong> go other than the settlements <strong>and</strong> out <strong>to</strong><br />
Pecora 18 –Forty Years of Earth Observation...Underst<strong>and</strong>ing a Changing World November 14 – 17,<br />
2011Herndon, Virginia
the main highways. One can infer that the roads play an important role for the livelihood of the people because of<br />
the amount of agriculture <strong>and</strong> the need <strong>to</strong> get farming supplies/equipment in <strong>and</strong> crop yield out <strong>to</strong> sell.<br />
Vegetation. The vegetation in this region consists of trees <strong>and</strong> ground cover bush that are growing around wet<br />
areas, higher altitude mountainous or hilly areas, <strong>and</strong> the settlements. The mountainous areas are fully vegetated<br />
while the lower flat areas are mostly open <strong>and</strong> being used for agriculture purposes, indicating again how important<br />
the agricultural industry is for these people. The creeks <strong>and</strong> rivers that feed the irrigation ditches are vegetated <strong>and</strong><br />
help visualize the path of the river across the region. Another interesting phenomenon of the vegetation in this<br />
region is that it grows around the settlements, or, the settlements were built <strong>to</strong> coincide with the vegetated areas.<br />
This is most likely because vegetation provides a natural shelter from strong wind, s<strong>and</strong> s<strong>to</strong>rms, rain, <strong>and</strong> offers<br />
shade from the sun.<br />
Water wells. Most of the neighborhoods contain water wells that are close <strong>to</strong> the settlement structures. The<br />
average size is approximately 60 meters in diameter <strong>and</strong> there is usually one for each neighborhood area. The<br />
roadways <strong>to</strong> <strong>and</strong> from these wells appear <strong>to</strong> be in constant use, as evidenced by the fresh dirt on the road surface.<br />
The presence of wells most likely indicates the lack of a sophisticated plumbing infrastructure, as is the case in more<br />
rural <strong>and</strong> un-developed areas.<br />
Settlements. The settlements structures in this region are long <strong>and</strong> wide, averaging approximately 5 meters<br />
wide by 15 meters long, <strong>and</strong> built very close <strong>to</strong>gether. These settlements contains a long structure parallel with the<br />
road <strong>and</strong> many long skinny structures built behind it that are perpendicular <strong>to</strong> the road, most likely, the front is a<br />
common area <strong>and</strong> the back are more private family areas. The settlement is laid out either side <strong>and</strong> very close <strong>to</strong> the<br />
roadway, indicating the road is of high importance <strong>and</strong> a main focus in servicing this settlement. Most likely, the<br />
road provides a means for survival <strong>to</strong> this village, servicing the agriculture needs, export/selling agricultural yields,<br />
providing access <strong>to</strong> medicine <strong>and</strong> medical care, <strong>and</strong> allowing people <strong>to</strong> procure other modern conveniences. The<br />
footprint of the settlement on the ground looks <strong>to</strong> be minimized <strong>to</strong> service the agriculture industry, which is<br />
indicated by the agriculture fields being built right up <strong>to</strong> <strong>and</strong> around the settlement. Also, the residents of the village<br />
are probably the ones that farm the fields since there is no separation between the village <strong>and</strong> the fields. The<br />
settlement is fairly isolated with the closest neighbor being a small village about 1 km east <strong>and</strong> the closest small city,<br />
Ch<strong>and</strong>pur, being approximately 9 km southeast.<br />
Population. According <strong>to</strong> the 2001 country census, India’s Nayagarh district has a <strong>to</strong>tal population of 132,644<br />
people with 69,115 being men <strong>and</strong> 63,529 women. In addition <strong>to</strong> the general population the State of Orissa<br />
recognizes two other <strong>classification</strong>s of people, scheduled casts <strong>and</strong> scheduled tribes. Scheduled casts make up<br />
14,960 people <strong>to</strong>tal with 7598 men <strong>and</strong> 7362 women. The scheduled tribes make up a much smaller population with<br />
621 <strong>to</strong>tal people with 325 men <strong>and</strong> 296 women. The working population was also captured in the census <strong>and</strong><br />
consists of 40,230 <strong>to</strong>tal workers with 36,993 men <strong>and</strong> 3,237 women. The non-working population is 92,414 <strong>to</strong>tal<br />
people with 32,122 men <strong>and</strong> 60,292 women, (India Census, 2001).<br />
Food. Cooked rice with dal <strong>and</strong> curry are the main meal for most of the people in the State of Orissa. Even the<br />
tribal people in the hilly regions who take millet <strong>and</strong> ragi as their staple food prefer a rice meal. In the more urban<br />
areas of the state some people have switched over <strong>to</strong> wheat in place of rice <strong>and</strong> use roti <strong>and</strong> chapati for cooking<br />
dinner. Rice as the main course can be prepared in a number of ways; the most common is with kanika which is<br />
cooked with ghee, sugar, <strong>and</strong> khechudi (State of Orissa/Food, Supplies, <strong>and</strong> Consumer Welfare, 2010).<br />
Language. Oriya is the mother <strong>to</strong>ngue of the people of Orissa <strong>and</strong> most of them underst<strong>and</strong> Hindi as well.<br />
People can sometimes speak Bengali, Telugu, Urdu <strong>and</strong> a bit of Gujarati in addition <strong>to</strong> the various tribal dialects.<br />
English can only be unders<strong>to</strong>od by the educated masses (State of Orissa/Government Portal, 2010).<br />
Religion. Of all of the states of India, Orissa has perhaps the highest concentration of Hindus. In 1971 the<br />
Hindus formed 92 per cent of the <strong>to</strong>tal population; the Muslims, Christians <strong>and</strong> Buddhists formed 1.5, 1.7 <strong>and</strong>. 04<br />
per cent respectively. The balance is primarily tribal religions of Sarana <strong>and</strong> Santals. Orissa is a l<strong>and</strong> of religious<br />
<strong>to</strong>lerance <strong>and</strong> the people belonging <strong>to</strong> different religions <strong>and</strong> faiths live harmoniously, often within the same village<br />
(State of Orissa/Government Portal, 2010).<br />
Industry. Industry also plays a key role in the economy. Products manufactured in Orissa include textiles,<br />
paper, leather goods, cement, soap, glass, aluminum, <strong>and</strong> flour. Some of the natural resources that are mined are<br />
iron, coal, <strong>and</strong> zinc. Orissa has trade relations with other states in India, the United States, Japan, Britain, <strong>and</strong><br />
Germany. There are many products that are shipped in <strong>and</strong> out of Orissa annually with the main exports being<br />
expensive gems, fish, fancy jewelry, baskets, <strong>and</strong> clothing. Orissa is known worldwide for its fine cloths <strong>and</strong> the<br />
painstaking effort with which they are made (State of Orissa/Industries, 2010).<br />
Pecora 18 –Forty Years of Earth Observation...Underst<strong>and</strong>ing a Changing World November 14 – 17,<br />
2011Herndon, Virginia
CONCLUSIONS<br />
The <strong>image</strong> <strong>fusion</strong> part of the project investigated the hypothesis of whether or not pan sharpening <strong>image</strong> <strong>fusion</strong><br />
of Quickbird satellite <strong>image</strong>ry would improve a subsequent pixel <strong>classification</strong> of roof structures. The results<br />
confirmed the hypothesis but also brought <strong>to</strong> light several challenges that were associated with this process. First,<br />
the <strong>image</strong> size <strong>and</strong> computer processing power directly impacts whether or not some of the <strong>fusion</strong> algorithms can be<br />
used on a practical basis. For example, the <strong>image</strong>s used in this project had <strong>to</strong> be cropped down from the original<br />
size because the Ehlers Fusion would take many hours <strong>to</strong> complete. Once smaller <strong>image</strong>s were developed the<br />
algorithms ran smoothly taking about 20 minutes <strong>to</strong> finish. The fused <strong>image</strong>s did provide an increased spatial <strong>and</strong><br />
spectral resolution (65 cm) compared <strong>to</strong> the original MS <strong>image</strong> (2.5 meters) alone.<br />
The fused <strong>image</strong>s did outperform the original MS <strong>image</strong> but not as well as you would be led <strong>to</strong> believe based on<br />
just the correctly identified roof pixels. For example, the Ehlers algorithm showed an 87% success rate of correctly<br />
identified roof pixels, but, when you fac<strong>to</strong>r in the false positives the adjusted performance value decreased<br />
significantly <strong>to</strong> 53% for Ehlers <strong>and</strong> 48% for the SRM. However, both fused algorithms performed better than the<br />
original MS <strong>image</strong> <strong>and</strong> provide the user with an enhanced analysis capability due <strong>to</strong> incorporating the high spatial<br />
detail of the PAN <strong>image</strong> along with the high spectral resolution of the MS <strong>image</strong>.<br />
Using fused classified <strong>image</strong>ry <strong>to</strong> conduct analysis <strong>and</strong> measurements of the prominent spatial features<br />
confirmed the hypothesis of whether or not underst<strong>and</strong>ing features like roadways, structures, vegetation, <strong>and</strong><br />
agricultural/l<strong>and</strong> cover uses could be used <strong>to</strong> gain information about the local people <strong>and</strong> the region. A subsequent<br />
analysis of geography, language, religion, food, <strong>and</strong> industry was conducted <strong>and</strong> supplied a significant amount of<br />
information about the local people <strong>and</strong> culture. Geo-enabled administrative layers such as state <strong>and</strong> regional<br />
boundaries helped facilitate this research <strong>and</strong> provided local knowledge of how the government refers <strong>to</strong> this part of<br />
the country. Together, the <strong>image</strong>ry analysis <strong>and</strong> the cultural research proved <strong>to</strong> supplement each other <strong>and</strong> helped <strong>to</strong><br />
confirm the respective conclusions.<br />
REFERENCES<br />
Benediktsson, J.A., Pesaresi, M., Arnason, K., 2003. Classification <strong>and</strong> Feature Extrac<strong>to</strong>n for Remote Sensing<br />
Images Frim Urban Areas Basede on Morphological Transformations. IEEE Transactions on Geoscience<br />
<strong>and</strong> Remote Sensing. 41(9). 1940-1949.<br />
Brunger, A., <strong>and</strong> Treitx, P., 1987. Exurbanite Residential Settlement Patterns in Central Canada: SPOT Imagery<br />
Observations in Douro Township, Ontario, 1987. IEEE IGARSS. 1659-1662.<br />
Census of India 2001: Table A10 - State Primary Census Abstract for Individual Scheduled Caste <strong>and</strong> State Primary<br />
Census Abstract for Individual Scheduled Tribe. Office of the Registrar, India. Retreived from:<br />
http://censusindia.gov.in/Tables_Published/SCST/scst_main.html<br />
Diva-GIS., February 2011. [India Administrative GIS Layers Dataset]. Retrieved from: http://www.divagis.org/gData<br />
.<br />
ESRI ArcMap. (Copyright: 1999-2009). ArcGIS Desk<strong>to</strong>p Evaluation. v. 9.3.1. http://www.esri.com.<br />
ERDAS Imagine 2011. (Copyright: 1991-2009). v. 11.0. Build 304. http://www.erdas.com.<br />
Ehlers, M., 2007. Segment Based Image Analysis <strong>and</strong> Image Fusion. ASPRS Annual Conference, Tampa, FL. May<br />
7-11.<br />
Forster, B.,2010. Global Trends in Remote Sensing of Human Settlements. IEEE IGARSS. doi: 978-1-4244-9566-<br />
5/10.<br />
Gamba, P., Tupin, F., Weng, Q., 2008. Introduction <strong>to</strong> the Issue on Remote Sensing of Human Settlements: Status<br />
<strong>and</strong> Challenges. IEEE Journal of Selected Topics in Applied Earth Observations <strong>and</strong> Remote Sensing. 1(2).<br />
82-86.<br />
Global L<strong>and</strong> Cover Facility, February 2011. [Quickbird Imagery Dataset]. Chilka Lake, India. Retreived from:<br />
http://www.l<strong>and</strong>cover.org/data/quickbird/index.shtml.<br />
Li, S., Li, Z., 2010. Effects of Image Fusion Algorithms on Classification Accuracy. IEEE Geoinformatics, 2010,<br />
18 International Conference. doi: 10.1109/Geoinformatics.2010.5567785.<br />
Nayagarh, District Website, March 2010. Retrieved from: http://nayagarh.nic.in<br />
Momm, H.G., Gunter, B., Easson, G., 2010. Improved Feature Extraction from High-Resolution Remotely Sensed<br />
Imagery <strong>using</strong> Object Geometry. Proceedings of SPIE. doi: 10.1117/12.850196.<br />
Pecora 18 –Forty Years of Earth Observation...Underst<strong>and</strong>ing a Changing World November 14 – 17,<br />
2011Herndon, Virginia
Niebergall, S., Loew, A., Mauser, M., 2008. Integrative Assessment of Informal Settlements Using VHR Remote<br />
Sensing Data- The Delhi Case Study. IEEE Journal of Selected Topics in Applied Earth Observations <strong>and</strong><br />
Remote Sensing. 1(3). 193-205.<br />
Rong-er, Z., Jie, Z., Yi, M., Tingwei, C., 2008. A New Classification Method of High Spatial Resolution Remote<br />
Sensing Image. IEEE Computer Society, International Conference on Computer Science <strong>and</strong> Software<br />
Engineering. doi: 10.1109/CSSE.2008.985. 1073-1076.<br />
Shuwen, N., Guozhu, L., Zhenguang, L., Liang, L., Caihong, M., 2006. Study on Population Distribution<br />
Characteristics <strong>and</strong> Pattern Based on RS <strong>and</strong> GIS in Mountainous Region, A case study of Tianshui district,<br />
China. IEEE. doi: 0.7803.9610.7/06.<br />
State of Orissa, India, Websites, Accessed March 2010. Retrieved from:<br />
Government Portal: www.orissa.gov.in/Portal<br />
Dept. of Ho<strong>using</strong> <strong>and</strong> Rural Development: www.orissa.gov.in/RD<br />
Dept. of Food, Supplies, <strong>and</strong> Consumer Welfare: www.orissa.gov.in/foodsupplies/index.htm<br />
Dept. of Industries: www.orissa.gov.in/industries<br />
Tarantino, C., D’Addabbo, A., Castellana, L., Pasquariello, G., Blonda, P., Satalino, G., 2003. Extraction of Urban<br />
Settlements by an Au<strong>to</strong>matic Approach on High Resolution Remote Sensed Data. IEEE. doi:<br />
0.7803.7929.2/03.<br />
Zhang, S., Wang, P., Chen, X., Zhang, X., 2005. A new method for Multi-source Remote Sensing Image Fusion.<br />
IEEE. doi: 0.7803.9050.4/05.<br />
Pecora 18 –Forty Years of Earth Observation...Underst<strong>and</strong>ing a Changing World November 14 – 17,<br />
2011Herndon, Virginia