using image fusion and classification to profile a human ... - asprs
using image fusion and classification to profile a human ... - asprs
using image fusion and classification to profile a human ... - asprs

You also want an ePaper? Increase the reach of your titles
YUMPU automatically turns print PDFs into web optimized ePapers that Google loves.
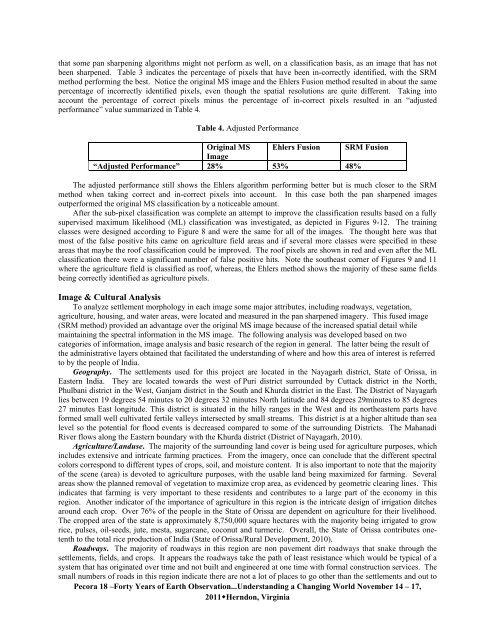
that some pan sharpening algorithms might not perform as well, on a <strong>classification</strong> basis, as an <strong>image</strong> that has not<br />
been sharpened. Table 3 indicates the percentage of pixels that have been in-correctly identified, with the SRM<br />
method performing the best. Notice the original MS <strong>image</strong> <strong>and</strong> the Ehlers Fusion method resulted in about the same<br />
percentage of incorrectly identified pixels, even though the spatial resolutions are quite different. Taking in<strong>to</strong><br />
account the percentage of correct pixels minus the percentage of in-correct pixels resulted in an “adjusted<br />
performance” value summarized in Table 4.<br />
Table 4. Adjusted Performance<br />
Original MS<br />
Image<br />
Ehlers Fusion SRM Fusion<br />
“Adjusted Performance” 28% 53% 48%<br />
The adjusted performance still shows the Ehlers algorithm performing better but is much closer <strong>to</strong> the SRM<br />
method when taking correct <strong>and</strong> in-correct pixels in<strong>to</strong> account. In this case both the pan sharpened <strong>image</strong>s<br />
outperformed the original MS <strong>classification</strong> by a noticeable amount.<br />
After the sub-pixel <strong>classification</strong> was complete an attempt <strong>to</strong> improve the <strong>classification</strong> results based on a fully<br />
supervised maximum likelihood (ML) <strong>classification</strong> was investigated, as depicted in Figures 9-12. The training<br />
classes were designed according <strong>to</strong> Figure 8 <strong>and</strong> were the same for all of the <strong>image</strong>s. The thought here was that<br />
most of the false positive hits came on agriculture field areas <strong>and</strong> if several more classes were specified in these<br />
areas that maybe the roof <strong>classification</strong> could be improved. The roof pixels are shown in red <strong>and</strong> even after the ML<br />
<strong>classification</strong> there were a significant number of false positive hits. Note the southeast corner of Figures 9 <strong>and</strong> 11<br />
where the agriculture field is classified as roof, whereas, the Ehlers method shows the majority of these same fields<br />
being correctly identified as agriculture pixels.<br />
Image & Cultural Analysis<br />
To analyze settlement morphology in each <strong>image</strong> some major attributes, including roadways, vegetation,<br />
agriculture, ho<strong>using</strong>, <strong>and</strong> water areas, were located <strong>and</strong> measured in the pan sharpened <strong>image</strong>ry. This fused <strong>image</strong><br />
(SRM method) provided an advantage over the original MS <strong>image</strong> because of the increased spatial detail while<br />
maintaining the spectral information in the MS <strong>image</strong>. The following analysis was developed based on two<br />
categories of information, <strong>image</strong> analysis <strong>and</strong> basic research of the region in general. The latter being the result of<br />
the administrative layers obtained that facilitated the underst<strong>and</strong>ing of where <strong>and</strong> how this area of interest is referred<br />
<strong>to</strong> by the people of India.<br />
Geography. The settlements used for this project are located in the Nayagarh district, State of Orissa, in<br />
Eastern India. They are located <strong>to</strong>wards the west of Puri district surrounded by Cuttack district in the North,<br />
Phulbani district in the West, Ganjam district in the South <strong>and</strong> Khurda district in the East. The District of Nayagarh<br />
lies between 19 degrees 54 minutes <strong>to</strong> 20 degrees 32 minutes North latitude <strong>and</strong> 84 degrees 29minutes <strong>to</strong> 85 degrees<br />
27 minutes East longitude. This district is situated in the hilly ranges in the West <strong>and</strong> its northeastern parts have<br />
formed small well cultivated fertile valleys intersected by small streams. This district is at a higher altitude than sea<br />
level so the potential for flood events is decreased compared <strong>to</strong> some of the surrounding Districts. The Mahanadi<br />
River flows along the Eastern boundary with the Khurda district (District of Nayagarh, 2010).<br />
Agriculture/L<strong>and</strong>use. The majority of the surrounding l<strong>and</strong> cover is being used for agriculture purposes, which<br />
includes extensive <strong>and</strong> intricate farming practices. From the <strong>image</strong>ry, once can conclude that the different spectral<br />
colors correspond <strong>to</strong> different types of crops, soil, <strong>and</strong> moisture content. It is also important <strong>to</strong> note that the majority<br />
of the scene (area) is devoted <strong>to</strong> agriculture purposes, with the usable l<strong>and</strong> being maximized for farming. Several<br />
areas show the planned removal of vegetation <strong>to</strong> maximize crop area, as evidenced by geometric clearing lines. This<br />
indicates that farming is very important <strong>to</strong> these residents <strong>and</strong> contributes <strong>to</strong> a large part of the economy in this<br />
region. Another indica<strong>to</strong>r of the importance of agriculture in this region is the intricate design of irrigation ditches<br />
around each crop. Over 76% of the people in the State of Orissa are dependent on agriculture for their livelihood.<br />
The cropped area of the state is approximately 8,750,000 square hectares with the majority being irrigated <strong>to</strong> grow<br />
rice, pulses, oil-seeds, jute, mesta, sugarcane, coconut <strong>and</strong> turmeric. Overall, the State of Orissa contributes onetenth<br />
<strong>to</strong> the <strong>to</strong>tal rice production of India (State of Orissa/Rural Development, 2010).<br />
Roadways. The majority of roadways in this region are non pavement dirt roadways that snake through the<br />
settlements, fields, <strong>and</strong> crops. It appears the roadways take the path of least resistance which would be typical of a<br />
system that has originated over time <strong>and</strong> not built <strong>and</strong> engineered at one time with formal construction services. The<br />
small numbers of roads in this region indicate there are not a lot of places <strong>to</strong> go other than the settlements <strong>and</strong> out <strong>to</strong><br />
Pecora 18 –Forty Years of Earth Observation...Underst<strong>and</strong>ing a Changing World November 14 – 17,<br />
2011Herndon, Virginia