using image fusion and classification to profile a human ... - asprs
using image fusion and classification to profile a human ... - asprs
using image fusion and classification to profile a human ... - asprs

Create successful ePaper yourself
Turn your PDF publications into a flip-book with our unique Google optimized e-Paper software.
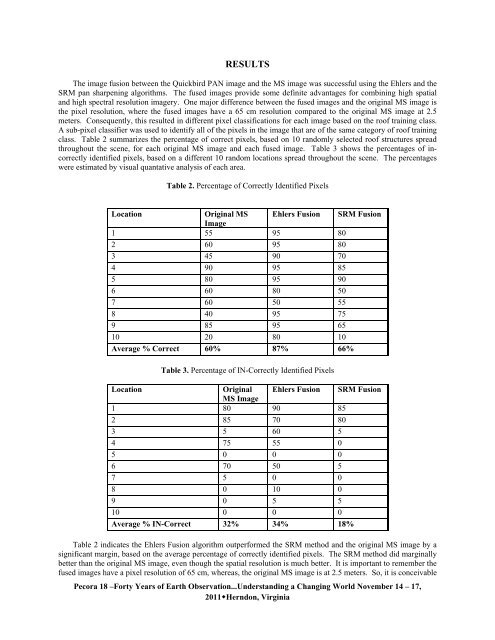
RESULTS<br />
The <strong>image</strong> <strong>fusion</strong> between the Quickbird PAN <strong>image</strong> <strong>and</strong> the MS <strong>image</strong> was successful <strong>using</strong> the Ehlers <strong>and</strong> the<br />
SRM pan sharpening algorithms. The fused <strong>image</strong>s provide some definite advantages for combining high spatial<br />
<strong>and</strong> high spectral resolution <strong>image</strong>ry. One major difference between the fused <strong>image</strong>s <strong>and</strong> the original MS <strong>image</strong> is<br />
the pixel resolution, where the fused <strong>image</strong>s have a 65 cm resolution compared <strong>to</strong> the original MS <strong>image</strong> at 2.5<br />
meters. Consequently, this resulted in different pixel <strong>classification</strong>s for each <strong>image</strong> based on the roof training class.<br />
A sub-pixel classifier was used <strong>to</strong> identify all of the pixels in the <strong>image</strong> that are of the same category of roof training<br />
class. Table 2 summarizes the percentage of correct pixels, based on 10 r<strong>and</strong>omly selected roof structures spread<br />
throughout the scene, for each original MS <strong>image</strong> <strong>and</strong> each fused <strong>image</strong>. Table 3 shows the percentages of incorrectly<br />
identified pixels, based on a different 10 r<strong>and</strong>om locations spread throughout the scene. The percentages<br />
were estimated by visual quantative analysis of each area.<br />
Table 2. Percentage of Correctly Identified Pixels<br />
Location Original MS<br />
Image<br />
Ehlers Fusion SRM Fusion<br />
1 55 95 80<br />
2 60 95 80<br />
3 45 90 70<br />
4 90 95 85<br />
5 80 95 90<br />
6 60 80 50<br />
7 60 50 55<br />
8 40 95 75<br />
9 85 95 65<br />
10 20 80 10<br />
Average % Correct 60% 87% 66%<br />
Table 3. Percentage of IN-Correctly Identified Pixels<br />
Location Original<br />
MS Image<br />
Ehlers Fusion SRM Fusion<br />
1 80 90 85<br />
2 85 70 80<br />
3 5 60 5<br />
4 75 55 0<br />
5 0 0 0<br />
6 70 50 5<br />
7 5 0 0<br />
8 0 10 0<br />
9 0 5 5<br />
10 0 0 0<br />
Average % IN-Correct 32% 34% 18%<br />
Table 2 indicates the Ehlers Fusion algorithm outperformed the SRM method <strong>and</strong> the original MS <strong>image</strong> by a<br />
significant margin, based on the average percentage of correctly identified pixels. The SRM method did marginally<br />
better than the original MS <strong>image</strong>, even though the spatial resolution is much better. It is important <strong>to</strong> remember the<br />
fused <strong>image</strong>s have a pixel resolution of 65 cm, whereas, the original MS <strong>image</strong> is at 2.5 meters. So, it is conceivable<br />
Pecora 18 –Forty Years of Earth Observation...Underst<strong>and</strong>ing a Changing World November 14 – 17,<br />
2011Herndon, Virginia