a manova-based and object-oriented statistical method for - asprs
a manova-based and object-oriented statistical method for - asprs
a manova-based and object-oriented statistical method for - asprs

Create successful ePaper yourself
Turn your PDF publications into a flip-book with our unique Google optimized e-Paper software.
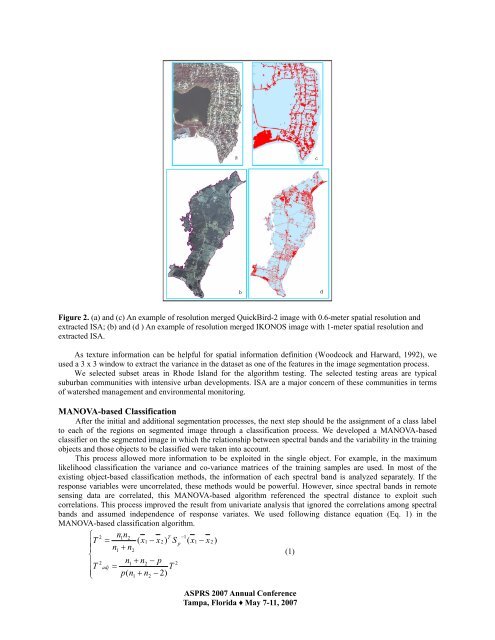
Figure 2. (a) <strong>and</strong> (c) An example of resolution merged QuickBird-2 image with 0.6-meter spatial resolution <strong>and</strong><br />
extracted ISA; (b) <strong>and</strong> (d ) An example of resolution merged IKONOS image with 1-meter spatial resolution <strong>and</strong><br />
extracted ISA.<br />
As texture in<strong>for</strong>mation can be helpful <strong>for</strong> spatial in<strong>for</strong>mation definition (Woodcock <strong>and</strong> Harward, 1992), we<br />
used a 3 x 3 window to extract the variance in the dataset as one of the features in the image segmentation process.<br />
We selected subset areas in Rhode Isl<strong>and</strong> <strong>for</strong> the algorithm testing. The selected testing areas are typical<br />
suburban communities with intensive urban developments. ISA are a major concern of these communities in terms<br />
of watershed management <strong>and</strong> environmental monitoring.<br />
MANOVA-<strong>based</strong> Classification<br />
After the initial <strong>and</strong> additional segmentation processes, the next step should be the assignment of a class label<br />
to each of the regions on segmented image through a classification process. We developed a MANOVA-<strong>based</strong><br />
classifier on the segmented image in which the relationship between spectral b<strong>and</strong>s <strong>and</strong> the variability in the training<br />
<strong>object</strong>s <strong>and</strong> those <strong>object</strong>s to be classified were taken into account.<br />
This process allowed more in<strong>for</strong>mation to be exploited in the single <strong>object</strong>. For example, in the maximum<br />
likelihood classification the variance <strong>and</strong> co-variance matrices of the training samples are used. In most of the<br />
existing <strong>object</strong>-<strong>based</strong> classification <strong>method</strong>s, the in<strong>for</strong>mation of each spectral b<strong>and</strong> is analyzed separately. If the<br />
response variables were uncorrelated, these <strong>method</strong>s would be powerful. However, since spectral b<strong>and</strong>s in remote<br />
sensing data are correlated, this MANOVA-<strong>based</strong> algorithm referenced the spectral distance to exploit such<br />
correlations. This process improved the result from univariate analysis that ignored the correlations among spectral<br />
b<strong>and</strong>s <strong>and</strong> assumed independence of response variates. We used following distance equation (Eq. 1) in the<br />
MANOVA-<strong>based</strong> classification algorithm.<br />
⎧ 2 n1n2<br />
T −1<br />
⎪<br />
T = ( x1<br />
− x2<br />
) S p ( x1<br />
− x 2)<br />
⎪ n1<br />
+ n2<br />
⎨<br />
(1)<br />
⎪ 2 n1<br />
+ n2<br />
− p 2<br />
T adj =<br />
T<br />
⎪⎩<br />
p(<br />
n1<br />
+ n2<br />
− 2)<br />
ASPRS 2007 Annual Conference<br />
Tampa, Florida ♦ May 7-11, 2007