a manova-based and object-oriented statistical method for - asprs
a manova-based and object-oriented statistical method for - asprs
a manova-based and object-oriented statistical method for - asprs

Create successful ePaper yourself
Turn your PDF publications into a flip-book with our unique Google optimized e-Paper software.
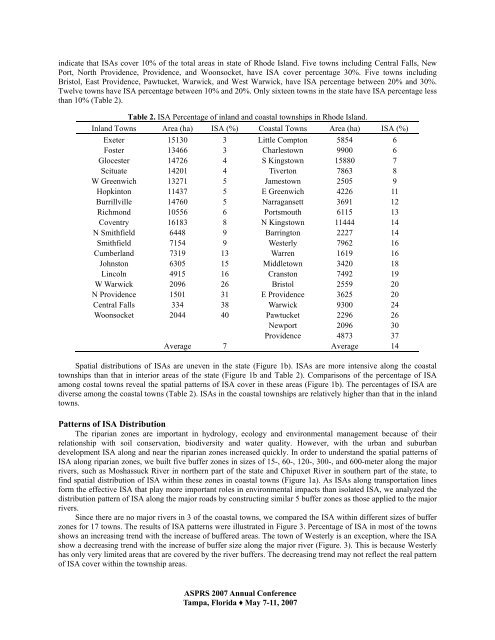
indicate that ISAs cover 10% of the total areas in state of Rhode Isl<strong>and</strong>. Five towns including Central Falls, New<br />
Port, North Providence, Providence, <strong>and</strong> Woonsocket, have ISA cover percentage 30%. Five towns including<br />
Bristol, East Providence, Pawtucket, Warwick, <strong>and</strong> West Warwick, have ISA percentage between 20% <strong>and</strong> 30%.<br />
Twelve towns have ISA percentage between 10% <strong>and</strong> 20%. Only sixteen towns in the state have ISA percentage less<br />
than 10% (Table 2).<br />
Table 2. ISA Percentage of inl<strong>and</strong> <strong>and</strong> coastal townships in Rhode Isl<strong>and</strong>.<br />
Inl<strong>and</strong> Towns Area (ha) ISA (%) Coastal Towns Area (ha) ISA (%)<br />
Exeter 15130 3 Little Compton 5854 6<br />
Foster 13466 3 Charlestown 9900 6<br />
Glocester 14726 4 S Kingstown 15880 7<br />
Scituate 14201 4 Tiverton 7863 8<br />
W Greenwich 13271 5 Jamestown 2505 9<br />
Hopkinton 11437 5 E Greenwich 4226 11<br />
Burrillville 14760 5 Narragansett 3691 12<br />
Richmond 10556 6 Portsmouth 6115 13<br />
Coventry 16183 8 N Kingstown 11444 14<br />
N Smithfield 6448 9 Barrington 2227 14<br />
Smithfield 7154 9 Westerly 7962 16<br />
Cumberl<strong>and</strong> 7319 13 Warren 1619 16<br />
Johnston 6305 15 Middletown 3420 18<br />
Lincoln 4915 16 Cranston 7492 19<br />
W Warwick 2096 26 Bristol 2559 20<br />
N Providence 1501 31 E Providence 3625 20<br />
Central Falls 334 38 Warwick 9300 24<br />
Woonsocket 2044 40 Pawtucket 2296 26<br />
Newport 2096 30<br />
Providence 4873 37<br />
Average 7 Average 14<br />
Spatial distributions of ISAs are uneven in the state (Figure 1b). ISAs are more intensive along the coastal<br />
townships than that in interior areas of the state (Figure 1b <strong>and</strong> Table 2). Comparisons of the percentage of ISA<br />
among costal towns reveal the spatial patterns of ISA cover in these areas (Figure 1b). The percentages of ISA are<br />
diverse among the coastal towns (Table 2). ISAs in the coastal townships are relatively higher than that in the inl<strong>and</strong><br />
towns.<br />
Patterns of ISA Distribution<br />
The riparian zones are important in hydrology, ecology <strong>and</strong> environmental management because of their<br />
relationship with soil conservation, biodiversity <strong>and</strong> water quality. However, with the urban <strong>and</strong> suburban<br />
development ISA along <strong>and</strong> near the riparian zones increased quickly. In order to underst<strong>and</strong> the spatial patterns of<br />
ISA along riparian zones, we built five buffer zones in sizes of 15-, 60-, 120-, 300-, <strong>and</strong> 600-meter along the major<br />
rivers, such as Moshassuck River in northern part of the state <strong>and</strong> Chipuxet River in southern part of the state, to<br />
find spatial distribution of ISA within these zones in coastal towns (Figure 1a). As ISAs along transportation lines<br />
<strong>for</strong>m the effective ISA that play more important roles in environmental impacts than isolated ISA, we analyzed the<br />
distribution pattern of ISA along the major roads by constructing similar 5 buffer zones as those applied to the major<br />
rivers.<br />
Since there are no major rivers in 3 of the coastal towns, we compared the ISA within different sizes of buffer<br />
zones <strong>for</strong> 17 towns. The results of ISA patterns were illustrated in Figure 3. Percentage of ISA in most of the towns<br />
shows an increasing trend with the increase of buffered areas. The town of Westerly is an exception, where the ISA<br />
show a decreasing trend with the increase of buffer size along the major river (Figure. 3). This is because Westerly<br />
has only very limited areas that are covered by the river buffers. The decreasing trend may not reflect the real pattern<br />
of ISA cover within the township areas.<br />
ASPRS 2007 Annual Conference<br />
Tampa, Florida ♦ May 7-11, 2007