TRIAC Progress Report - KEK
TRIAC Progress Report - KEK
TRIAC Progress Report - KEK

Create successful ePaper yourself
Turn your PDF publications into a flip-book with our unique Google optimized e-Paper software.
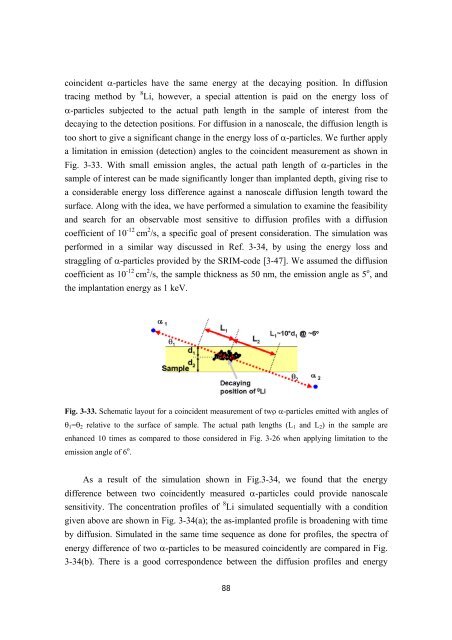
coincident α-particles have the same energy at the decaying position. In diffusion<br />
tracing method by 8 Li, however, a special attention is paid on the energy loss of<br />
α-particles subjected to the actual path length in the sample of interest from the<br />
decaying to the detection positions. For diffusion in a nanoscale, the diffusion length is<br />
too short to give a significant change in the energy loss of α-particles. We further apply<br />
a limitation in emission (detection) angles to the coincident measurement as shown in<br />
Fig. 3-33. With small emission angles, the actual path length of α-particles in the<br />
sample of interest can be made significantly longer than implanted depth, giving rise to<br />
a considerable energy loss difference against a nanoscale diffusion length toward the<br />
surface. Along with the idea, we have performed a simulation to examine the feasibility<br />
and search for an observable most sensitive to diffusion profiles with a diffusion<br />
coefficient of 10 -12 cm 2 /s, a specific goal of present consideration. The simulation was<br />
performed in a similar way discussed in Ref. 3-34, by using the energy loss and<br />
straggling of α-particles provided by the SRIM-code [3-47]. We assumed the diffusion<br />
coefficient as 10 -12 cm 2 /s, the sample thickness as 50 nm, the emission angle as 5 o , and<br />
the implantation energy as 1 keV.<br />
Fig. 3-33. Schematic layout for a coincident measurement of two α-particles emitted with angles of<br />
θ1=θ2 relative to the surface of sample. The actual path lengths (L1 and L2) in the sample are<br />
enhanced 10 times as compared to those considered in Fig. 3-26 when applying limitation to the<br />
emission angle of 6 o .<br />
As a result of the simulation shown in Fig.3-34, we found that the energy<br />
difference between two coincidently measured α-particles could provide nanoscale<br />
sensitivity. The concentration profiles of 8 Li simulated sequentially with a condition<br />
given above are shown in Fig. 3-34(a); the as-implanted profile is broadening with time<br />
by diffusion. Simulated in the same time sequence as done for profiles, the spectra of<br />
energy difference of two α-particles to be measured coincidently are compared in Fig.<br />
3-34(b). There is a good correspondence between the diffusion profiles and energy<br />
88