EECE 259 - Lab 5 - Using The Assembler and Debug Monitor.pdf
EECE 259 - Lab 5 - Using The Assembler and Debug Monitor.pdf
EECE 259 - Lab 5 - Using The Assembler and Debug Monitor.pdf

Create successful ePaper yourself
Turn your PDF publications into a flip-book with our unique Google optimized e-Paper software.
o Explain why your program will run when you enter ‘G’ without having to<br />
specify an address<br />
o What if you changed the value of the PC <strong>and</strong> pressed ‘G’? Try it; you<br />
cannot do any damage – press reset at any time.<br />
<strong>Debug</strong>ging Programs<br />
Press the reset button key0 on the DE2.<br />
We are now going to single step our program, one instruction at a time. Single<br />
stepping is a powerful debugging tool that allows us to slow down/pause the<br />
68000 so that we can observe the execution of each instruction – one at a time.<br />
After each instruction has executed the 68000 registers are displayed so we can<br />
see what effect that instruction has had on the 68000 <strong>and</strong> also on the outside<br />
world, (e.g. turning on an LED for example).<br />
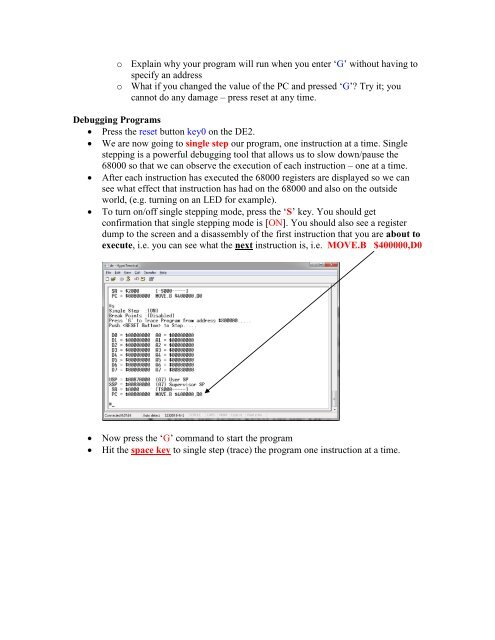
To turn on/off single stepping mode, press the ‘S’ key. You should get<br />
confirmation that single stepping mode is [ON]. You should also see a register<br />
dump to the screen <strong>and</strong> a disassembly of the first instruction that you are about to<br />
execute, i.e. you can see what the next instruction is, i.e. MOVE.B $400000,D0<br />
Now press the ‘G’ comm<strong>and</strong> to start the program<br />
Hit the space key to single step (trace) the program one instruction at a time.