10 2 Full Volume (PDF) - Journal of Cell and Molecular Biology ...
10 2 Full Volume (PDF) - Journal of Cell and Molecular Biology ...
10 2 Full Volume (PDF) - Journal of Cell and Molecular Biology ...

You also want an ePaper? Increase the reach of your titles
YUMPU automatically turns print PDFs into web optimized ePapers that Google loves.
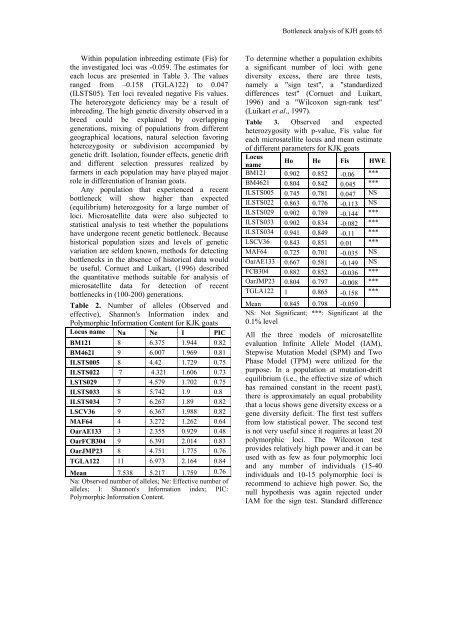
Within population inbreeding estimate (Fis) for<br />
the investigated loci was -0.059. The estimates for<br />
each locus are presented in Table 3. The values<br />
ranged from –0.158 (TGLA122) to 0.047<br />
(ILSTS05). Ten loci revealed negative Fis values.<br />
The heterozygote deficiency may be a result <strong>of</strong><br />
inbreeding. The high genetic diversity observed in a<br />
breed could be explained by overlapping<br />
generations, mixing <strong>of</strong> populations from different<br />
geographical locations, natural selection favoring<br />
heterozygosity or subdivision accompanied by<br />
genetic drift. Isolation, founder effects, genetic drift<br />
<strong>and</strong> different selection pressures realized by<br />
farmers in each population may have played major<br />
role in differentiation <strong>of</strong> Iranian goats.<br />
Any population that experienced a recent<br />
bottleneck will show higher than expected<br />
(equilibrium) heterozgosity for a large number <strong>of</strong><br />
loci. Microsatellite data were also subjected to<br />
statistical analysis to test whether the populations<br />
have undergone recent genetic bottleneck. Because<br />
historical population sizes <strong>and</strong> levels <strong>of</strong> genetic<br />
variation are seldom known, methods for detecting<br />
bottlenecks in the absence <strong>of</strong> historical data would<br />
be useful. Cornuet <strong>and</strong> Luikart, (1996) described<br />
the quantitative methods suitable for analysis <strong>of</strong><br />
microsatellite data for detection <strong>of</strong> recent<br />
bottlenecks in (<strong>10</strong>0-200) generations.<br />
Table 2. Number <strong>of</strong> alleles (Observed <strong>and</strong><br />
effective), Shannon's Information index <strong>and</strong><br />
Polymorphic Information Content for KJK goats<br />
Locus name Na Ne I PIC<br />
BM121 8 6.375 1.944 0.82<br />
BM4621 9 6.007 1.969 0.81<br />
ILSTS005 8 4.42 1.729 0.75<br />
ILSTS022 7 4.321 1.606 0.73<br />
LSTS029 7 4.579 1.702 0.75<br />
ILSTS033 8 5.742 1.9 0.8<br />
ILSTS034 7 6.267 1.89 0.82<br />
LSCV36 9 6.367 1.988 0.82<br />
MAF64 4 3.272 1.262 0.64<br />
OarAE133 3 2.355 0.929 0.48<br />
OarFCB304 9 6.391 2.014 0.83<br />
OarJMP23 8 4.751 1.775 0.76<br />
TGLA122 11 6.973 2.164 0.84<br />
Mean 7.538 5.217 1.759 0.76<br />
Na: Observed number <strong>of</strong> alleles; Ne: Effective number <strong>of</strong><br />
alleles; I: Shannon's Information index; PIC:<br />
Polymorphic Information Content.<br />
Bottleneck analysis <strong>of</strong> KJH goats 65<br />
To determine whether a population exhibits<br />
a significant number <strong>of</strong> loci with gene<br />
diversity excess, there are three tests,<br />
namely a "sign test", a "st<strong>and</strong>ardized<br />
differences test" (Cornuet <strong>and</strong> Luikart,<br />
1996) <strong>and</strong> a "Wilcoxon sign-rank test"<br />
(Luikart et al., 1997).<br />
Table 3. Observed <strong>and</strong> expected<br />
heterozygosity with p-value, Fis value for<br />
each microsatellite locus <strong>and</strong> mean estimate<br />
<strong>of</strong> different parameters for KJK goats<br />
Locus<br />
Ho He Fis HWE<br />
name<br />
BM121 0.902 0.852 -0.06 ***<br />
BM4621 0.804 0.842 0.045 ***<br />
ILSTS005 0.745 0.781 0.047 NS<br />
ILSTS022 0.863 0.776 -0.113 NS<br />
ILSTS029 0.902 0.789 -0.144 ***<br />
ILSTS033 0.902 0.834 -0.082 ***<br />
ILSTS034 0.941 0.849 -0.11 ***<br />
LSCV36 0.843 0.851 0.01 ***<br />
MAF64 0.725 0.701 -0.035 NS<br />
OarAE133 0.667 0.581 -0.149 NS<br />
FCB304 0.882 0.852 -0.036 ***<br />
OarJMP23 0.804 0.797 -0.008 ***<br />
TGLA122 1 0.865 -0.158 ***<br />
Mean 0.845 0.798 -0.059<br />
NS: Not Significant; ***: Significant at the<br />
0.1% level<br />
All the three models <strong>of</strong> microsatellite<br />
evaluation Infinite Allele Model (IAM),<br />
Stepwise Mutation Model (SPM) <strong>and</strong> Two<br />
Phase Model (TPM) were utilized for the<br />
purpose. In a population at mutation-drift<br />
equilibrium (i.e., the effective size <strong>of</strong> which<br />
has remained constant in the recent past),<br />
there is approximately an equal probability<br />
that a locus shows gene diversity excess or a<br />
gene diversity deficit. The first test suffers<br />
from low statistical power. The second test<br />
is not very useful since it requires at least 20<br />
polymorphic loci. The Wilcoxon test<br />
provides relatively high power <strong>and</strong> it can be<br />
used with as few as four polymorphic loci<br />
<strong>and</strong> any number <strong>of</strong> individuals (15-40<br />
individuals <strong>and</strong> <strong>10</strong>-15 polymorphic loci is<br />
recommend to achieve high power. So, the<br />
null hypothesis was again rejected under<br />
IAM for the sign test. St<strong>and</strong>ard difference