Untitled - Journal of Lighting Engineering
Untitled - Journal of Lighting Engineering
Untitled - Journal of Lighting Engineering

Create successful ePaper yourself
Turn your PDF publications into a flip-book with our unique Google optimized e-Paper software.
Although the areas within the<br />
neighbourhoods were rather similar,<br />
different neighbourhood and lighting<br />
components may yield different<br />
connections between the factors.<br />
Regression analysis examines a group <strong>of</strong><br />
independent variables at the same time and<br />
seeks the independent explanatory effects<br />
(controlling for other variables in the<br />
model) instead <strong>of</strong> mere zero-order<br />
correlations; it was therefore considered<br />
suitable for an exploratory study.<br />
Possible connections between the<br />
lighting attributes and safety/pleasantness<br />
were first explored with linear regression<br />
<strong>Lighting</strong> promoting safety and creating a sense <strong>of</strong> pleasantness<br />
analysis (enter method)/standard multiple<br />
regression; the analysis revealed significant<br />
relations between the lighting attributes and<br />
the dependent variables. Only these<br />
attributes were included in the subsequent<br />
regression analysis (enter). Finally, the<br />
suggested connections were tested using the<br />
Spearman correlation as well.<br />
As with in some <strong>of</strong> the statements, the<br />
scale ranged from negative to positive and<br />
again back to negative (e.g. ‘lighting on the<br />
pathway is too strong – totally inadequate’):<br />
Nonlinear regression was also checked, but<br />
no significant nonlinear connections were<br />
detected.<br />
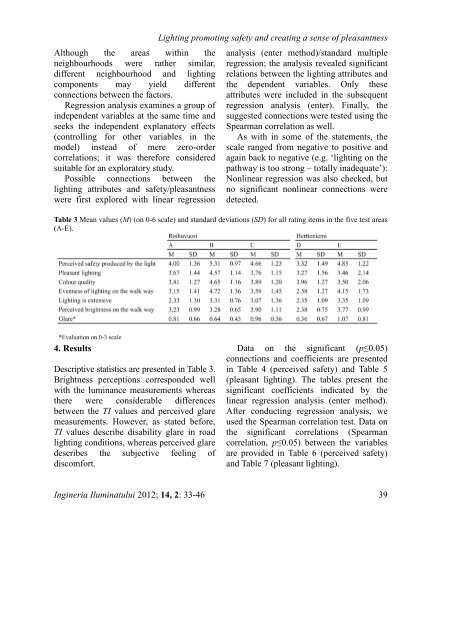
Table 3 Mean values (M) (on 0-6 scale) and standard deviations (SD) for all rating items in the five test areas<br />
(A-E).<br />
4. Results<br />
Descriptive statistics are presented in Table 3.<br />
Brightness perceptions corresponded well<br />
with the luminance measurements whereas<br />
there were considerable differences<br />
between the TI values and perceived glare<br />
measurements. However, as stated before,<br />
TI values describe disability glare in road<br />
lighting conditions, whereas perceived glare<br />
describes the subjective feeling <strong>of</strong><br />
discomfort.<br />
Data on the significant (p≤0.05)<br />
connections and coefficients are presented<br />
in Table 4 (perceived safety) and Table 5<br />
(pleasant lighting). The tables present the<br />
significant coefficients indicated by the<br />
linear regression analysis (enter method).<br />
After conducting regression analysis, we<br />
used the Spearman correlation test. Data on<br />
the significant correlations (Spearman<br />
correlation, p≤0.05) between the variables<br />
are provided in Table 6 (perceived safety)<br />
and Table 7 (pleasant lighting).<br />
Ingineria Iluminatului 2012; 14, 2: 33-46 39