

Operations Review - ChartNexus
Operations Review - ChartNexus
Operations Review - ChartNexus

Create successful ePaper yourself
Turn your PDF publications into a flip-book with our unique Google optimized e-Paper software.
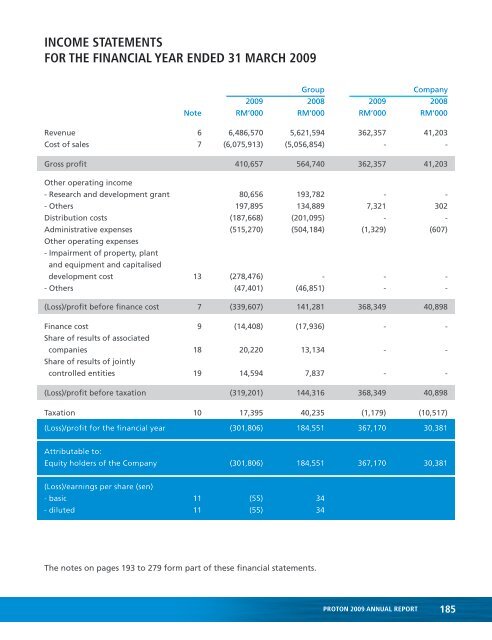
INCOME STATEMENTS<br />
FOR THE FINANCIAL YEAR ENDED 31 MARCH 2009<br />
Revenue 6 6,486,570 5,621,594 362,357 41,203<br />
Cost of sales 7 (6,075,913) (5,056,854) - -<br />
Gross profit 410,657 564,740 362,357 41,203<br />
Other operating income<br />
- Research and development grant 80,656 193,782 - -<br />
- Others 197,895 134,889 7,321 302<br />
Distribution costs (187,668) (201,095) - -<br />
Administrative expenses (515,270) (504,184) (1,329) (607)<br />
Other operating expenses<br />
Group Company<br />
2009 2008 2009 2008<br />
Note RM’000 RM’000 RM’000 RM’000<br />
- Impairment of property, plant<br />
and equipment and capitalised<br />
development cost 13 (278,476) - - -<br />
- Others (47,401) (46,851) - -<br />
(Loss)/profit before finance cost 7 (339,607) 141,281 368,349 40,898<br />
Finance cost<br />
Share of results of associated<br />
9 (14,408) (17,936) - -<br />
companies<br />
Share of results of jointly<br />
18 20,220 13,134 - -<br />
controlled entities 19 14,594 7,837 - -<br />
(Loss)/profit before taxation (319,201) 144,316 368,349 40,898<br />
Taxation 10 17,395 40,235 (1,179) (10,517)<br />
(Loss)/profit for the financial year (301,806) 184,551 367,170 30,381<br />
Attributable to:<br />
Equity holders of the Company (301,806) 184,551 367,170 30,381<br />
(Loss)/earnings per share (sen)<br />
- basic 11 (55) 34<br />
- diluted 11 (55) 34<br />
The notes on pages 193 to 279 form part of these financial statements.<br />
PROTON 2009 ANNUAL REPORT<br />
185


