A Bigger Future report - BFI - British Film Institute
A Bigger Future report - BFI - British Film Institute
A Bigger Future report - BFI - British Film Institute

Create successful ePaper yourself
Turn your PDF publications into a flip-book with our unique Google optimized e-Paper software.
Production/Development<br />
Facilities<br />
Distribution<br />
Exhibition<br />
Total<br />
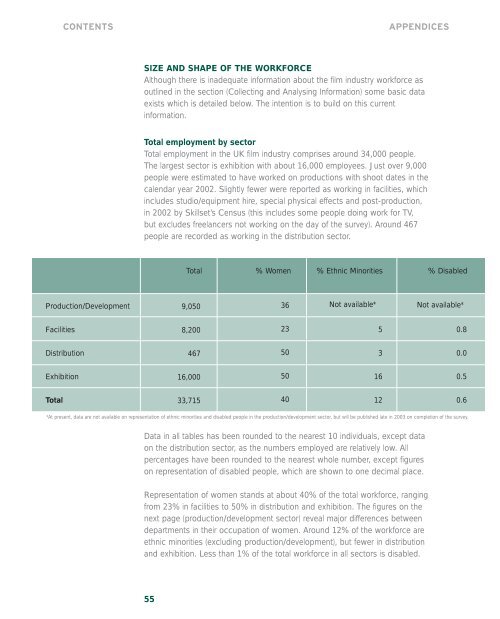
SIZE AND SHAPE OF THE WORKFORCE<br />
Although there is inadequate information about the film industry workforce as<br />
outlined in the section (Collecting and Analysing Information) some basic data<br />
exists which is detailed below. The intention is to build on this current<br />
information.<br />
Total employment by sector<br />
Total employment in the UK film industry comprises around 34,000 people.<br />
The largest sector is exhibition with about 16,000 employees. Just over 9,000<br />
people were estimated to have worked on productions with shoot dates in the<br />
calendar year 2002. Slightly fewer were <strong>report</strong>ed as working in facilities, which<br />
includes studio/equipment hire, special physical effects and post-production,<br />
in 2002 by Skillset’s Census (this includes some people doing work for TV,<br />
but excludes freelancers not working on the day of the survey). Around 467<br />
people are recorded as working in the distribution sector.<br />
Data in all tables has been rounded to the nearest 10 individuals, except data<br />
on the distribution sector, as the numbers employed are relatively low. All<br />
percentages have been rounded to the nearest whole number, except figures<br />
on representation of disabled people, which are shown to one decimal place.<br />
Representation of women stands at about 40% of the total workforce, ranging<br />
from 23% in facilities to 50% in distribution and exhibition. The figures on the<br />
next page (production/development sector) reveal major differences between<br />
departments in their occupation of women. Around 12% of the workforce are<br />
ethnic minorities (excluding production/development), but fewer in distribution<br />
and exhibition. Less than 1% of the total workforce in all sectors is disabled.<br />
55<br />
Total % Women % Ethnic Minorities % Disabled<br />
9,050<br />
8,200<br />
467<br />
16,000<br />
33,715<br />
36<br />
23<br />
50<br />
50<br />
40<br />
Not available* Not available*<br />
*At present, data are not available on representation of ethnic minorities and disabled people in the production/development sector, but will be published late in 2003 on completion of the survey.<br />
5<br />
3<br />
16<br />
12<br />
0.8<br />
0.0<br />
0.5<br />
0.6