


You also want an ePaper? Increase the reach of your titles
YUMPU automatically turns print PDFs into web optimized ePapers that Google loves.
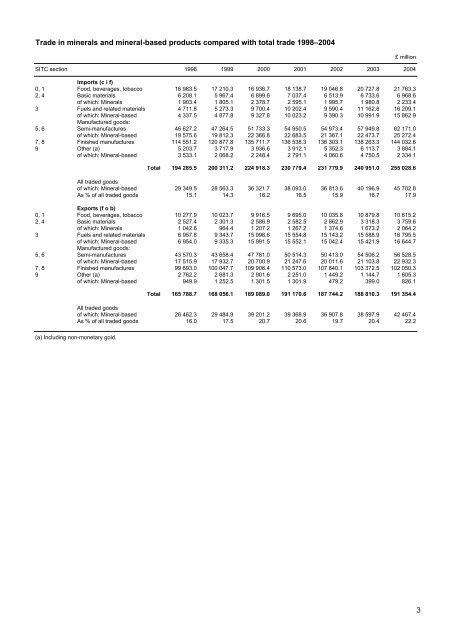
trade in minerals and mineral-based products compared with total trade 1998–2004<br />
£ million<br />
SITC section 1998 1999 2000 2001 2002 2003 2004<br />
imports (c i f)<br />
0, 1 Food, beverages, tobacco 16 983.5 17 210.3 16 936.7 18 138.7 19 046.8 20 727.8 21 763.3<br />
2, 4 Basic materials 6 208.1 5 967.4 6 899.6 7 037.4 6 513.9 6 733.6 6 968.6<br />
of which: Minerals 1 903.4 1 805.1 2 378.7 2 595.1 1 995.7 1 980.8 2 233.4<br />
3 Fuels and related materials 4 711.8 5 273.3 9 700.4 10 202.4 9 590.4 11 162.8 16 209.1<br />
of which: Mineral-based 4 337.5 4 877.8 9 327.8 10 023.2 9 390 3 10 991.9 15 862.9<br />
Manufactured goods:<br />
5, 6 Semi-manufactures 46 627.2 47 264.5 51 733.3 54 950.5 54 973.4 57 949.8 62 171.0<br />
of which: Mineral-based 19 575.6 19 812.3 22 366.8 22 683.5 21 367.1 22 473.7 25 272.4<br />
7, 8 Finished manufactures 114 551.2 120 877.8 135 711.7 136 538.3 136 303.1 138 263.3 144 032.6<br />
9 Other (a) 5 203.7 3 717.9 3 936.6 3 912.1 5 352.3 6 113.7 3 884.1<br />
of which: Mineral-based 3 533.1 2 068.2 2 248.4 2 791.1 4 060.6 4 750.5 2 334.1<br />
total 194 285.5 200 311.2 224 918.3 230 779.4 231 779.9 240 951.0 255 028.6<br />
All traded goods<br />
of which: Mineral-based 29 349.5 28 563.3 36 321.7 38 093.0 36 813.6 40 196.9 45 702.8<br />
As % of all traded goods 15.1 14.3 16.2 16.5 15.9 16.7 17.9<br />
exports (f o b)<br />
0, 1 Food, beverages, tobacco 10 277.9 10 023.7 9 916.5 9 695.0 10 035.8 10 879.8 10 615.2<br />
2, 4 Basic materials 2 527.4 2 301.3 2 586.9 2 582.5 2 862.9 3 318.3 3 759.6<br />
of which: Minerals 1 042.6 964.4 1 207.2 1 267.2 1 374.6 1 673.2 2 064.2<br />
3 Fuels and related materials 6 957.8 9 343.7 15 996.6 15 554.8 15 143.2 15 588.9 16 795.5<br />
of which: Mineral-based 6 954.0 9 335.3 15 991.5 15 552.1 15 042.4 15 421.9 16 644.7<br />
Manufactured goods:<br />
5, 6 Semi-manufactures 43 570.3 43 658.4 47 781.0 50 514.3 50 413.0 54 506.2 56 528.5<br />
of which: Mineral-based 17 515.9 17 932.7 20 700.9 21 247.6 20 011.6 21 103.8 22 932.3<br />
7, 8 Finished manufactures 99 693.0 100 047.7 109 906.4 110 573.0 107 840.1 103 372.5 102 050.3<br />
9 Other (a) 2 762.2 2 681.3 2 901.6 2 251.0 1 449.2 1 144.7 1 605.3<br />
of which: Mineral-based 949.9 1 252.5 1 301.5 1 301.9 479.2 399.0 826.1<br />
total 165 788.7 168 056.1 189 089.0 191 170.6 187 744.2 188 810.3 191 354.4<br />
All traded goods<br />
of which: Mineral-based 26 462.3 29 484.9 39 201.2 39 368.9 36 907.8 38 597.9 42 467.4<br />
As % of all traded goods 16.0 17.5 20.7 20.6 19.7 20.4 22.2<br />
(a) Including non-monetary gold.<br />
3


