


Create successful ePaper yourself
Turn your PDF publications into a flip-book with our unique Google optimized e-Paper software.
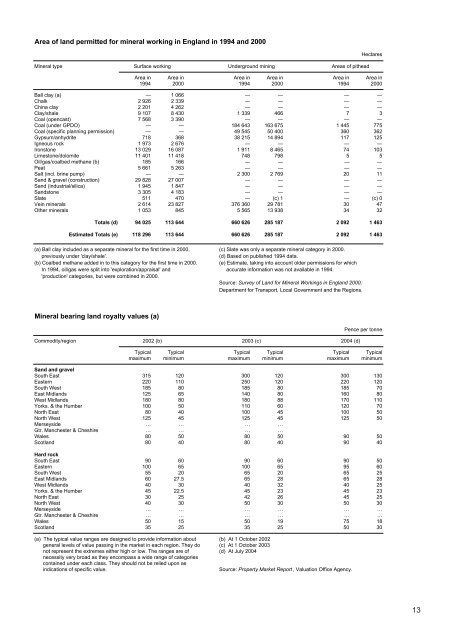
area of land permitted for mineral working in england in 1994 and 2000<br />
Mineral type<br />
Hectares<br />
Area in Area in Area in Area in Area in Area in<br />
1994 2000 1994 2000 1994 2000<br />
Ball clay (a) — 1 066 — — — —<br />
Chalk 2 926 2 339 — — — —<br />
China clay 2 201 4 262 — — — —<br />
Clay/shale 9 107 8 430 1 339 466 7 3<br />
Coal (opencast) 7 568 3 390 — — — —<br />
Coal (under GPDO) — — 184 643 163 675 1 445 775<br />
Coal (specific planning permission) — — 49 545 50 400 360 362<br />
Gypsum/anhydrite 718 368 38 215 14 894 117 125<br />
Igneous rock 1 973 2 676 — — — —<br />
Ironstone 13 029 16 087 1 911 8 465 74 103<br />
Limestone/dolomite 11 401 11 418 748 798 5 5<br />
Oil/gas/coalbed methane (b) 185 166 — — — —<br />
Peat 5 661 5 263 — — — —<br />
Salt (incl. brine pump) — — 2 300 2 769 20 11<br />
Sand & gravel (construction) 29 828 27 007 — — — —<br />
Sand (industrial/silica) 1 945 1 847 — — — —<br />
Sandstone 3 305 4 183 — — — —<br />
Slate 511 470 — (c) 1 — (c) 0<br />
Vein minerals 2 614 23 827 376 360 29 781 30 47<br />
Other minerals 1 053 845 5 565 13 938 34 32<br />
totals (d) 94 025 113 644 660 626 285 187 2 092 1 463<br />
estimated totals (e) 118 296 113 644 660 626 285 187 2 092 1 463<br />
(a) Ball clay included as a separate mineral for the first time in 2000, (c) Slate was only a separate mineral category in 2000.<br />
previously under 'clay/shale'. (d) Based on published 1994 data.<br />
(b) Coalbed methane added in to this category for the first time in 2000. (e) Estimate, taking into account older permissions for which<br />
In 1994, oil/gas were split into 'exploration/appraisal' and accurate information was not available in 1994.<br />
'production' categories, but were combined in 2000.<br />
Source: Survey of Land for Mineral Workings in England 2000,<br />
Department for Transport, Local Government and the Regions.<br />
Mineral bearing land royalty values (a)<br />
Commodity/region<br />
Surface working<br />
2002 (b) 2003 (c)<br />
Underground mining Areas of pithead<br />
Pence per tonne<br />
Typical Typical Typical Typical Typical Typical<br />
maximum minimum maximum minimum maximum minimum<br />
sand and gravel<br />
South East 315 120 300 120 300 130<br />
Eastern 220 110 250 120 220 120<br />
South West 185 80 185 80 185 70<br />
East Midlands 125 65 140 80 160 80<br />
West Midlands 180 80 180 88 170 110<br />
Yorks. & the Humber 100 50 110 60 120 70<br />
North East 80 40 100 45 100 50<br />
North West 125 45 125 45 125 50<br />
Merseyside … … … …<br />
Gtr. Manchester & Cheshire … … … …<br />
Wales 80 50 80 50 90 50<br />
Scotland 80 40 80 40 90 40<br />
hard rock<br />
South East 90 60 90 60 90 50<br />
Eastern 100 65 100 65 95 60<br />
South West 55 20 65 20 65 25<br />
East Midlands 60 27.5 65 28 65 28<br />
West Midlands 40 30 40 32 40 25<br />
Yorks. & the Humber 45 22.5 45 23 45 23<br />
North East 30 25 42 26 45 25<br />
North West 40 30 50 30 50 30<br />
Merseyside … … … … … …<br />
Gtr. Manchester & Cheshire … … … … … …<br />
Wales 50 15 50 19 75 18<br />
Scotland 35 25 35 25 50 30<br />
(a) The typical value ranges are designed to provide information about (b) At 1 October 2002<br />
general levels of value passing in the market in each region. They do (c) At 1 October 2003<br />
not represent the extremes either high or low. The ranges are of (d) At July 2004<br />
necessity very broad as they encompass a wide range of categories<br />
contained under each class. They should not be relied upon as<br />
indications of specific value. Source: Property Market Report , Valuation Office Agency.<br />
2004 (d)<br />
13


