You also want an ePaper? Increase the reach of your titles
YUMPU automatically turns print PDFs into web optimized ePapers that Google loves.
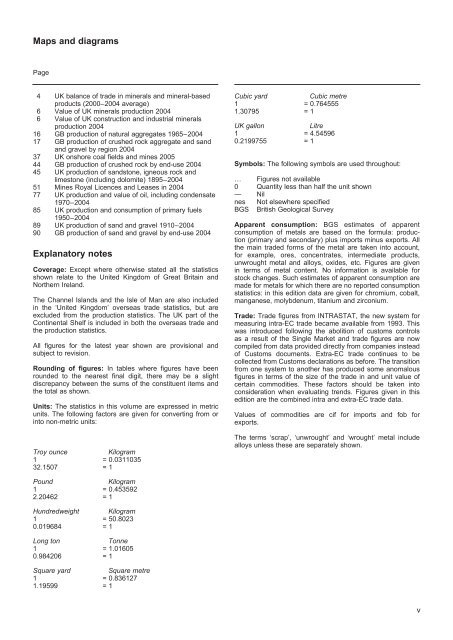
Maps and diagrams<br />
Page<br />
4 UK balance of trade in minerals and mineral-based<br />
products (2000–2004 average)<br />
6 Value of UK minerals production 2004<br />
6 Value of UK construction and industrial minerals<br />
production 2004<br />
16 GB production of natural aggregates 1965–2004<br />
17 GB production of crushed rock aggregate and sand<br />
and gravel by region 2004<br />
37 UK onshore coal fields and mines 2005<br />
44 GB production of crushed rock by end-use 2004<br />
45 UK production of sandstone, igneous rock and<br />
limestone (including dolomite) 1895–2004<br />
51 Mines Royal Licences and Leases in 2004<br />
77 UK production and value of oil, including condensate<br />
1970–2004<br />
85 UK production and consumption of primary fuels<br />
1950–2004<br />
89 UK production of sand and gravel 1910–2004<br />
90 GB production of sand and gravel by end-use 2004<br />
explanatory notes<br />
coverage: Except where otherwise stated all the statistics<br />
shown relate to the United Kingdom of Great Britain and<br />
Northern Ireland.<br />
The Channel Islands and the Isle of Man are also included<br />
in the ‘United Kingdom’ overseas trade statistics, but are<br />
excluded from the production statistics. The UK part of the<br />
Continental Shelf is included in both the overseas trade and<br />
the production statistics.<br />
All figures for the latest year shown are provisional and<br />
subject to revision.<br />
rounding of figures: In tables where figures have been<br />
rounded to the nearest final digit, there may be a slight<br />
discrepancy between the sums of the constituent items and<br />
the total as shown.<br />
units: The statistics in this volume are expressed in metric<br />
units. The following factors are given for converting from or<br />
into non-metric units:<br />
Troy ounce Kilogram<br />
1 = 0.0311035<br />
32.1507 = 1<br />
Pound Kilogram<br />
1 = 0.453592<br />
2.20462 = 1<br />
Hundredweight Kilogram<br />
1 = 50.8023<br />
0.019684 = 1<br />
Long ton Tonne<br />
1 = 1.01605<br />
0.984206 = 1<br />
Square yard Square metre<br />
1 = 0.836127<br />
1.19599 = 1<br />
Cubic yard Cubic metre<br />
1 = 0.764555<br />
1.30795 = 1<br />
UK gallon Litre<br />
1 = 4.54596<br />
0.2199755 = 1<br />
symbols: The following symbols are used throughout:<br />
… Figures not available<br />
0 Quantity less than half the unit shown<br />
— Nil<br />
nes Not elsewhere specified<br />
BGS British Geological Survey<br />
apparent consumption: BGS estimates of apparent<br />
consumption of metals are based on the formula: production<br />
(primary and secondary) plus imports minus exports. All<br />
the main traded forms of the metal are taken into account,<br />
for example, ores, concentrates, intermediate products,<br />
unwrought metal and alloys, oxides, etc. Figures are given<br />
in terms of metal content. No information is available for<br />
stock changes. Such estimates of apparent consumption are<br />
made for metals for which there are no reported consumption<br />
statistics: in this edition data are given for chromium, cobalt,<br />
manganese, molybdenum, titanium and zirconium.<br />
trade: Trade figures from INTRASTAT, the new system for<br />
measuring intra-EC trade became available from 1993. This<br />
was introduced following the abolition of customs controls<br />
as a result of the Single Market and trade figures are now<br />
compiled from data provided directly from companies instead<br />
of Customs documents. Extra-EC trade continues to be<br />
collected from Customs declarations as before. The transition<br />
from one system to another has produced some anomalous<br />
figures in terms of the size of the trade in and unit value of<br />
certain commodities. These factors should be taken into<br />
consideration when evaluating trends. Figures given in this<br />
edition are the combined intra and extra-EC trade data.<br />
Values of commodities are cif for imports and fob for<br />
exports.<br />
The terms ‘scrap’, ‘unwrought’ and ‘wrought’ metal include<br />
alloys unless these are separately shown.<br />
v


