


You also want an ePaper? Increase the reach of your titles
YUMPU automatically turns print PDFs into web optimized ePapers that Google loves.
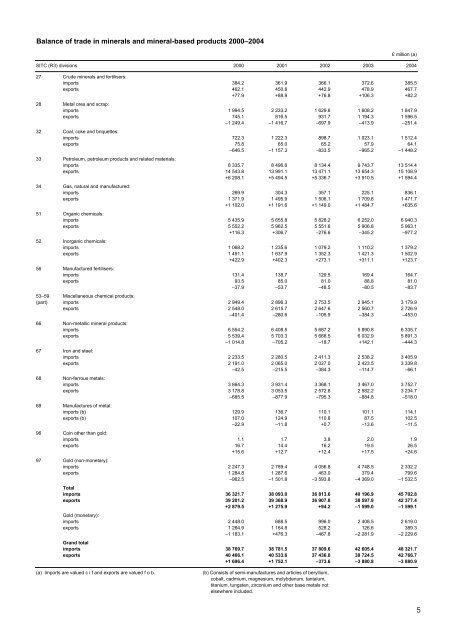
alance of trade in minerals and mineral-based products 2000–2004<br />
£ million (a)<br />
SITC (R3) divisions 2000 2001 2002 2003 2004<br />
27 Crude minerals and fertilisers:<br />
imports 384.2 361.9 366.1 372.6 385.5<br />
exports 462.1 450.8 442.9 478.9 467.7<br />
+77.9 +88.9 +76.8 +106.3 +82.2<br />
28 Metal ores and scrap:<br />
imports 1 994.5 2 233.2 1 629.6 1 608.2 1 847.9<br />
exports 745.1 816.5 931.7 1 194.3 1 596.5<br />
–1 249.4 –1 416.7 –697.9 –413.9 –251.4<br />
32 Coal, coke and briquettes:<br />
imports 722.3 1 222.3 898.7 1 023.1 1 512.4<br />
exports 75.8 65.0 65.2 57.9 64.1<br />
–646.5 –1 157.3 –833.5 –965.2 –1 448.2<br />
33 Petroleum, petroleum products and related materials:<br />
imports 8 335.7 8 496.6 8 134.4 9 743.7 13 514.4<br />
exports 14 543.8 13 991.1 13 471.1 13 654.3 15 108.9<br />
+6 208.1 +5 494.5 +5 336.7 +3 910.5 +1 594.4<br />
34 Gas, natural and manufactured:<br />
imports 269.9 304.3 357.1 225.1 836.1<br />
exports 1 371.9 1 495.9 1 506.1 1 709.8 1 471.7<br />
+1 102.0 +1 191.6 +1 149.0 +1 484.7 +635.6<br />
51 Organic chemicals:<br />
imports 5 435.9 5 655.8 5 828.2 6 252.0 6 940.3<br />
exports 5 552.2 5 962.5 5 551.6 5 906.8 5 963.1<br />
+116.3 +306.7 –276.6 –345.2 –977.2<br />
52 Inorganic chemicals:<br />
imports 1 068.2 1 235.6 1 079.2 1 110.2 1 379.2<br />
exports 1 491.1 1 637.9 1 352.3 1 421.3 1 502.9<br />
+422.9 +402.3 +273.1 +311.1 +123.7<br />
56 Manufactured fertilisers:<br />
imports 131.4 138.7 129.5 169.4 164.7<br />
exports 93.5 85.0 81.0 88.8 81.0<br />
–37.9 –53.7 –48.5 –80.5 –83.7<br />
53–59 Miscellaneous chemical products:<br />
(part) imports 2 949.4 2 896.3 2 753.5 2 945.1 3 179.9<br />
exports 2 548.0 2 615.7 2 647.6 2 560.7 2 726.9<br />
–401.4 –280.6 –105.9 –384.3 –453.0<br />
66 Non-metallic mineral products:<br />
imports 6 554.2 6 408.5 5 687.2 5 890.8 6 335.7<br />
exports 5 539.4 5 703.3 5 668.5 6 032.9 5 891.3<br />
–1 014.8 –705.2 –18.7 +142.1 –444.3<br />
67 Iron and steel:<br />
imports 2 233.5 2 280.5 2 411.3 2 538.2 3 405.9<br />
exports 2 191.0 2 065.0 2 027.0 2 423.5 3 339.8<br />
–42.5 –215.5 –384.3 –114.7 –66.1<br />
68 Non-ferrous metals:<br />
imports 3 864.3 3 931.4 3 368.1 3 467.0 3 752.7<br />
exports 3 178.8 3 053.5 2 572.8 2 582.2 3 234.7<br />
–685.5 –877.9 –795.3 –884.8 –518.0<br />
69 Manufactures of metal:<br />
imports (b) 129.9 136.7 110.1 101.1 114.1<br />
exports (b) 107.0 124.9 110.8 87.5 102.5<br />
–22.9 –11.8 +0.7 –13.6 –11.5<br />
96 Coin other than gold:<br />
imports 1.1 1.7 3.8 2.0 1.9<br />
exports 16.7 14.4 16.2 19.5 26.5<br />
+15.6 +12.7 +12.4 +17.5 +24.6<br />
97 Gold (non-monetary):<br />
imports 2 247.3 2 789.4 4 056.8 4 748.5 2 332.2<br />
exports 1 284.8 1 287.6 463.0 379.4 799.6<br />
–962.5 –1 501.8 –3 593.8 –4 369.0 –1 532.5<br />
total<br />
imports 36 321.7 38 093.0 36 813.6 40 196.9 45 702.8<br />
exports 39 201.2 39 368.9 36 907.8 38 597.9 42 377.4<br />
+2 879.5 +1 275.9 +94.2 –1 599.0 –1 599.1<br />
Gold (monetary):<br />
imports 2 448.0 688.5 996.0 2 408.5 2 619.0<br />
exports 1 264.9 1 164.8 528.2 126.6 389.3<br />
–1 183.1 +476.3 –467.8 –2 281.9 –2 229.6<br />
grand total<br />
imports 38 769.7 38 781.5 37 809.6 42 605.4 48 321.7<br />
exports 40 466.1 40 533.6 37 436.0 38 724.5 42 766.7<br />
+1 696.4 +1 752.1 –373.6 –3 880.8 –3 880.9<br />
(a) Imports are valued c i f and exports are valued f o b. (b) Consists of semi-manufactures and articles of beryllium,<br />
cobalt, cadmium, magnesium, molybdenum, tantalum,<br />
titanium, tungsten, zirconium and other base metals not<br />
elsewhere included.<br />
5


