


Create successful ePaper yourself
Turn your PDF publications into a flip-book with our unique Google optimized e-Paper software.
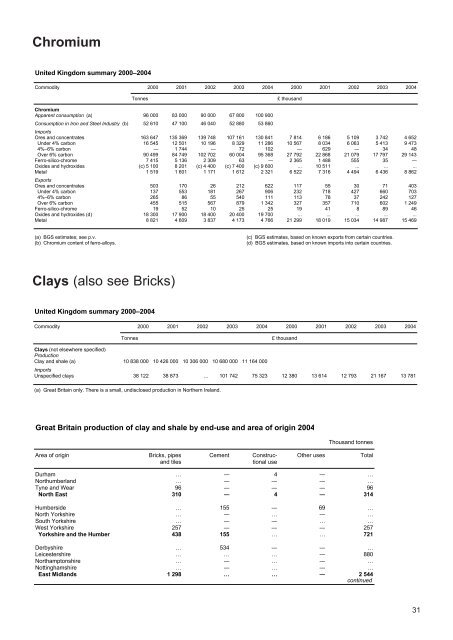
chromium<br />
united Kingdom summary 2000–2004<br />
Commodity 2000 2001 2002 2003 2004 2000 2001 2002 2003 2004<br />
Tonnes £ thousand<br />
chromium<br />
Apparent consumption (a) 96 000 83 000 90 000 67 800 100 900<br />
Consumption in Iron and Steel Industry (b) 52 610 47 100 46 040 52 880 53 860<br />
Imports<br />
Ores and concentrates 163 647 135 369 139 748 107 161 130 841 7 814 6 186 5 109 3 742 4 652<br />
Under 4% carbon 16 545 12 501 10 196 8 329 11 286 10 567 8 034 6 063 5 413 9 473<br />
4%–6% carbon — 1 744 — 72 102 — 629 — 34 48<br />
Over 6% carbon 90 499 84 749 102 702 60 004 95 368 27 792 22 868 21 079 17 797 29 143<br />
Ferro-silico-chrome 7 415 5 136 2 309 63 — 2 365 1 488 555 35 —<br />
Oxides and hydroxides (c) 5 100 8 201 (c) 4 400 (c) 7 400 (c) 9 600 ... 10 511 ... ... ...<br />
Metal 1 519 1 601 1 171 1 612 2 321 6 522 7 316 4 494 6 436 8 862<br />
Exports<br />
Ores and concentrates 503 170 26 212 622 117 55 30 71 403<br />
Under 4% carbon 137 553 181 267 906 232 718 427 660 703<br />
4%–6% carbon 265 86 55 540 111 113 78 37 242 127<br />
Over 6% carbon 455 515 567 879 1 342 327 357 710 602 1 249<br />
Ferro-silico-chrome 19 52 10 25 25 19 41 8 89 46<br />
Oxides and hydroxides (d) 18 300 17 900 18 400 20 400 19 700 ... ... ... ... ...<br />
Metal 8 821 4 609 3 837 4 173 4 766 21 299 18 019 15 034 14 987 15 469<br />
(a) BGS estimates; see p.v. (c) BGS estimates, based on known exports from certain countries.<br />
(b) Chromium content of ferro-alloys. (d) BGS estimates, based on known imports into certain countries.<br />
clays (also see Bricks)<br />
united Kingdom summary 2000–2004<br />
Commodity 2000 2001 2002 2003 2004 2000 2001 2002 2003 2004<br />
Tonnes £ thousand<br />
clays (not elsewhere specified)<br />
Production<br />
Clay and shale (a) 10 838 000 10 426 000 10 306 000 10 680 000 11 164 000<br />
Imports<br />
Unspecified clays 38 122 38 873 ... 101 742 75 323 12 380 13 614 12 793 21 167 13 781<br />
(a) Great Britain only. There is a small, undisclosed production in Northern Ireland.<br />
great britain production of clay and shale by end-use and area of origin 2004<br />
Thousand tonnes<br />
Area of origin Bricks, pipes Cement Construc- Other uses Total<br />
and tiles tional use<br />
Durham … — 4 — …<br />
Northumberland … — — — …<br />
Tyne and Wear 96 — — — 96<br />
North east 310 — 4 — 314<br />
Humberside … 155 — 69 …<br />
North Yorkshire … — … — …<br />
South Yorkshire … — — … …<br />
West Yorkshire 257 — — — 257<br />
yorkshire and the humber 438 155 … … 721<br />
Derbyshire … 534 — — …<br />
Leicestershire … … … — 880<br />
Northamptonshire … — … — …<br />
Nottinghamshire … — … — …<br />
east Midlands 1 298 … … — 2 544<br />
continued<br />
31


