


Create successful ePaper yourself
Turn your PDF publications into a flip-book with our unique Google optimized e-Paper software.
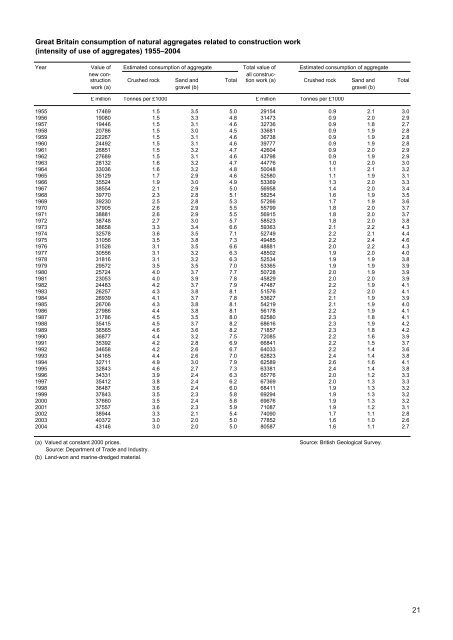
great britain consumption of natural aggregates related to construction work<br />
(intensity of use of aggregates) 1955–2004<br />
Year Value of Estimated consumption of aggregate Total value of Estimated consumption of aggregate<br />
new con- all construcstruction<br />
Crushed rock Sand and Total tion work (a) Crushed rock Sand and Total<br />
work (a) gravel (b) gravel (b)<br />
£ million Tonnes per £1000 £ million Tonnes per £1000<br />
1955 17469 1.5 3.5 5.0 29154 0.9 2.1 3.0<br />
1956 19080 1.5 3.3 4.8 31473 0.9 2.0 2.9<br />
1957 19446 1.5 3.1 4.6 32736 0.9 1.8 2.7<br />
1958 20786 1.5 3.0 4.5 33681 0.9 1.9 2.8<br />
1959 22267 1.5 3.1 4.6 36738 0.9 1.9 2.8<br />
1960 24492 1.5 3.1 4.6 39777 0.9 1.9 2.8<br />
1961 26851 1.5 3.2 4.7 42604 0.9 2.0 2.9<br />
1962 27689 1.5 3.1 4.6 43798 0.9 1.9 2.9<br />
1963 28132 1.6 3.2 4.7 44776 1.0 2.0 3.0<br />
1964 33036 1.6 3.2 4.8 50048 1.1 2.1 3.2<br />
1965 35129 1.7 2.9 4.6 52580 1.1 1.9 3.1<br />
1966 35524 1.9 3.0 4.9 53369 1.3 2.0 3.3<br />
1967 38554 2.1 2.9 5.0 56958 1.4 2.0 3.4<br />
1968 39770 2.3 2.8 5.1 58254 1.6 1.9 3.5<br />
1969 39230 2.5 2.8 5.3 57266 1.7 1.9 3.6<br />
1970 37905 2.6 2.9 5.5 55799 1.8 2.0 3.7<br />
1971 38881 2.6 2.9 5.5 56915 1.8 2.0 3.7<br />
1972 38748 2.7 3.0 5.7 58523 1.8 2.0 3.8<br />
1973 38658 3.3 3.4 6.6 59363 2.1 2.2 4.3<br />
1974 32578 3.6 3.5 7.1 52749 2.2 2.1 4.4<br />
1975 31056 3.5 3.8 7.3 49485 2.2 2.4 4.6<br />
1976 31526 3.1 3.5 6.6 48881 2.0 2.2 4.3<br />
1977 30556 3.1 3.2 6.3 48502 1.9 2.0 4.0<br />
1978 31816 3.1 3.2 6.3 52534 1.9 1.9 3.8<br />
1979 29572 3.5 3.5 7.0 53365 1.9 1.9 3.9<br />
1980 25724 4.0 3.7 7.7 50728 2.0 1.9 3.9<br />
1981 23053 4.0 3.9 7.8 45829 2.0 2.0 3.9<br />
1982 24483 4.2 3.7 7.9 47487 2.2 1.9 4.1<br />
1983 26257 4.3 3.8 8.1 51576 2.2 2.0 4.1<br />
1984 26939 4.1 3.7 7.8 53627 2.1 1.9 3.9<br />
1985 26706 4.3 3.8 8.1 54219 2.1 1.9 4.0<br />
1986 27986 4.4 3.8 8.1 56178 2.2 1.9 4.1<br />
1987 31786 4.5 3.5 8.0 62580 2.3 1.8 4.1<br />
1988 35415 4.5 3.7 8.2 68616 2.3 1.9 4.2<br />
1989 36565 4.6 3.6 8.2 71857 2.3 1.8 4.2<br />
1990 36877 4.4 3.2 7.5 72085 2.2 1.6 3.9<br />
1991 35392 4.2 2.8 6.9 66841 2.2 1.5 3.7<br />
1992 34658 4.2 2.6 6.7 64033 2.2 1.4 3.6<br />
1993 34165 4.4 2.6 7.0 62823 2.4 1.4 3.8<br />
1994 32711 4.9 3.0 7.9 62589 2.6 1.6 4.1<br />
1995 32843 4.6 2.7 7.3 63381 2.4 1.4 3.8<br />
1996 34331 3.9 2.4 6.3 65776 2.0 1.2 3.3<br />
1997 35412 3.8 2.4 6.2 67369 2.0 1.3 3.3<br />
1998 36487 3.6 2.4 6.0 68411 1.9 1.3 3.2<br />
1999 37843 3.5 2.3 5.8 69294 1.9 1.3 3.2<br />
2000 37660 3.5 2.4 5.8 69676 1.9 1.3 3.2<br />
2001 37557 3.6 2.3 5.9 71087 1.9 1.2 3.1<br />
2002 38944 3.3 2.1 5.4 74090 1.7 1.1 2.8<br />
2003 40372 3.0 2.0 5.0 77852 1.6 1.0 2.6<br />
2004 43146 3.0 2.0 5.0 80587 1.6 1.1 2.7<br />
(a) Valued at constant 2000 prices. Source: British Geological Survey.<br />
Source: Department of Trade and Industry.<br />
(b) Land-won and marine-dredged material.<br />
21


