


Create successful ePaper yourself
Turn your PDF publications into a flip-book with our unique Google optimized e-Paper software.
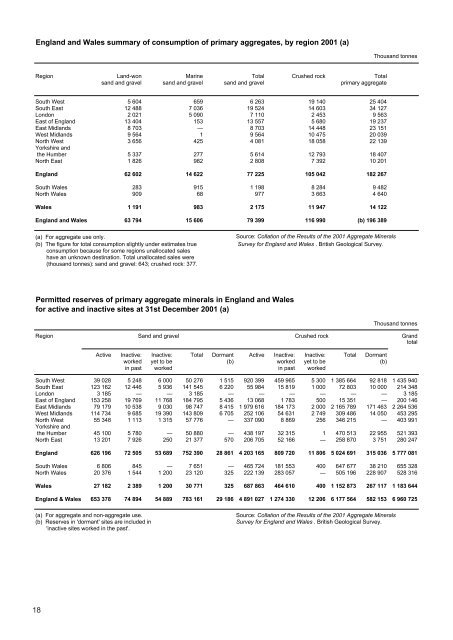
england and Wales summary of consumption of primary aggregates, by region 2001 (a)<br />
england and Wales summary of consumption of primary aggregates, by region 2001 (a)<br />
Region Land-won Marine Total Crushed rock<br />
Thousand tonnes<br />
Total<br />
Region<br />
sand and gravel<br />
Land-won<br />
sand and gravel<br />
Marine<br />
sand and gravel<br />
Total Crushed rock<br />
primary aggregate<br />
Total<br />
sand and gravel sand and gravel sand and gravel primary aggregate<br />
South West 5 604 659 6 263 19 140 25 404<br />
South East<br />
South LondonWest South East of East England<br />
London East Midlands<br />
East West of Midlands England<br />
East North Midlands West<br />
West Yorkshire Midlands and<br />
North the Humber West<br />
Yorkshire North Eastand the Humber<br />
12 488<br />
2 5 021 604<br />
12 13 488 404<br />
2 8 021 703<br />
13 9 404 564<br />
8 3 703 656<br />
9 564<br />
3 5 656 337<br />
1 826<br />
5 337<br />
7 036<br />
5 090 659<br />
7 036 153<br />
5 090 —<br />
1531 425 —<br />
1<br />
425 277<br />
982<br />
277<br />
19 524<br />
6 7 263 110<br />
13 19 557 524<br />
7 8 110 703<br />
13 9 557 564<br />
4 8 081 703<br />
9 564<br />
4 5 081 614<br />
2 808<br />
5 614<br />
14 603<br />
19 2 140 453<br />
14 5 603 680<br />
14 2 448 453<br />
10 5 475 680<br />
18 14 058 448<br />
10 475<br />
18 12 058 793<br />
7 392<br />
12 793<br />
34 127<br />
25 9 404 563<br />
34 19 127 237<br />
23 9 151 563<br />
19 20 237 039<br />
22 23 139 151<br />
20 039<br />
22 18 139 407<br />
10 201<br />
18 407<br />
North england East 62 1 602 826 14 622 982 77 2 225 808 105 7 042 392 182 10 267 201<br />
england South Wales 62 602 283 14 622 915 77 1 225 198 105 8 042 284 182 9 267 482<br />
North Wales<br />
South Wales<br />
909<br />
283<br />
68<br />
915<br />
977<br />
1 198<br />
3 663<br />
8 284<br />
4 640<br />
9 482<br />
North Wales Wales 1 191 909 983 68 2 175 977 11 3 947 663 14 4 122 640<br />
Wales england and Wales 63 1 794 191 15 606 983 79 2 399 175 116 11 990 947 (b) 196 14 389 122<br />
england and Wales<br />
(a) For aggregate use only.<br />
63 794 15 606 79 399 116 990 (b) 196 389<br />
Source: Collation of the Results of the 2001 Aggregate Minerals<br />
(b) The figure for total consumption slightly under estimates true<br />
(a) For consumption aggregate because use only. for some regions unallocated sales<br />
(b) The have figure an unknown for total destination. consumption Total slightly unallocated under estimates sales were true<br />
consumption (thousand tonnes): because sand for and some gravel: regions 643; unallocated crushed rock: sales 377.<br />
have an unknown destination. Total unallocated sales were<br />
(thousand tonnes): sand and gravel: 643; crushed rock: 377.<br />
Survey for England and Wales . British Geological Survey.<br />
Source: Collation of the Results of the 2001 Aggregate Minerals<br />
Survey for England and Wales . British Geological Survey.<br />
Permitted reserves of primary aggregate minerals in england and Wales<br />
Permitted for active and reserves inactive of primary sites at aggregate 31st December minerals 2001 in (a) england and Wales<br />
for active and inactive sites at 31st December 2001 (a)<br />
Region Sand and gravel Crushed rock<br />
Thousand tonnes Grand<br />
total<br />
Region Sand and gravel Crushed rock<br />
Grand<br />
Active Inactive: Inactive: Total Dormant Active Inactive: Inactive: Total Dormant total<br />
Active<br />
worked<br />
Inactive: in past<br />
worked<br />
yet to be<br />
Inactive: worked<br />
yet to be<br />
Total<br />
(b)<br />
Dormant<br />
(b)<br />
Active<br />
worked<br />
Inactive: in past<br />
worked<br />
yet to be<br />
Inactive: worked<br />
yet to be<br />
Total<br />
(b)<br />
Dormant<br />
(b)<br />
South West 39 028 in 5 past 248 worked 6 000 50 276 1 515 920 399 459 in past 965 worked 5 300 1 385 664 92 818 1 435 940<br />
South East<br />
South LondonWest East South of East England<br />
East London Midlands<br />
East West of Midlands England<br />
East North Midlands West<br />
West Yorkshire Midlands and<br />
North the Humber West<br />
Yorkshire North Eastand the Humber<br />
123 162<br />
39 3 028 185<br />
153 123 258 162<br />
79 3 179 185<br />
153 114 258 734<br />
79 55 179 348<br />
114 734<br />
55 45 348 100<br />
13 201<br />
45 100<br />
12 446<br />
5 248 —<br />
19 12 769 446<br />
10 538 —<br />
19 9 769 685<br />
10 1 538 113<br />
9 685<br />
1 5 113 780<br />
7 926<br />
5 780<br />
5 936<br />
6 000 —<br />
11 5 768 936<br />
9 030 —<br />
11 19 768 390<br />
9 1 030 315<br />
19 390<br />
1 315 —<br />
250<br />
—<br />
141 545<br />
50 3 276 185<br />
184 141 795 545<br />
98 3 747 185<br />
184 143 795 809<br />
98 57 747 776<br />
143 809<br />
57 50 776 880<br />
21 377<br />
50 880<br />
6 220<br />
1 515 —<br />
5 6 436 220<br />
8 415 —<br />
5 6 436 705<br />
8 415 —<br />
6 705<br />
—<br />
570<br />
—<br />
55 984<br />
920 399 —<br />
13 55 068 984<br />
1 979 616 —<br />
252 13 106 068<br />
1 979 337 616 090<br />
252 106<br />
337 438 090 197<br />
206 705<br />
438 197<br />
15 819<br />
459 965 —<br />
15 1 819 783<br />
184 173 —<br />
54 1 631 783<br />
184 8 173 869<br />
54 631<br />
32 8 315 869<br />
52 166<br />
32 315<br />
1 000<br />
5 300 —<br />
1 000 500<br />
2 000 —<br />
2 749 500<br />
2 000 256<br />
2 749<br />
2561 —<br />
1<br />
72 803<br />
1 385 664 —<br />
15 72 351 803<br />
2 165 789 —<br />
309 15 486 351<br />
2 165 346 789 215<br />
309 486<br />
346 470 215 513<br />
258 870<br />
470 513<br />
10 000<br />
92 818 —<br />
10 000 —<br />
171 463 —<br />
14 050 —<br />
171 463 —<br />
14 050<br />
22 955 —<br />
3 751<br />
22 955<br />
214 348<br />
1 435 3 940 185<br />
214 200 348 146<br />
2 264 3 536 185<br />
453 200 295 146<br />
2 264 403 536 991<br />
453 295<br />
521 403 393 991<br />
280 247<br />
521 393<br />
North england East 626 13 196 201 72 7 505 926 53 689 250 752 21 390 377 28 861 570 4 203 206 165 705 809 52 720 166 11 806 — 5 024 258 691 870 315 3 036 751 5 777 280 081 247<br />
england South Wales 626 6 196 806 72 505 845 53 689 — 752 7 390 651 28 861 — 4 203 465 165 724 809 181 720 553 11 806 400 5 024 647 691 677 315 38 036 210 5 777 655 081 328<br />
North Wales<br />
South Wales<br />
20 376<br />
6 806<br />
1 544<br />
845<br />
1 200<br />
—<br />
23 120<br />
7 651<br />
325<br />
—<br />
222 139<br />
465 724<br />
283 057<br />
181 553<br />
—<br />
400<br />
505 196<br />
647 677<br />
228 907<br />
38 210<br />
528 316<br />
655 328<br />
North Wales Wales 20 27 376 182 1 2 544 389 1 200 23 30 120 771 325 222 687 139 863 283 464 057 610 400 — 1 152 505 873 196 228 267 907 117 1 183 528 644 316<br />
Wales england & Wales 653 27 378 182 74 2 894 389 54 1 889 200 783 30 161 771 29 186 325 4 891 687 027 863 1 274 464 330 610 12 206 400 6 1 177 152 564 873 582 267 153 117 6 1 960 183 725 644<br />
england & Wales 653 378 74 894<br />
(a) For aggregate and non-aggregate use.<br />
54 889 783 161 29 186 4 891 027 1 274 330 12 206 6 177 564 582 153 6 960 725<br />
Source: Collation of the Results of the 2001 Aggregate Minerals<br />
(b) Reserves in 'dormant' sites are included in<br />
(a) For 'inactive aggregate sites worked and non-aggregate in the past'. use.<br />
(b) Reserves in 'dormant' sites are included in<br />
'inactive sites worked in the past'.<br />
Survey for England and Wales . British Geological Survey.<br />
Source: Collation of the Results of the 2001 Aggregate Minerals<br />
Survey for England and Wales . British Geological Survey.<br />
18<br />
Thousand tonnes<br />
Thousand tonnes


