nevada vital statistics 2001-2003 - Nevada State Health Division ...
nevada vital statistics 2001-2003 - Nevada State Health Division ...
nevada vital statistics 2001-2003 - Nevada State Health Division ...
You also want an ePaper? Increase the reach of your titles
YUMPU automatically turns print PDFs into web optimized ePapers that Google loves.
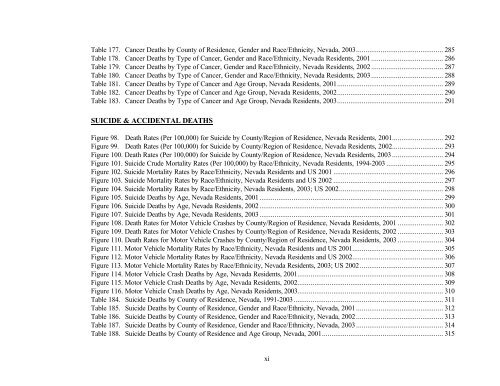
Table 177. Cancer Deaths by County of Residence, Gender and Race/Ethnicity, <strong>Nevada</strong>, <strong>2003</strong>.............................................. 285<br />
Table 178. Cancer Deaths by Type of Cancer, Gender and Race/Ethnicity, <strong>Nevada</strong> Residents, <strong>2001</strong> ...................................... 286<br />
Table 179. Cancer Deaths by Type of Cancer, Gender and Race/Ethnicity, <strong>Nevada</strong> Residents, 2002 ...................................... 287<br />
Table 180. Cancer Deaths by Type of Cancer, Gender and Race/Ethnicity, <strong>Nevada</strong> Residents, <strong>2003</strong> ...................................... 288<br />
Table 181. Cancer Deaths by Type of Cancer and Age Group, <strong>Nevada</strong> Residents, <strong>2001</strong>........................................................ 289<br />
Table 182. Cancer Deaths by Type of Cancer and Age Group, <strong>Nevada</strong> Residents, 2002........................................................ 290<br />
Table 183. Cancer Deaths by Type of Cancer and Age Group, <strong>Nevada</strong> Residents, <strong>2003</strong>........................................................ 291<br />
SUICIDE & ACCIDENTAL DEATHS<br />
Figure 98. Death Rates (Per 100,000) for Suicide by County/Region of Residence, <strong>Nevada</strong> Residents, <strong>2001</strong>........................... 292<br />
Figure 99. Death Rates (Per 100,000) for Suicide by County/Region of Residence, <strong>Nevada</strong> Residents, 2002........................... 293<br />
Figure 100. Death Rates (Per 100,000) for Suicide by County/Region of Residence, <strong>Nevada</strong> Residents, <strong>2003</strong> ........................... 294<br />
Figure 101. Suicide Crude Mortality Rates (Per 100,000) by Race/Ethnicity, <strong>Nevada</strong> Residents, 1994-<strong>2003</strong> .............................. 295<br />
Figure 102. Suicide Mortality Rates by Race/Ethnicity, <strong>Nevada</strong> Residents and US <strong>2001</strong> .......................................................... 296<br />
Figure 103. Suicide Mortality Rates by Race/Ethnicity, <strong>Nevada</strong> Residents and US 2002 .......................................................... 297<br />
Figure 104. Suicide Mortality Rates by Race/Ethnicity, <strong>Nevada</strong> Residents, <strong>2003</strong>; US 2002....................................................... 298<br />
Figure 105. Suicide Deaths by Age, <strong>Nevada</strong> Residents, <strong>2001</strong> ................................................................................................. 299<br />
Figure 106. Suicide Deaths by Age, <strong>Nevada</strong> Residents, 2002 ................................................................................................. 300<br />
Figure 107. Suicide Deaths by Age, <strong>Nevada</strong> Residents, <strong>2003</strong> ................................................................................................. 301<br />
Figure 108. Death Rates for Motor Vehicle Crashes by County/Region of Residence, <strong>Nevada</strong> Residents, <strong>2001</strong> ........................ 302<br />
Figure 109. Death Rates for Motor Vehicle Crashes by County/Region of Residence, <strong>Nevada</strong> Residents, 2002 ........................ 303<br />
Figure 110. Death Rates for Motor Vehicle Crashes by County/Region of Residence, <strong>Nevada</strong> Residents, <strong>2003</strong> ........................ 304<br />
Figure 111. Motor Vehicle Mortality Rates by Race/Ethnicity, <strong>Nevada</strong> Residents and US <strong>2001</strong>................................................ 305<br />
Figure 112. Motor Vehicle Mortality Rates by Race/Ethnicity, <strong>Nevada</strong> Residents and US 2002................................................ 306<br />
Figure 113. Motor Vehicle Mortality Rates by Race/Ethnicity, <strong>Nevada</strong> Residents, <strong>2003</strong>; US 2002............................................ 307<br />
Figure 114. Motor Vehicle Crash Deaths by Age, <strong>Nevada</strong> Residents, <strong>2001</strong>............................................................................. 308<br />
Figure 115. Motor Vehicle Crash Deaths by Age, <strong>Nevada</strong> Residents, 2002............................................................................. 309<br />
Figure 116. Motor Vehicle Crash Deaths by Age, <strong>Nevada</strong> Residents, <strong>2003</strong>............................................................................. 310<br />
Table 184. Suicide Deaths by County of Residence, <strong>Nevada</strong>, 1991-<strong>2003</strong>............................................................................... 311<br />
Table 185. Suicide Deaths by County of Residence, Gender and Race/Ethnicity, <strong>Nevada</strong>, <strong>2001</strong> .............................................. 312<br />
Table 186. Suicide Deaths by County of Residence, Gender and Race/Ethnicity, <strong>Nevada</strong>, 2002.............................................. 313<br />
Table 187. Suicide Deaths by County of Residence, Gender and Race/Ethnicity, <strong>Nevada</strong>, <strong>2003</strong> .............................................. 314<br />
Table 188. Suicide Deaths by County of Residence and Age Group, <strong>Nevada</strong>, <strong>2001</strong>................................................................ 315<br />
xi


