nevada vital statistics 2001-2003 - Nevada State Health Division ...
nevada vital statistics 2001-2003 - Nevada State Health Division ...
nevada vital statistics 2001-2003 - Nevada State Health Division ...
You also want an ePaper? Increase the reach of your titles
YUMPU automatically turns print PDFs into web optimized ePapers that Google loves.
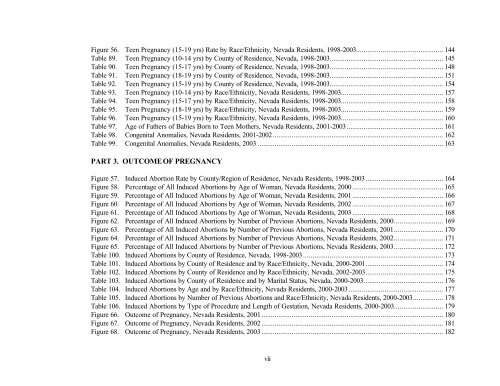
Figure 56. Teen Pregnancy (15-19 yrs) Rate by Race/Ethnicity, <strong>Nevada</strong> Residents, 1998-<strong>2003</strong>.............................................. 144<br />
Table 89. Teen Pregnancy (10-14 yrs) by County of Residence, <strong>Nevada</strong>, 1998-<strong>2003</strong>............................................................ 145<br />
Table 90. Teen Pregnancy (15-17 yrs) by County of Residence, <strong>Nevada</strong>, 1998-<strong>2003</strong>............................................................ 148<br />
Table 91. Teen Pregnancy (18-19 yrs) by County of Residence, <strong>Nevada</strong>, 1998-<strong>2003</strong>............................................................ 151<br />
Table 92. Teen Pregnancy (15-19 yrs) by County of Residence, <strong>Nevada</strong>, 1998-<strong>2003</strong>............................................................ 154<br />
Table 93. Teen Pregnancy (10-14 yrs) by Race/Ethnicity, <strong>Nevada</strong> Residents, 1998-<strong>2003</strong>...................................................... 157<br />
Table 94. Teen Pregnancy (15-17 yrs) by Race/Ethnicity, <strong>Nevada</strong> Residents, 1998-<strong>2003</strong>...................................................... 158<br />
Table 95. Teen Pregnancy (18-19 yrs) by Race/Ethnicity, <strong>Nevada</strong> Residents, 1998-<strong>2003</strong>...................................................... 159<br />
Table 96. Teen Pregnancy (15-19 yrs) by Race/Ethnicity, <strong>Nevada</strong> Residents, 1998-<strong>2003</strong>...................................................... 160<br />
Table 97. Age of Fathers of Babies Born to Teen Mothers, <strong>Nevada</strong> Residents, <strong>2001</strong>-<strong>2003</strong>................................................... 161<br />
Table 98. Congenital Anomalies, <strong>Nevada</strong> Residents, <strong>2001</strong>-2002.......................................................................................... 162<br />
Table 99. Congenital Anomalies, <strong>Nevada</strong> Residents, <strong>2003</strong> .................................................................................................. 163<br />
PART 3. OUTCOME OF PREGNANCY<br />
Figure 57. Induced Abortion Rate by County/Region of Residence, <strong>Nevada</strong> Residents, 1998-<strong>2003</strong>......................................... 164<br />
Figure 58. Percentage of All Induced Abortions by Age of Woman, <strong>Nevada</strong> Residents, 2000 ................................................ 165<br />
Figure 59. Percentage of All Induced Abortions by Age of Woman, <strong>Nevada</strong> Residents, <strong>2001</strong> ................................................ 166<br />
Figure 60. Percentage of All Induced Abortions by Age of Woman, <strong>Nevada</strong> Residents, 2002 ................................................ 167<br />
Figure 61. Percentage of All Induced Abortions by Age of Woman, <strong>Nevada</strong> Residents, <strong>2003</strong> ................................................ 168<br />
Figure 62. Percentage of All Induced Abortions by Number of Previous Abortions, <strong>Nevada</strong> Residents, 2000.......................... 169<br />
Figure 63. Percentage of All Induced Abortions by Number of Previous Abortions, <strong>Nevada</strong> Residents, <strong>2001</strong>.......................... 170<br />
Figure 64. Percentage of All Induced Abortions by Number of Previous Abortions, <strong>Nevada</strong> Residents, 2002.......................... 171<br />
Figure 65. Percentage of All Induced Abortions by Number of Previous Abortions, <strong>Nevada</strong> Residents, <strong>2003</strong>.......................... 172<br />
Table 100. Induced Abortions by County of Residence, <strong>Nevada</strong>, 1998-<strong>2003</strong>.......................................................................... 173<br />
Table 101. Induced Abortions by County of Residence and by Race/Ethnicity, <strong>Nevada</strong>, 2000-<strong>2001</strong>......................................... 174<br />
Table 102. Induced Abortions by County of Residence and by Race/Ethnicity, <strong>Nevada</strong>, 2002-<strong>2003</strong>......................................... 175<br />
Table 103. Induced Abortions by County of Residence and by Marital Status, <strong>Nevada</strong>, 2000-<strong>2003</strong>.......................................... 176<br />
Table 104. Induced Abortions by Age and by Race/Ethnicity, <strong>Nevada</strong> Residents, 2000-<strong>2003</strong>.................................................. 177<br />
Table 105. Induced Abortions by Number of Previous Abortions and Race/Ethnicity, <strong>Nevada</strong> Residents, 2000-<strong>2003</strong>................ 178<br />
Table 106. Induced Abortions by Type of Procedure and Length of Gestation, <strong>Nevada</strong> Residents, 2000-<strong>2003</strong>.......................... 179<br />
Figure 66. Outcome of Pregnancy, <strong>Nevada</strong> Residents, <strong>2001</strong>................................................................................................ 180<br />
Figure 67. Outcome of Pregnancy, <strong>Nevada</strong> Residents, 2002 ................................................................................................ 181<br />
Figure 68. Outcome of Pregnancy, <strong>Nevada</strong> Residents, <strong>2003</strong> ................................................................................................ 182<br />
vii


