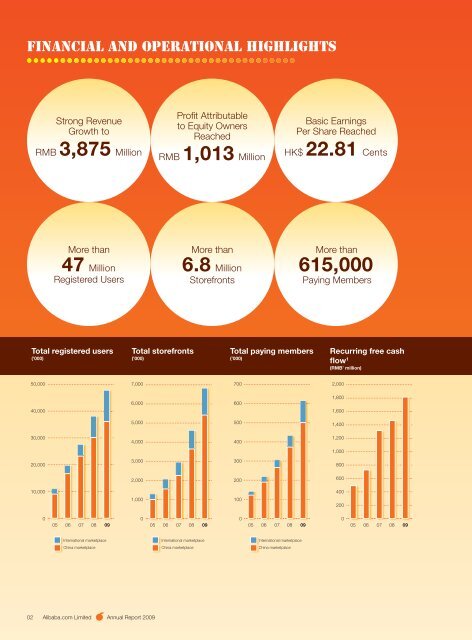
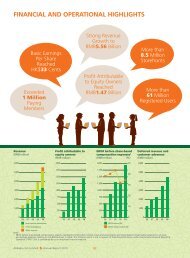
Financial and Operational Highlights Strong Revenue Growth to RMB 3,875 Million 02 <strong>Alibaba</strong>.com Limited <strong>Annual</strong> <strong>Report</strong> <strong>2009</strong> Profi t Attributable to Equity Owners Reached RMB 1,013 Million More than 47 Million More than Registered Users Storefronts Total registered users (’000) 50,000 40,000 30,000 20,000 10,000 0 International marketplace China marketplace Total storefronts (’000) 7,000 6,000 5,000 4,000 3,000 2,000 1,000 Basic Earnings Per Share Reached HK$ 22.81 Cents More than 6.8 Million 615,000 Total paying members (’000) Paying Members Recurring free cash fl ow 1 (RMB’ million) 0 0 0 05 06 07 08 09 05 06 07 08 09 05 06 07 08 09 05 06 07 08 09 International marketplace China marketplace 700 600 500 400 300 200 100 International I marketplace China C marketplace 2,000 1,800 1,600 1,400 1,200 1,000 800 600 400 200
Financial Highlights <strong>2009</strong> 2008 Change RMB million RMB million (Restated) 2 Revenue 3,874.7 3,004.1 +29% Profi t from operations 1,073.0 1,141.7 –6% Profi t attributable to equity owners 1,013.0 1,154.5 –12% Share-based compensation expense 200.4 182.0 +10% Deferred revenue and customer advances 3,437.0 2,294.4 +50% Recurring free cash fl ow 1,816.2 1,465.9 +24% Earnings per share, basic (HK$) 22.81 cents 25.61 cents -11% Earnings per share, diluted (HK$) 22.63 cents 25.58 cents -12% Operational Highlights <strong>2009</strong> 2008 Change Registered users 47,732,916 38,075,335 +25% International marketplace 11,578,247 7,914,630 +46% China marketplace 36,154,669 30,160,705 +20% Storefronts 6,819,984 4,614,250 +48% International marketplace 1,400,326 965,747 +45% China marketplace 5,419,658 3,648,503 +49% Paying members 615,212 432,031 +42% China Gold Supplier 96,110 43,028 +123% Global Gold Supplier 17,786 16,136 +10% China TrustPass 501,316 372,867 +34% Note: Revenue (RMB’ million) 4,000 3,500 3,000 2,500 2,000 1,500 1,000 500 0 International I marketplace China C marketplace Profi t attributable to equity owners (RMB’ million) 1,400 1,200 1,000 800 600 400 200 Recurring operating profi t 3 (RMB’ million) Recurring operating profi t margin Recurring R operating profi t (%) Deferred revenue and customer advances 4 (RMB’ million) 0 0 0 0 05 06 07 08 09 05 06 07 08 09 05 06 07 08 09 05 06 07 08 09 1 Recurring free cash fl ow represents net cash fl ow generated from operating activities as presented in our consolidated cash fl ow statement less purchase of property and equipment and excludes non-recurring payments and receipts, like one-off tax refund in <strong>2009</strong>. This fi nancial metric is not a measure of fi nancial performance under International Financial <strong>Report</strong>ing Standards (“IFRS”), but we consider it an important fi nancial measure. 2 Certain comparative fi gures have been restated pursuant to the business combination under common control upon acquisition of the business management software division of Alisoft. 3 Recurring operating profi t represents profi t from operations as presented in our consolidated income statement excluding share-based compensation expense and one-off income and expenditures for all years, such as expenses relating to non-B2B business in 2005 and 2006. This fi nancial metric is not a measure of fi nancial performance under IFRS, but we consider it an important fi nancial measure. 4 Deferred revenue and customer advances exclude amounts arising from the acquisition of equity interests in HiChina. 1,500 1,200 900 600 300 50 40 30 20 10 3,500 3,000 2,500 2,000 1,500 1,000 500 03