Section 7. MOS Memory Market Trends - Smithsonian: The Chip ...
Section 7. MOS Memory Market Trends - Smithsonian: The Chip ...
Section 7. MOS Memory Market Trends - Smithsonian: The Chip ...

You also want an ePaper? Increase the reach of your titles
YUMPU automatically turns print PDFs into web optimized ePapers that Google loves.
7 <strong>MOS</strong> MEMORY MARKET TRENDS<br />
OVERVIEW<br />
<strong>The</strong> <strong>MOS</strong> memory market consists of DRAM, SRAM, ROM, EPROM, EEPROM, and flash memory<br />
products. Following the overview, each segment of the <strong>MOS</strong> memory market will be discussed<br />
in greater detail.<br />
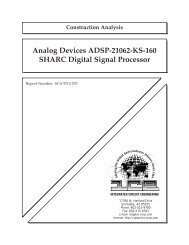
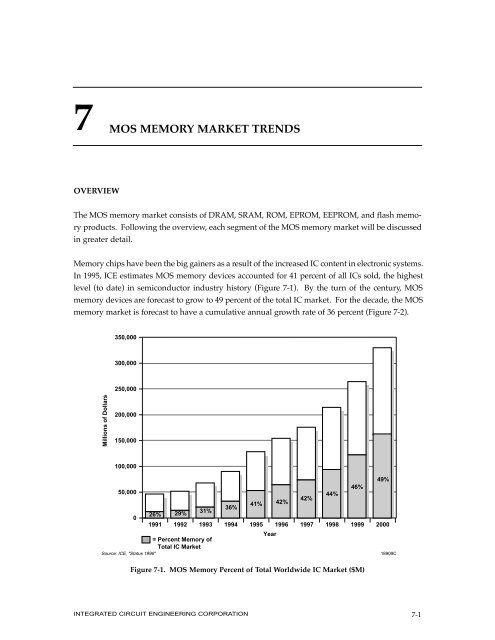
<strong>Memory</strong> chips have been the big gainers as a result of the increased IC content in electronic systems.<br />
In 1995, ICE estimates <strong>MOS</strong> memory devices accounted for 41 percent of all ICs sold, the highest<br />
level (to date) in semiconductor industry history (Figure 7-1). By the turn of the century, <strong>MOS</strong><br />
memory devices are forecast to grow to 49 percent of the total IC market. For the decade, the <strong>MOS</strong><br />
memory market is forecast to have a cumulative annual growth rate of 36 percent (Figure 7-2).<br />
Millions of Dollars<br />
350,000<br />
300,000<br />
250,000<br />
200,000<br />
150,000<br />
100,000<br />
50,000<br />
0<br />
26%<br />
1991<br />
29%<br />
1992<br />
31%<br />
1993<br />
= Percent <strong>Memory</strong> of<br />
Total IC <strong>Market</strong><br />
Source: ICE, "Status 1996"<br />
36%<br />
1994<br />
INTEGRATED CIRCUIT ENGINEERING CORPORATION 7-1<br />
41%<br />
1995<br />
Year<br />
42%<br />
1996<br />
42%<br />
1997<br />
44%<br />
1998<br />
46%<br />
1999<br />
Figure 7-1. <strong>MOS</strong> <strong>Memory</strong> Percent of Total Worldwide IC <strong>Market</strong> ($M)<br />
49%<br />
2000<br />
18909C
<strong>MOS</strong> <strong>Memory</strong> <strong>Market</strong> <strong>Trends</strong><br />
Figure 7-3 shows ICE’s forecast of the specific <strong>MOS</strong> memory market segments through the year<br />
2000. Following three straight years (1993-1995) of better than 40 percent growth, the <strong>MOS</strong> memory<br />
market is forecast to catch its breath in 1996 and 199<strong>7.</strong> It is anticipated that the slower growth<br />
rate will be the result of additional capacity (especially for DRAMs) that is forecast to come on line<br />
in the late-1996/early-1997 time period. Additional capacity will help fill demand for DRAMs<br />
and other memory products, thus reducing average selling prices and causing the market to grow<br />
more slowly than the during the first half of the decade.<br />
7-2<br />
Millions of Dollars<br />
180,000<br />
160,000<br />
140,000<br />
120,000<br />
100,000<br />
80,000<br />
60,000<br />
40,000<br />
20,000<br />
0<br />
1991<br />
Source: ICE, "Status 1996"<br />
1992<br />
WW IC ($M)<br />
WW <strong>MOS</strong> <strong>Memory</strong> <strong>Market</strong> ($M)<br />
WW <strong>Memory</strong> Percent Change<br />
Percent <strong>Memory</strong> of Total IC<br />
DRAM ($M)<br />
SRAM ($M)<br />
EPROM ($M)<br />
Flash ($M)<br />
ROM ($M)<br />
EEPROM ($M)<br />
Other <strong>Memory</strong><br />
Source: ICE, "Status 1996"<br />
1993<br />
1994<br />
1995<br />
Year<br />
CAGR = 36%<br />
1996<br />
1997<br />
1998<br />
Figure 7-2. 1991-2000 <strong>MOS</strong> <strong>Memory</strong> <strong>Market</strong> CAGR<br />
90,305<br />
32,455<br />
55%<br />
36%<br />
23,420<br />
3,755<br />
1,390<br />
865<br />
1,890<br />
720<br />
415<br />
128,493<br />
53,225<br />
64%<br />
41%<br />
40,700<br />
6,000<br />
1,365<br />
1,800<br />
2,010<br />
885<br />
465<br />
154,434<br />
64,415<br />
21%<br />
42%<br />
50,075<br />
7,200<br />
1,240<br />
2,300<br />
2,050<br />
1,020<br />
530<br />
175,853<br />
73,745<br />
14%<br />
42%<br />
57,715<br />
8,435<br />
1,120<br />
2,830<br />
1,980<br />
1,090<br />
575<br />
214,382<br />
93,950<br />
27%<br />
44%<br />
75,265<br />
10,280<br />
1,035<br />
3,535<br />
1,960<br />
1,235<br />
640<br />
1999<br />
1994 1995 1996 1997 1998 1999<br />
Figure 7-3. <strong>MOS</strong> <strong>Memory</strong> <strong>Market</strong> Forecast<br />
2000<br />
18903B<br />
264,291<br />
122,325<br />
30%<br />
46%<br />
100,595<br />
12,235<br />
935<br />
4,500<br />
1,925<br />
1,420<br />
715<br />
2000<br />
331,866<br />
162,875<br />
33%<br />
49%<br />
136,780<br />
15,050<br />
845<br />
5,800<br />
1,875<br />
1,700<br />
825<br />
18914D<br />
INTEGRATED CIRCUIT ENGINEERING CORPORATION
<strong>MOS</strong> <strong>Memory</strong> <strong>Market</strong> <strong>Trends</strong><br />
Any “cooling off” period, ICE believes, will be short lived. With lower ASPs, consumers will<br />
begin to upgrade their computer systems with affordable memory. Those who long waited for<br />
lower prices before upgrading will likely jump at the chance to buy more memory, creating inflated<br />
demand and a return to a supply shortage.<br />
DRAMs make up the majority of <strong>MOS</strong> memory sales and are forecast to be the dominant memory<br />
product through the year 2000 (Figure 7-4). ICE forecasts that in the year 2000, 84 percent of<br />
the <strong>MOS</strong> memory market will be attributed to DRAM sales, up from 77 percent in 1995. Strong<br />
software, PC, and electronic equipment sales will provide the impetus necessary to take DRAM<br />
sales to a new level.<br />
DRAM<br />
SRAM<br />
ROM<br />
EPROM<br />
EEPROM<br />
FLASH<br />
OTHER<br />
TOTAL:<br />
DRAM<br />
SRAM<br />
ROM<br />
EPROM<br />
EEPROM<br />
FLASH<br />
OTHER<br />
TOTAL:<br />
1997<br />
–<br />
–<br />
–<br />
–<br />
–<br />
–<br />
–<br />
–<br />
–<br />
–<br />
–<br />
–<br />
–<br />
–<br />
72%<br />
12%<br />
6%<br />
4%<br />
2%<br />
3%<br />
1%<br />
$32.5B<br />
78%<br />
11%<br />
3%<br />
2%<br />
1%<br />
4%<br />
1%<br />
$73.7B<br />
Source: ICE, "Status 1996"<br />
DRAM<br />
SRAM<br />
ROM<br />
EPROM<br />
EEPROM<br />
FLASH<br />
OTHER<br />
TOTAL:<br />
DRAM<br />
SRAM<br />
ROM<br />
EPROM<br />
EEPROM<br />
FLASH<br />
OTHER<br />
TOTAL:<br />
1998<br />
–<br />
–<br />
–<br />
–<br />
–<br />
–<br />
–<br />
80%<br />
11%<br />
2%<br />
1%<br />
1%<br />
4%<br />
1%<br />
$94.0B<br />
1995<br />
–<br />
–<br />
–<br />
–<br />
–<br />
–<br />
–<br />
77%<br />
11%<br />
4%<br />
2%<br />
2%<br />
3%<br />
1%<br />
1994 1996<br />
$53.2B<br />
DRAM<br />
SRAM<br />
ROM<br />
EPROM<br />
EEPROM<br />
FLASH<br />
OTHER<br />
TOTAL:<br />
DRAM<br />
SRAM<br />
ROM<br />
EPROM<br />
EEPROM<br />
FLASH<br />
OTHER<br />
TOTAL:<br />
<strong>MOS</strong> memory consumption was again headed by the North American region (Figure 7-5). ICE<br />
estimates that North America consumed 36 percent of all <strong>MOS</strong> memory products in 1995, down<br />
slightly from 1994.<br />
INTEGRATED CIRCUIT ENGINEERING CORPORATION 7-3<br />
1999<br />
–<br />
–<br />
–<br />
–<br />
–<br />
–<br />
–<br />
82%<br />
10%<br />
1%<br />
1%<br />
1%<br />
4%<br />
1%<br />
$122.3B<br />
Figure 7-4. <strong>MOS</strong> <strong>Memory</strong> Product <strong>Market</strong>share<br />
–<br />
–<br />
–<br />
–<br />
–<br />
–<br />
–<br />
78%<br />
11%<br />
3%<br />
2%<br />
2%<br />
3%<br />
1%<br />
$64.4B<br />
DRAM<br />
SRAM<br />
ROM<br />
EPROM<br />
EEPROM<br />
FLASH<br />
OTHER<br />
TOTAL:<br />
2000<br />
–<br />
–<br />
–<br />
–<br />
–<br />
–<br />
–<br />
84%<br />
9%<br />
1%<br />
1%<br />
1%<br />
4%<br />
<strong>MOS</strong> <strong>Memory</strong> <strong>Market</strong> <strong>Trends</strong><br />
Figure 7-6 leaves no doubt that the Japanese companies are responsible for the greatest amount of<br />
<strong>MOS</strong> memory production. However, the figure also points out how quickly regional production<br />
can increase or decrease from one year to the next. Between 1993 and 1995, for instance, ICE estimates<br />
that Japan’s share of <strong>MOS</strong> memory production decreased 10 percentage points, while the<br />
ROW region increased 10 points. Apparently, no marketshare lead is safe in the IC industry, even<br />
in a market that seemed solidly in the grasp of the Japanese.<br />
<strong>MOS</strong> memory production by region for each memory segment is shown in Figure 7-<strong>7.</strong> Japanese<br />
firms supplied the largest amount of DRAMs, SRAMs, and ROMs—the largest memory market<br />
segments. ROW companies gained additional marketshare in several segments during 1995.<br />
Surprisingly, North American companies actually gained marketshare in the DRAM segment<br />
while making their presence known in the EPROM, EEPROM, and rising flash memory markets.<br />
SGS-Thomson, the world’s leading EPROM manufacturer was the source of Europe’s strong<br />
showing in the EPROM market and also a significant contributor to the EEPROM market.<br />
Listed in Figure 7-8 are sales estimates for the top five worldwide <strong>MOS</strong> memory suppliers in 1995.<br />
Together the five firms accounted for half of <strong>MOS</strong> memory sales during the year. ICE shows that<br />
Samsung continued as the leading supplier of <strong>MOS</strong> memory devices in 1995. Fueled by strong<br />
7-4<br />
ROW<br />
19%<br />
Europe<br />
18%<br />
Source: ICE, "Status 1996"<br />
North American<br />
Companies<br />
20%<br />
ROW<br />
Companies<br />
23%<br />
Source: ICE, "Status 1996"<br />
1994<br />
$32.5B<br />
Japan<br />
26%<br />
North America<br />
37%<br />
ROW<br />
22%<br />
Europe<br />
18% North America<br />
36%<br />
1995 (EST)<br />
$53.2B<br />
Japan<br />
24%<br />
Figure 7-5. <strong>MOS</strong> <strong>Memory</strong> Consumption by Region<br />
European<br />
Companies<br />
4%<br />
1994<br />
$32.5B<br />
Japanes<br />
Companies<br />
53%<br />
North American<br />
Companies<br />
21%<br />
European<br />
Companies<br />
4%<br />
Figure 7-6. <strong>MOS</strong> <strong>Memory</strong> Production<br />
1995 (EST)<br />
$53.2B<br />
ROW<br />
Companies<br />
29%<br />
18912E<br />
Japanese<br />
Companies<br />
46%<br />
20173A<br />
INTEGRATED CIRCUIT ENGINEERING CORPORATION
<strong>MOS</strong> <strong>Memory</strong> <strong>Market</strong> <strong>Trends</strong><br />
DRAM demand, its <strong>MOS</strong> memory sales increased well beyond its 1994 level. <strong>The</strong> strong DRAM<br />
market allowed another Korean supplier,LG Semicon, to join the top-five list. NEC, Hitachi, and<br />
Toshiba were lumped together at the number two, three, and four positions.<br />
Percentage<br />
100<br />
80<br />
60<br />
40<br />
20<br />
0<br />
15%<br />
49%<br />
<br />
<br />
<br />
<br />
<br />
<br />
<br />
<br />
<br />
<br />
<br />
<br />
<br />
3%<br />
DRAM<br />
$40,700M<br />
Source: ICE, "Status 1996"<br />
33%<br />
30%<br />
<br />
<br />
Rank<br />
1<br />
2<br />
3<br />
4<br />
5<br />
Other<br />
Total<br />
47%<br />
20%<br />
<br />
<br />
<br />
<br />
<br />
<br />
<br />
<br />
3%<br />
SRAM<br />
$6,000M<br />
<br />
<br />
75%<br />
2% 1%<br />
ROM<br />
$2,010M<br />
North American<br />
Companies<br />
European<br />
Companies<br />
22%<br />
<br />
<br />
<br />
<br />
<br />
<br />
<br />
<br />
<br />
<br />
<br />
<br />
<br />
<br />
<br />
INTEGRATED CIRCUIT ENGINEERING CORPORATION 7-5<br />
53%<br />
9%<br />
29%<br />
EPROM<br />
$1,365M<br />
9%<br />
<br />
<br />
<br />
<br />
66%<br />
7%<br />
26%<br />
EEPROM<br />
$885M<br />
Japanese<br />
Companies<br />
ROW<br />
Companies<br />
Figure 7-<strong>7.</strong> 1995 <strong>MOS</strong> <strong>Memory</strong> Production by Segment ($M)<br />
Company<br />
Samsung<br />
NEC<br />
Toshiba<br />
Hitachi<br />
Mitsubishi<br />
—<br />
—<br />
Source: ICE, "Status 1996"<br />
1994<br />
Sales<br />
($M)<br />
4,060<br />
3,440<br />
3,400<br />
3,150<br />
1,830<br />
16,575<br />
32,455<br />
<strong>Market</strong>share<br />
(%)<br />
12<br />
11<br />
10<br />
10<br />
6<br />
51<br />
100<br />
Company<br />
Samsung<br />
NEC<br />
Hitachi<br />
Toshiba<br />
LG Semicon<br />
1995 (EST)<br />
Sales<br />
($M)<br />
7,545<br />
5,630<br />
5,560<br />
4,535<br />
3,165<br />
26,790<br />
53,225<br />
Figure 7-8. Total <strong>MOS</strong> <strong>Memory</strong> <strong>Market</strong> Leaders<br />
—<br />
—<br />
1%<br />
<br />
<br />
14<br />
11<br />
10<br />
9<br />
6<br />
50<br />
100<br />
85%<br />
<strong>Market</strong>share<br />
(%)<br />
14495N<br />
8%<br />
5%<br />
Flash<br />
$1,800M<br />
2%<br />
<br />
<br />
14516N
<strong>MOS</strong> <strong>Memory</strong> <strong>Market</strong> <strong>Trends</strong><br />
ROMs<br />
ROMs represent the least expensive type of semiconductor memory. <strong>The</strong>y are used primarily for<br />
storing data for electronic equipment such as fonts for laser printers, dictionary data in word<br />
processors, and sound-source data in electronic musical instruments. ROMs are also used extensively<br />
in video game software. A six-year quarterly history of the ROM market, including dollar<br />
volume, units, and ASP, is displayed in Figure 7-9. <strong>The</strong> surge in the ROM market beginning in<br />
1993 closely coincided with a jump in PC sales and other consumer-oriented electronic systems.<br />
ICE believes the ROM market will show only one more year of growth before it starts to dwindle<br />
in size through the remainder of the decade (Figure 7-10). <strong>The</strong> main reason for the decline is that<br />
the biggest market for mask ROMs—video games—is moving toward CD-ROM-based machines.<br />
<strong>The</strong> result is a mask ROM market that will likely begin a sales downturn in 199<strong>7.</strong><br />
Despite the fact that high-performance game applications for ROMs may be dwindling, demand<br />
for the high-density versions has increased. Sharp added 3V versions to its high-density line, and<br />
in 2H95, began volume production of its 64M ROM device.<br />
Sharp also introduced a novel memory device that combines ROM and RAM on one chip. A customer<br />
can choose on a page-by-page basis whether the page should be RAM or ROM, solving<br />
memory mapping headaches for small, handheld systems.<br />
7-6<br />
Billings in Millions<br />
650<br />
600<br />
550<br />
500<br />
450<br />
400<br />
350<br />
300<br />
250<br />
200<br />
150<br />
100<br />
50<br />
0<br />
219<br />
$2.85<br />
77<br />
Source: ICE, "Status 1996"<br />
Dollar Volume<br />
1Q 2Q 3Q 4Q 1Q 2Q 3Q 4Q 1Q 2Q 3Q 4Q 1Q 2Q 3Q 4Q 1Q 2Q 3Q 4Q 1Q 2Q 3Q 4Q<br />
(EST)<br />
1990 1991 1992<br />
ASP<br />
Year<br />
Figure 7-9. 1990-1995 ROM <strong>Market</strong><br />
Unit Volume<br />
1993 1994 1995<br />
$5.06<br />
607<br />
120<br />
5.20<br />
5.00<br />
4.80<br />
4.60<br />
4.40<br />
4.20<br />
4.00<br />
3.80<br />
3.60<br />
3.40<br />
3.20<br />
3.00<br />
2.80<br />
2.60<br />
2.40<br />
17854G<br />
INTEGRATED CIRCUIT ENGINEERING CORPORATION<br />
ASP ($)
Millions of Dollars<br />
2,100<br />
2,000<br />
1,900<br />
1,800<br />
1,700<br />
1,600<br />
1,500<br />
1,400<br />
1,300<br />
1,200<br />
1,100<br />
1,000<br />
Percent<br />
Change<br />
1991<br />
Source: ICE, "Status 1996"<br />
<strong>MOS</strong> <strong>Memory</strong> <strong>Market</strong> <strong>Trends</strong><br />
1992 1993 1994 1995<br />
Year<br />
1996 1997 1998 1999 2000<br />
16% 33% 16% 6% 2% –3% –1% –2% –3%<br />
Figure 7-10. ROM <strong>Market</strong> to Fizzle<br />
Another interesting ROM development targeting the multimedia market is the Record-On-Silicon<br />
(ROS) device from Siemens. With a 50-percent reduction in die area compared with conventional<br />
ROM, the company claims the ROS could halve the cost of conventional ROM and push into<br />
markets for non-semiconductor storage, such as compact disks and photographic film. Few<br />
details of the technology are available now, but a 64M version of the device will be introduced in<br />
199<strong>7.</strong><br />
In the ROM market, Japanese IC makers continued to hold a dominant position (Figure 7-11).<br />
Sharp and NEC held the largest shares of the ROM market in 1995. However, not all Japanese IC<br />
vendors are staying in the ROM business. Fujitsu announced its intentions to withdraw from the<br />
mask ROM business. It plans to cancel development efforts for 32M and other next-generation<br />
units, and, in 1996, will stop producing and shipping its current line of 16M and smaller products.<br />
<strong>The</strong> ROM market by geographic region is shown in Figure 7-12. <strong>The</strong> ROW region, where numerous<br />
ROM-intensive electronic games are manufactured, greatly increased its share of the ROM<br />
market in 1995.<br />
INTEGRATED CIRCUIT ENGINEERING CORPORATION 7-7<br />
20348A
<strong>MOS</strong> <strong>Memory</strong> <strong>Market</strong> <strong>Trends</strong><br />
<strong>Market</strong> demand for ROMs is slowly migrating toward higher densities (Figure 7-13). Most ROM<br />
manufacturers elected to keep their ROM production at the 4M level. However, UMC in Taiwan,<br />
Sharp in Japan, and Samsung in Korea intend to develop mask ROMs beyond the 32M<br />
density.<br />
EPROMs<br />
EPROMs (electrically programmable read only memory) have long been the cornerstone of the<br />
non-volatile memory market. Created in the 1970’s with Intel’s invention of the UV-erasable<br />
PROM, these devices have since been produced in an assortment of part types with varying<br />
speeds and densities. <strong>The</strong>y are used in numerous applications and have been a favorite for their<br />
versatility. However, EPROMs’ stronghold has been tested in recent years with the emergence of<br />
other non-volatile memory products, specifically flash memory.<br />
7-8<br />
Rank<br />
1<br />
2<br />
3<br />
4<br />
5<br />
Other<br />
Total<br />
Company<br />
Sharp<br />
NEC<br />
Samsung<br />
Toshiba<br />
Hitachi<br />
—<br />
—<br />
Source: ICE, "Status 1996"<br />
Europe<br />
2%<br />
Source: ICE, "Status 1996"<br />
Japan<br />
74%<br />
1994<br />
$1,890M<br />
North<br />
America<br />
13%<br />
1994 1995 (EST)<br />
Sales<br />
($M)<br />
470<br />
380<br />
292<br />
240<br />
230<br />
278<br />
1,890<br />
<strong>Market</strong>share<br />
(%)<br />
25<br />
20<br />
15<br />
13<br />
12<br />
15<br />
100<br />
Company<br />
Sharp<br />
NEC<br />
Toshiba<br />
Hitachi<br />
Samsung<br />
—<br />
—<br />
Figure 7-11. ROM <strong>Market</strong> Leaders<br />
ROW<br />
11%<br />
Europe<br />
3%<br />
Figure 7-12. ROM <strong>Market</strong> by Region<br />
Sales<br />
($M)<br />
500<br />
400<br />
255<br />
245<br />
230<br />
380<br />
2,010<br />
Japan<br />
59%<br />
1995 (EST)<br />
$2,010M<br />
<strong>Market</strong>share<br />
(%)<br />
ROW<br />
21%<br />
14496N<br />
INTEGRATED CIRCUIT ENGINEERING CORPORATION<br />
25<br />
20<br />
13<br />
12<br />
11<br />
19<br />
100<br />
North<br />
America<br />
17%<br />
16790J
40<br />
30<br />
20<br />
10<br />
0<br />
24%<br />
Source: ICE, "Status 1996"<br />
31%<br />
18%<br />
27%<br />
≤2M 4M 8M >8M<br />
≤2M 4M 8M >8M<br />
<strong>MOS</strong> <strong>Memory</strong> <strong>Market</strong> <strong>Trends</strong><br />
<strong>The</strong> recent history of the EPROM market, including unit shipments and ASPs, is shown in Figure<br />
7-14. Dollar volume remained reasonably steady until 1994 when the impact of flash memory was<br />
felt. However, high initial prices and lack of supply in the flash market allowed the EPROM market<br />
to rebound late in 1994 and into 1995.<br />
Billings in Millions<br />
450<br />
400<br />
350<br />
300<br />
250<br />
200<br />
150<br />
100<br />
50<br />
0<br />
1Q<br />
378<br />
<strong>Market</strong>share Percent<br />
$3.35<br />
2Q<br />
Source: ICE, "Status 1996"<br />
3Q<br />
4Q<br />
1994<br />
$1,890M<br />
INTEGRATED CIRCUIT ENGINEERING CORPORATION 7-9<br />
22%<br />
31%<br />
19%<br />
1995 (EST)<br />
$2,010M<br />
Figure 7-13. ROM Unit Shipments by Density<br />
1Q<br />
2Q<br />
3Q<br />
1991 1992<br />
Dollar Volume<br />
ASP<br />
4Q<br />
1Q<br />
2Q<br />
3Q<br />
4Q<br />
1Q<br />
2Q<br />
3Q<br />
28%<br />
4Q<br />
18915D<br />
Unit Volume<br />
113 110<br />
1Q<br />
2Q<br />
1993<br />
Year<br />
1994 1995<br />
Figure 7-14. 1991-1995 EPROM <strong>Market</strong><br />
314<br />
$2.85<br />
3Q 4Q<br />
(EST)<br />
4.00<br />
3.80<br />
3.60<br />
3.40<br />
3.20<br />
3.00<br />
2.80<br />
2.60<br />
2.40<br />
2.20<br />
2.00<br />
ASP ($)<br />
17853G
<strong>MOS</strong> <strong>Memory</strong> <strong>Market</strong> <strong>Trends</strong><br />
ICE believes that the EPROM sales peaked in 1994 and have now started to track a slow market<br />
decline through the end of the decade (Figure 7-15). <strong>The</strong> decline comes as many long-time<br />
EPROM suppliers, evaluating their capacity allocations, have chosen to produce devices with<br />
higher profit margins.<br />
<strong>The</strong> year 1999 should be the first (since its initial market days) that the EPROM market fails to<br />
reach the $1 billion level. Still, even though it is forecast to decline, a roughly one-billion dollar<br />
market is quite sizable. As will be mentioned later, while numerous competitors have lessened<br />
their commitments to the EPROM market, others have increased production to milk all they can<br />
from the roughly $1 billion business.<br />
<strong>The</strong> density domain of EPROMs remained at the lower level (256K and 512K, Figure 7-16). <strong>The</strong><br />
choice between EPROM and flash memory comes into play at higher densities ( 1M). In some<br />
cases, lower cost, lower voltage, and faster speed of some EPROM products may offer an advantage<br />
over competing devices. However, the trade-off of lower price is sometimes met with less<br />
flexibility (Figure 7-17).<br />
<strong>The</strong> leading EPROM suppliers for 1995 are shown in Figure 7-18. This list has changed several<br />
times during the past five years and will probably change more by the year 2000.<br />
7-10<br />
Millions of Dollars<br />
1,600<br />
1,400<br />
1,200<br />
1,000<br />
800<br />
600<br />
400<br />
200<br />
0<br />
Percent Change<br />
From Previous<br />
Year<br />
Source: ICE, "Status 1996"<br />
$1,390 $1,365<br />
1994<br />
3%<br />
1995<br />
–2%<br />
$1,240<br />
1996<br />
–9%<br />
$1,120<br />
1997<br />
–10%<br />
Figure 7-15. EPROM <strong>Market</strong> Decline<br />
$1,035<br />
1998<br />
–8%<br />
$935<br />
1999<br />
–10%<br />
$845<br />
2000<br />
–10%<br />
19518B<br />
INTEGRATED CIRCUIT ENGINEERING CORPORATION
Typical Storage Use<br />
Typical Number<br />
of Writes<br />
Densities Available<br />
Flexibility<br />
Cost Per Bit<br />
≤256K<br />
40%<br />
Source: ICE, "Status 1996"<br />
1995 (EST)<br />
492M<br />
>1M<br />
14%<br />
<strong>MOS</strong> <strong>Memory</strong> <strong>Market</strong> <strong>Trends</strong><br />
INTEGRATED CIRCUIT ENGINEERING CORPORATION 7-11<br />
512K<br />
28%<br />
1M<br />
18%<br />
19519B<br />
Figure 7-16. EPROM <strong>Market</strong> by Density (Units)<br />
EPROM Flash EEPROM<br />
Fixed programs<br />
Write once<br />
256K to 8M<br />
Least<br />
Least<br />
In-system modifiable<br />
programs<br />
Write up to 100,000<br />
times<br />
256K to 16M<br />
Frequently updated<br />
programs and data<br />
Write up to one million<br />
times<br />
1K to 64K (serial)<br />
64K to 4M (parallel)<br />
Most<br />
Most<br />
Source: Atmel/ICE, "Status 1996" 20411<br />
Rank<br />
1<br />
2<br />
3<br />
4<br />
5<br />
6<br />
Other<br />
Total<br />
Figure 7-1<strong>7.</strong> EPROMs Offer Lower Cost But Less Flexibility<br />
Company<br />
SGS-Thomson<br />
AMD<br />
TI<br />
Atmel<br />
National<br />
Cypress<br />
Source: ICE, "Status 1996"<br />
—<br />
—<br />
1994<br />
Sales<br />
($M)<br />
395<br />
215<br />
190<br />
145<br />
160<br />
45<br />
240<br />
1,390<br />
<strong>Market</strong>share<br />
(%)<br />
28<br />
15<br />
14<br />
10<br />
12<br />
3<br />
17<br />
100<br />
Sales<br />
($M)<br />
345<br />
170<br />
135<br />
125<br />
125<br />
105<br />
360<br />
1,365<br />
Figure 7-18. EPROM <strong>Market</strong> Leaders<br />
1995 (EST)<br />
<strong>Market</strong>share<br />
(%)<br />
25<br />
13<br />
10<br />
9<br />
9<br />
8<br />
26<br />
100<br />
14497N
<strong>MOS</strong> <strong>Memory</strong> <strong>Market</strong> <strong>Trends</strong><br />
Since 1993, several “big-name” vendors have dropped out of the EPROM business. In the early<br />
1990’s, Intel was the EPROM leader. Today, it is out of the market. Likewise, Philips<br />
Semiconductor, previously a medium-sized EPROM player, withdrew from the market. And,<br />
Fujitsu, concluding that flash memories will replace EPROMs in many applications, terminated<br />
development of its next-generation 8M EPROM device.<br />
During 1995, several leading EPROM suppliers were caught somewhere between trying to<br />
improve a technology that will likely return small, near-term financial rewards or investing in<br />
flash memory, which represents the future of nonvolatile memory and offers greater profitability.<br />
Texas Instruments, National Semiconductor, and AMD all reduced their EPROM production and<br />
future commitments to the EPROM market.<br />
TI informed customers that it would reduce production of its EPROMs roughly 50 percent beginning<br />
in 2H95 in order to allow more capacity for manufacturing digital signal processors.<br />
National’s total EPROM production was expected to diminish by 60 percent in 1995 as the company<br />
placed more emphasis on application-specific devices. Meanwhile, AMD was forced to closely<br />
evaluate its internal fab production commitments after losing two key EPROM foundry partners.<br />
Not every company distanced themselves from EPROMs, however. SGS-Thomson retained its<br />
leadership position in the EPROM business by emphasizing high-speed devices and filling out<br />
other niche organizations in its EPROM line-up. For instance, ST ramped production of its 8M<br />
(100ns and 120ns versions) and 16M (150ns and 200ns versions) lines in 1995 to meet increased<br />
demand for cost-effective alternatives to high-density ROM and flash memory devices.<br />
Smaller EPROM producers such as Cypress Semiconductor and Integrated Silicon Solutions Inc.<br />
have provided mainly niche-oriented high-speed EPROMs but are eager to fill the void left by<br />
larger players. A summary of those suppliers placing greater and less emphasis on the EPROM<br />
market is shown in Figure 7-19.<br />
Through the years, the EPROM market has been much more evenly balanced by region than other<br />
memory segments (Figure 7-20). ICE forecasts that the ROW region will capture more of the<br />
EPROM market in the coming years, while the European and Japanese markets will fluctuate<br />
around the same level as in 1995. Reduced EPROM consumption in North America is due to<br />
quick acceptance and implementation of flash memory in this region.<br />
EEPROMs<br />
EEPROMs (electrically erasable programmable read only memories) offer users excellent capabilities<br />
and performance. <strong>The</strong>y are available in either a serial or parallel version. Parallel EEPROMs<br />
are available in higher densities, are generally faster, offer high endurance and reliability, but also<br />
7-12<br />
INTEGRATED CIRCUIT ENGINEERING CORPORATION
<strong>MOS</strong> <strong>Memory</strong> <strong>Market</strong> <strong>Trends</strong><br />
cost more than their serial counterparts. Until recently, parallel EEPROMs found little interest<br />
beyond the military market. Serial EEPROMs, though generally less dense and slower than parallel<br />
devices, are much cheaper.<br />
Less Emphasis<br />
AMD<br />
• Evaluating in-house<br />
capacity allocation<br />
• Lost two EPROM foundry<br />
suppliers<br />
• More wafer starts at Flash<br />
facility (FASL) in Japan<br />
National<br />
• EPROM production down<br />
60 percent in 1995<br />
• Integrating EPROM and Flash<br />
capabilities with MCU<br />
and MPU technology to create<br />
application-specific products<br />
Texas Instruments<br />
• Reduced EPROM production<br />
50 percent to provide more<br />
capacity for DSPs<br />
Source: ICE, "Status 1996"<br />
North<br />
America<br />
33%<br />
Source: ICE, "Status 1996"<br />
SGS-Thomson<br />
More Emphasis<br />
• Upgrading EPROM<br />
process to 0.6 µm<br />
• Densities to 16M;<br />
many low-voltage versions<br />
Cypress<br />
• Previously a high-speed<br />
EPROM player, now<br />
attacking slow, low-cost<br />
segment left behind by others<br />
Integrated Silicon Solution Inc.<br />
• High-performance EPROMs<br />
for code storage applications<br />
Figure 7-19. EPROM Suppliers – Coming and Going<br />
1994<br />
$1,390M<br />
ROW<br />
15%<br />
Japan<br />
29%<br />
Europe<br />
23%<br />
North<br />
America<br />
29%<br />
Figure 7-20. EPROM <strong>Market</strong> by Region<br />
Japan<br />
29%<br />
1995 (EST)<br />
$1,365M<br />
<strong>The</strong> near-term EEPROM market forecast is shown in Figure 7-21. In 1995 the EEPROM market<br />
grew 23 percent following up on 20 percent growth in 1994. <strong>The</strong> CAGR for EEPROMs is estimated<br />
to be 14 percent for the 1995-2000 time period. Due in part to military use, the North American<br />
market was the largest for EEPROMs in 1995 (Figure 7-22).<br />
INTEGRATED CIRCUIT ENGINEERING CORPORATION 7-13<br />
ROW<br />
20%<br />
20412<br />
Europe<br />
22%<br />
16791J
<strong>MOS</strong> <strong>Memory</strong> <strong>Market</strong> <strong>Trends</strong><br />
ICE estimates that in 1995, the serial EEPROM market accounted for 90 percent of the $885 million<br />
EEPROM market (Figure 7-23). <strong>The</strong> largest serial EEPROM density shipping in volume was<br />
the 64K density device. Companies such as Atmel, Xicor, and SGS-Thomson supplied the large<br />
majority of these devices.<br />
<strong>The</strong> largest parallel EEPROMs built in volume during 1995 were 1M devices. <strong>The</strong>y were used<br />
extensively, although not exclusively, in military applications. Parallel EEPROMs are of particular<br />
interest in the military because they offer more flexibility than other kinds of solid-state memory.<br />
Specifically, parallel EEPROMs can be erased bit by bit, whereas other types of memory such<br />
as flash can only be erased in larger block segments at one time.<br />
7-14<br />
Millions of Dollars<br />
1,800<br />
1,600<br />
1,400<br />
1,200<br />
1,000<br />
800<br />
600<br />
400<br />
200<br />
0<br />
Percent<br />
Change<br />
720<br />
1994<br />
Source: ICE, "Status 1996"<br />
885<br />
1995<br />
1,020<br />
1996<br />
North<br />
America<br />
51%<br />
1995 (EST)<br />
$885M<br />
Source: ICE, "Status 1996"<br />
Japan<br />
12%<br />
1,090<br />
1997<br />
Year<br />
1,235<br />
1998<br />
ROW<br />
13%<br />
Europe<br />
24%<br />
1,420<br />
1999<br />
16792G<br />
1,700<br />
2000<br />
20% 23% 15% 7% 13% 15% 20%<br />
Figure 7-21. EEPROM <strong>Market</strong> Forecast ($M)<br />
Figure 7-22. 1995 EEPROM <strong>Market</strong><br />
20347A<br />
INTEGRATED CIRCUIT ENGINEERING CORPORATION
Serial EEPROM<br />
90%<br />
1995 (EST)<br />
$885M<br />
Source: ICE, "Status 1996"<br />
Figure 7-23. 1995 EEPROM <strong>Market</strong><br />
Parallel EEPROM<br />
10%<br />
<strong>MOS</strong> <strong>Memory</strong> <strong>Market</strong> <strong>Trends</strong><br />
Parallel EEPROMs can be found in defense applications such as flight controllers, vehicle control<br />
systems, field communications equipment, secure radios, command and control systems, radar,<br />
and guidance subsystems. <strong>The</strong> lightness, ruggedness, and fast performance of parallel EEPROMs<br />
make them well suited for harsh environments. Figure 7-24 gives a sampling of parallel EEPROM<br />
suppliers and some of the devices they offer.<br />
Aeroflex Circuit Technology<br />
ARX-E1MX32<br />
(MCM)<br />
Atmel Corp.<br />
AT28C040<br />
AT28C010<br />
Electronic Designs Inc.<br />
EDI5C32128C<br />
EDI5M32128C<br />
EDI5C3232C<br />
EDI5M3232C<br />
Sac-Tec Labs<br />
TBD<br />
ST512x32x<br />
Space Electronics<br />
28CO10RP<br />
79C010RP<br />
28C256ERP<br />
White Microelectronics<br />
WF2048K32<br />
WE128K32<br />
WF1024K32<br />
Xlcor Inc.<br />
X28HC256<br />
X28VC256<br />
X28C010<br />
X28C512<br />
Source: ICE, "Status 1996"<br />
Density<br />
(Bits)<br />
32M<br />
4M<br />
1M<br />
4M<br />
4M<br />
1M<br />
1M<br />
144/<br />
288M<br />
16/<br />
32M<br />
1M<br />
1M<br />
256K<br />
64M<br />
4M<br />
32M<br />
256K<br />
256K<br />
1M<br />
512<br />
Organization<br />
1M x 32<br />
512K x 8<br />
128K x 8<br />
128K x 32<br />
128K x 32<br />
32K x 32<br />
32K x 32<br />
Multiple I/O<br />
512K x 32<br />
1,024K x 32<br />
128K x 8 bit<br />
MCM 32K x 8 bit<br />
32K x 8 bit<br />
2,048K x 32<br />
128K x 32<br />
1,024K x 32<br />
32K x 8<br />
32K x 8<br />
128K x 8<br />
64K x 8<br />
Endurance<br />
(Erase/Write Cycles)<br />
10,000 to 100,000<br />
100,000<br />
100,000<br />
10,000<br />
10,000<br />
10,000<br />
10,000<br />
100,000<br />
100,000<br />
10,000<br />
10,000<br />
10,000<br />
1,000,000<br />
N/A<br />
100,000<br />
100,000<br />
100,000<br />
100,000<br />
100,000<br />
Voltage<br />
(V)<br />
INTEGRATED CIRCUIT ENGINEERING CORPORATION 7-15<br />
5<br />
5<br />
5<br />
5<br />
5<br />
5<br />
5<br />
5, 12<br />
5, 12<br />
2<br />
2<br />
2<br />
3.3/5<br />
5<br />
5/12<br />
5<br />
5<br />
5<br />
5<br />
Packaging<br />
2.1" x 2.9" x .275"<br />
32 flatpack, 44 LCC,<br />
32 DIP<br />
32 LCC<br />
68-pin ceramic JLCC<br />
68-pin ceramic PGA<br />
68-pin ceramic JLCC<br />
68-pin ceramic PGA<br />
Hybrid module<br />
SMD module<br />
Hybrid module<br />
SMD module<br />
32-pin flatpack<br />
36-pin flatpack<br />
28-pin flatpack<br />
PGA/HIP & CQFP<br />
PGA/HIP & CQFP<br />
PGA/HIP & CQFP<br />
DIP, LCC<br />
DIP, LCC<br />
DIP, LCC<br />
DIP, LCC<br />
20413<br />
Figure 7-24. Sampling of Parallel EEPROM Suppliers & Devices<br />
Military<br />
Qualifications/Spec<br />
Mil-Std-883<br />
5962-94551<br />
5962-38267<br />
—<br />
—<br />
—<br />
—<br />
Mil-H-38534<br />
compliant<br />
Mil-H-38534<br />
compliant<br />
Class B & S<br />
Class B & S<br />
Class B & S<br />
883/SMD<br />
883/SMD<br />
883/SMD<br />
883<br />
883<br />
883<br />
883<br />
Military<br />
Applications<br />
Airborne<br />
Land-based<br />
avionics<br />
Avionics<br />
Various<br />
Various<br />
Various<br />
Various<br />
Space/Defense<br />
Space/Defense<br />
Military & Space<br />
Military & Space<br />
Military & Space<br />
Solid-state storage<br />
Solid-state storage<br />
Solid-state storage<br />
Flight data recorders,<br />
flight control systems,<br />
communications<br />
20349
<strong>MOS</strong> <strong>Memory</strong> <strong>Market</strong> <strong>Trends</strong><br />
Consumer-oriented applications<br />
represented the largest end-use of<br />
serial EEPROMs in 1995 (Figure 7-<br />
25). Consumer applications span a<br />
wide variety of electronic systems<br />
but essentially involve systems<br />
where “touch” or “push” programmability<br />
exists. Other leading serial<br />
EEPROM applications are shown in<br />
Figure 7-26.<br />
EEPROMs are well suited for low-voltage operation and are being developed along side other<br />
technologies for such applications. In 4Q95, Xicor introduced a prototype million-transistor<br />
device that integrates EEPROM technology with digital signal processing. <strong>The</strong> IC, to be priced<br />
under $50, will be sold to portable communications equipment makers that need in-system programmability<br />
and 1.8-volt operation. Toshiba and Hitachi also improved their EEPROM line-ups<br />
to better meet high-speed, low-voltage, and low power consumption demands.<br />
<strong>The</strong> number of erase/write cycles that a particular EEPROM device offers depends on several factors<br />
such as temperature, voltage, and the number of cycles per day. For EEPROMs, endurance<br />
ratings of 100,000 and one million erase/write cycles are common. In contrast, 100,000 cycles are<br />
7-16<br />
Office 7%<br />
Automotive<br />
8%<br />
Computer-Related<br />
7%<br />
Military/Aerospace<br />
7%<br />
Source: ICE, "Status 1996"<br />
Industrial<br />
15%<br />
1995<br />
Telecom<br />
20%<br />
Consumer<br />
36%<br />
19520B<br />
Figure 7-25. Serial EEPROM Applications (Units)<br />
Consumer<br />
TV<br />
VCR<br />
Radio Tuner<br />
CD/Laser Disk<br />
Feature Phone<br />
Pay Phone<br />
Answer Machine<br />
Pager<br />
Photo Equip.<br />
Handheld Remote<br />
Weight Scale<br />
Camcorder<br />
Exercise Machine<br />
Sonabuoy<br />
Smart Key<br />
Electronic Locks<br />
Smart Cards<br />
Appliances<br />
Karaoke<br />
Video Game<br />
Automotive<br />
Anti-lock Brake Sys.<br />
Air Bag Sensor<br />
Odometer<br />
Trip Computer<br />
Power Steering Ctrl<br />
Cruise Control<br />
Wiper Control<br />
Security System<br />
Shock Sensor<br />
Electronic Key<br />
Keyless Entry<br />
Radio<br />
Cellular Phone<br />
Mobile TV<br />
Industrial<br />
<strong>The</strong>rmostat<br />
Utility Meter<br />
Security<br />
System<br />
Controller<br />
Computer Peripheral<br />
Disk Drive<br />
PC LAN System<br />
PCMCIA Card<br />
Video Graphics Card<br />
Video Monitor<br />
Access Bus Protocol<br />
Laser Printer<br />
Scanner<br />
Bar Code Reader<br />
Communications<br />
Modem<br />
Fax Machine<br />
Copier<br />
Cellular Phone<br />
Mobile Phone<br />
PABX System<br />
Satellite Receiver<br />
POS Terminal<br />
Data Acquisition<br />
PDA<br />
Source: Microchip/ICE, "Status 1996" 20416<br />
Figure 7-26. Typical Serial EEPROM Applications<br />
INTEGRATED CIRCUIT ENGINEERING CORPORATION
<strong>MOS</strong> <strong>Memory</strong> <strong>Market</strong> <strong>Trends</strong><br />
at the high end of performance for flash memory devices. Depending on the design, the number<br />
of erase/write cycles may or may not be important. Figure 7-27 shows applications that change<br />
or update the data in an EEPROM most often during a day. Applications such as a maintenance<br />
log or last number redial are the most taxing on an EEPROM.<br />
Maintenance Log<br />
Last Number Redial<br />
Electronic Lock Access<br />
Power-Down Storage<br />
Digital Potentiometer<br />
Look-Up Table<br />
Tuner Controls<br />
System Configuration<br />
Anti-Lock Braking System<br />
Speed Dial<br />
Airbag<br />
0.01 0.1 1 10 100 1,000<br />
Cycles Per Day<br />
Source: Microchip Technology/ICE, "Status 1996"<br />
19521<br />
Leading EEPROM suppliers are shown in Figure 7-28. Atmel, SGS-Thomson, and Microchip<br />
Technology continue to make strides in the market.<br />
Rank<br />
1<br />
2<br />
3<br />
4<br />
5<br />
—<br />
—<br />
Figure 7-2<strong>7.</strong> EEPROM Endurance Requirements<br />
Company<br />
SGS-Thomson<br />
Atmel<br />
Xicor<br />
Microchip<br />
National<br />
Others<br />
—<br />
Source: ICE, "Status 1996"<br />
1994<br />
Sales<br />
($M)<br />
115<br />
140<br />
95<br />
60<br />
45<br />
265<br />
720<br />
<strong>Market</strong>share<br />
(%)<br />
INTEGRATED CIRCUIT ENGINEERING CORPORATION 7-17<br />
16<br />
20<br />
13<br />
8<br />
6<br />
37<br />
100<br />
Sales<br />
($M)<br />
170<br />
145<br />
100<br />
85<br />
55<br />
330<br />
885<br />
Figure 7-28. 1995 EEPROM <strong>Market</strong> Leaders<br />
1995 (EST)<br />
<strong>Market</strong>share<br />
(%)<br />
19<br />
17<br />
11<br />
10<br />
6<br />
37<br />
100<br />
14498N
<strong>MOS</strong> <strong>Memory</strong> <strong>Market</strong> <strong>Trends</strong><br />
FLASH MEMORY<br />
Flash memory is the newcomer on the <strong>MOS</strong> memory block. Despite being commercially available<br />
since around 1990, flash pricing and performance have inched closer to parity with many other<br />
memory devices. Given the option, more and more designers are giving serious consideration to<br />
flash memory products in their systems. Lower pricing, increased performance, and more design<br />
wins in innovative products have stirred a lot of interest in the flash memory market.<br />
Since 1990, flash memory products have revolutionized how designers think about storing control<br />
code in computers, peripherals, communication devices, and a number of other applications.<br />
Several elements, highlighted in Figure 7-29, will help the flash memory market expand further in<br />
1996.<br />
Figure 7-30 demonstrates how flash memory is forecast to be the memory segment with the highest<br />
CAGR through the year 2000. Driving the growth are wide ranging embedded applications,<br />
which account for 80 to 90 percent of all flash sales. Hot markets include PC BIOS, telecommunications<br />
devices such as cellular phones and modems, printers, hard disk drives, and video game<br />
cartridges. Flash devices are serving in new and innovative applications rather than strictly as<br />
EPROM replacement. In fact, 1995 was the first year that the flash memory market was larger<br />
than the EPROM memory market.<br />
A brief market history of flash devices is plotted in Figure 7-31 . <strong>The</strong> forecast growth in the flash<br />
market is plotted in Figure 7-32. By the year 2000, ICE expects the flash market to be $5.8 billion,<br />
more than three times its 1995 size.<br />
Currently, the majority of flash devices shipped are 1M (33 percent) and 4M (24 percent) densities<br />
(Figure 7-33). 16M and 4M devices will ship more than any other size as applications become<br />
more sophisticated toward the end of the decade.<br />
ICE estimates that consumption of flash memory devices was greatest in the North American<br />
region in 1995 (Figure 7-34). Solid business applications—especially in the portable/mobile category—provided<br />
a strong foundation for growth in both the North American and European regions.<br />
7-18<br />
•Ability to rewrite data or code in a system<br />
•ASPs competitive with DRAM at 4M, 16M densities<br />
•High density, low power, rewrite ability, non-volatility<br />
favor growing hand-held/portable/mobile electronics<br />
Source: ICE, "Status 1996"<br />
Figure 7-29. Growth Factors in Flash <strong>Memory</strong> <strong>Market</strong><br />
20073<br />
INTEGRATED CIRCUIT ENGINEERING CORPORATION
Percent<br />
50<br />
40<br />
30<br />
20<br />
10<br />
0<br />
–10<br />
Flash<br />
Source: ICE, "Status 1996"<br />
Billings in Millions<br />
600<br />
550<br />
500<br />
450<br />
400<br />
350<br />
300<br />
250<br />
200<br />
150<br />
100<br />
50<br />
0<br />
$8.57<br />
Dollar Volume<br />
120<br />
14<br />
1Q<br />
2Q<br />
Source: ICE, "Status 1996"<br />
DRAM<br />
SRAM<br />
EEPROM<br />
Figure 7-30. 1992-2000 <strong>Memory</strong> IC CAGRs<br />
3Q<br />
Unit Volume<br />
4Q<br />
1Q<br />
2Q<br />
Year<br />
3Q<br />
<strong>MOS</strong> <strong>Memory</strong> <strong>Market</strong> <strong>Trends</strong><br />
EPROM<br />
INTEGRATED CIRCUIT ENGINEERING CORPORATION 7-19<br />
4Q<br />
1Q<br />
ASP<br />
2Q<br />
1993 1994 1995<br />
Figure 7-31. Flash <strong>Memory</strong> <strong>Market</strong><br />
ROM<br />
3Q<br />
571<br />
$<strong>7.</strong>61<br />
75<br />
4Q<br />
(EST)<br />
9.00<br />
8.80<br />
8.60<br />
8.40<br />
8.20<br />
8.00<br />
<strong>7.</strong>80<br />
<strong>7.</strong>60<br />
<strong>7.</strong>40<br />
<strong>7.</strong>20<br />
<strong>7.</strong>00<br />
6.80<br />
6.60<br />
6.40<br />
ASP ($)<br />
20417<br />
20071A
<strong>MOS</strong> <strong>Memory</strong> <strong>Market</strong> <strong>Trends</strong><br />
<strong>The</strong> leading flash memory suppliers are displayed in Figure 7-35. Intel and AMD dominate this<br />
market. Both companies are well up the learning curve slope while many other companies are just<br />
beginning to get their flash business off the ground. With its AMD partnership (FASL) in place,<br />
Fujitsu was able to join the small group of manufacturers that generated triple-digit flash revenue<br />
growth in 1995.<br />
7-20<br />
Millions of Dollars<br />
6,000<br />
5,000<br />
4000,<br />
3,000<br />
2000,<br />
1,000<br />
0<br />
Total ($M)<br />
Percent Change<br />
Source: ICE, "Status 1996"<br />
1991<br />
1992<br />
100 270<br />
171%<br />
1993<br />
640<br />
137%<br />
1994<br />
865<br />
35%<br />
1995<br />
1,800<br />
108%<br />
1996<br />
2,300<br />
28%<br />
1997<br />
2,830<br />
23%<br />
1998<br />
3,535<br />
25%<br />
Figure 7-32. Dollar Value of Worldwide Flash <strong>Memory</strong> <strong>Market</strong><br />
4M<br />
24%<br />
2M<br />
13%<br />
≥16M<br />
1%<br />
8M<br />
9%<br />
Source: ICE, "Status 1996"<br />
1995 (EST)<br />
232M<br />
256K<br />
10% 512K<br />
10%<br />
1M<br />
33%<br />
20351A<br />
Figure 7-33. Flash Unit Shipments by Density<br />
1999<br />
4,500<br />
27%<br />
2000<br />
5,800<br />
29%<br />
18692B<br />
INTEGRATED CIRCUIT ENGINEERING CORPORATION
Following behind in flash sales were a handful of other manufacturers from around the world.<br />
<strong>The</strong>se included Atmel, Hitachi, Micron, Mitsubishi, Samsung, SGS-Thomson, and Toshiba. <strong>The</strong>re<br />
are many vendors who want to be a part of the flash memory business, but not all are capable from<br />
a technology standpoint. Neither are many vendors capable from a financial standpoint. That is<br />
why the list of leading vendors is still primarily limited to companies with a strong financial base,<br />
solid R&D skills, and large fab capacity.<br />
At least three significant hurdles face the flash memory market if it is to continue growing at its<br />
fast pace. <strong>The</strong> issues are architecture, voltage supply, and capacity.<br />
Architecture<br />
Others<br />
21%<br />
AMD<br />
25%<br />
Source: ICE, "Status 1996"<br />
ROW<br />
12%<br />
North America<br />
46%<br />
Source: ICE, "Status 1996"<br />
1995 (EST)<br />
$1.8B<br />
Japan<br />
18%<br />
Europe<br />
24%<br />
<strong>MOS</strong> <strong>Memory</strong> <strong>Market</strong> <strong>Trends</strong><br />
All flash devices are not created equally. <strong>The</strong>re are two prominent architectures that compete in<br />
today’s market: NOR and NAND. Both are based on technology from flash’s predecessors, the<br />
EPROM and EEPROM circuits. NOR and NAND imply different types of memory cell structure.<br />
Each uses floating-gate transistors for storage elements, but differ in the way the memory cells are<br />
linked together.<br />
Also, each is well suited for specific applications—NOR for RAM-like applications requiring fast<br />
access times, and NAND for applications that do not require repetitive random accesses, such as<br />
disk-drive replacements.<br />
INTEGRATED CIRCUIT ENGINEERING CORPORATION 7-21<br />
20093A<br />
Figure 7-34. 1995 Flash <strong>Memory</strong> <strong>Market</strong> by Region<br />
1994<br />
$865M<br />
INTEL<br />
54%<br />
Others<br />
20%<br />
AMD<br />
30%<br />
1995 $1.8B<br />
(EST)<br />
Figure 7-35. Leading Flash <strong>Memory</strong> Suppliers<br />
INTEL<br />
50%<br />
20092A
<strong>MOS</strong> <strong>Memory</strong> <strong>Market</strong> <strong>Trends</strong><br />
Beyond NOR and NAND are emerging architectures such as Mitsubishi’s DINOR (divided bitline<br />
NOR) technology and the AND structure that is being promoted by Hitachi. DINOR offers<br />
low power and low voltage in a die size approximately 20 percent smaller than an equivalent<br />
NOR device. While each architecture has its benefits, NOR and NAND were the two front runners<br />
through 1995 and will likely dominate the near-term market.<br />
Figure 7-36 provides a brief comparison of the four available flash architecture styles while Figure<br />
7-37 provides a look at the various flash memory architectures and the vendors who support<br />
them.<br />
7-22<br />
Architecture NOR DINOR NAND AND<br />
Program Method<br />
Erase Method<br />
Possible Power Supply<br />
single 3.3V<br />
single 5V<br />
dual 5V/12V<br />
Die Size (using NOR<br />
as reference)<br />
Suitable Applications<br />
(by density)<br />
1M to 4M<br />
8M to 16M<br />
32M to 256M<br />
Hot carrier injection<br />
Tunnel current<br />
Difficult<br />
Yes<br />
Yes<br />
1<br />
BIOS, EPROM replacement,<br />
communications,<br />
low-density XIP cards<br />
PDA, cellular, networking,<br />
low-density<br />
ATA cards<br />
Not suitable<br />
Tunnel current<br />
Tunnel current<br />
Yes<br />
No<br />
No<br />
0.8<br />
Not suitable<br />
PDA, cellular, networking,<br />
low-density<br />
ATA cards<br />
Not suitable<br />
Tunnel current<br />
Tunnel current<br />
Source: Computer Design/ICE, "Status 1996" 20418<br />
Yes<br />
Yes<br />
Yes<br />
0.9<br />
BIOS, EPROM replacement,<br />
communications,<br />
low-density XIP cards<br />
PDA, cellular, networking,<br />
low-density<br />
ATA cards<br />
High-density ATA cards<br />
(10-100Mbytes)<br />
Figure 7-36. Flash Architectures Stretch to Fit <strong>Memory</strong> Requirements<br />
NOR NAND AND DINOR<br />
Intel<br />
AMD<br />
Fujitsu<br />
TI<br />
Micron<br />
SGS-Thomson<br />
Macronix<br />
UMC<br />
National<br />
Samsung<br />
Toshiba<br />
Hitachi<br />
Mitsubishi<br />
Mitsubishi<br />
Hitachi<br />
Winbond uses its proprietary "split-gate" architecture.<br />
Source: ICE, "Status 1996"<br />
20080A<br />
Figure 7-3<strong>7.</strong> Vendors’ Support of Flash <strong>Memory</strong> Architectures<br />
Tunnel current<br />
Tunnel current<br />
Yes<br />
No<br />
No<br />
0.8<br />
Not suitable<br />
Not suitable<br />
High-density ATA cards<br />
(10-100Mbytes)<br />
INTEGRATED CIRCUIT ENGINEERING CORPORATION
Voltage<br />
<strong>MOS</strong> <strong>Memory</strong> <strong>Market</strong> <strong>Trends</strong><br />
Another issue being addressed in the flash market is that of single- versus dual-supply voltage,<br />
and the implementation of low-voltage parts. <strong>The</strong> trend is for users to design single-voltage<br />
devices into their systems. That is, the market for 5V program/erase devices is expected to grow<br />
rapidly, overtaking the products incorporating 12V devices in 1996 (Figure 7-38).<br />
Millions of Dollars<br />
4,000<br />
3,500<br />
3,000<br />
2,500<br />
2,000<br />
1,500<br />
1,000<br />
<br />
<br />
<br />
<br />
<br />
<br />
0<br />
<br />
1994<br />
1995<br />
1996<br />
1997<br />
1998<br />
500<br />
≤3V-only<br />
3V/5V<br />
5V-only<br />
5V/12V<br />
Source: ICE, "Status 1996"<br />
AMD has emphasized its low-voltage, single-voltage flash products. Most of its devices are manufactured<br />
to write and erase at 5V (low-voltage in the flash market). Until recently, Intel downplayed<br />
the importance of single-voltage flash. However, it now promotes its SmartVoltage flash<br />
technology, which allows flash chips to operate with a 3V or 5V read voltage and 5V or 12V<br />
erase/write voltage. By incorporating its SmartVoltage lineup, it has practically acknowledged<br />
the market for single-power supply flash.<br />
ICE anticipates the 5V flash market maintaining very solid, steady growth through the year 2000.<br />
Growth in the 3V flash market is also expected to surge later in the decade.<br />
INTEGRATED CIRCUIT ENGINEERING CORPORATION 7-23<br />
Year<br />
Figure 7-38. Flash <strong>Memory</strong> <strong>Market</strong> by Voltage<br />
20087
<strong>MOS</strong> <strong>Memory</strong> <strong>Market</strong> <strong>Trends</strong><br />
Capacity<br />
Big strides to level the flash memory supply-demand ratio took place in 1995 as several vendors<br />
either brought new flash-dedicated fabs on line or announced their intentions to add more capacity.<br />
Figure 7-39 shows some of the new flash capacity that has come on line or that will soon be<br />
available.<br />
Intel dedicated new fab space to flash memory production. Its Fabs 7 and 9 in New Mexico along<br />
with its announcement to build a new production facility (Fab 18) in Israel should help eliminate<br />
the capacity crunch for flash memory.<br />
7-24<br />
Company Location Process Technology Comments<br />
Intel<br />
Sharp<br />
AMD/Fujitsu<br />
Mitsubishi<br />
Source: ICE, "Status 1996"<br />
Fab 7<br />
New Mexico, USA<br />
150mm wafers<br />
Fab 9<br />
New Mexico, USA<br />
200mm wafers<br />
Fab 18<br />
Kiryat Gat, Israel<br />
200mm wafers<br />
Fab 3<br />
Fukuyama, Japan<br />
200mm wafers<br />
FASL<br />
Aizu-Wakamatsu, Japan<br />
200mm wafers<br />
Saijo Facility<br />
Japan<br />
0.4µm by 1Q96.<br />
Near 100% flash<br />
production.<br />
0.4µm<br />
0.25µm<br />
0.4µm by 1996.<br />
0.5µm<br />
0.5µm<br />
Wafer starts increasing<br />
25% in 1996.<br />
Mostly 5V/12V parts.<br />
Die shrinks to improve<br />
effective capacity/yields.<br />
Production starts 4Q96.<br />
Figure 7-39. New Flash Capacity to Meet Demand<br />
$1 billion investment. First<br />
silicon due 4Q9<strong>7.</strong><br />
Production ramp slated for<br />
1998. When fully operational,<br />
Fab 18 will increase Intel's flash<br />
output 350% over 1995 levels.<br />
Builds Intel devices.<br />
Not yet at capacity.<br />
Running 8M, 16M parts.<br />
Accelerating development of<br />
Intel's SmartVoltage technology.<br />
Opened 4Q94.<br />
Aggressive ramp schedule.<br />
20 million-plus unit shipments<br />
forecast for 1995. Negotiating<br />
to build a second joint-venture<br />
fab in Japan. If approved,<br />
production would begin in late<br />
1997 or early 1998.<br />
Currently processing DRAMs.<br />
Making switch to flash<br />
memories.<br />
20079A<br />
INTEGRATED CIRCUIT ENGINEERING CORPORATION
AMD ramped production at its joint-venture fab with Fujitsu (FASL) in 1995. Due to continued<br />
demand, the two firms mulled over a second flash-dedicated fab. If approved, the facility would<br />
likely begin production in late 1997 or early 1998.<br />
Meanwhile, the Taiwanese have shown considerable interest in joining the flash party. In the second<br />
half of 1995, at least four companies announced their intentions to become involved with or<br />
expand their involvement in the flash market place (Figure 7-40). Despite the competition, the<br />
Taiwanese companies expect to capitalize on the exploding flash market. Further, the move<br />
demonstrates their resolve to transit into more complex and more profitable product lines.<br />
Company Flash Plans<br />
Formosa Chemical & Fibre<br />
Macronix<br />
UMC<br />
Winbond<br />
Source: ICE, "Status 1996"<br />
Looking for a joint-venture partner to help propel it<br />
into the flash memory business. It desires to<br />
manufacture flash memories (and other related IC<br />
products) in a proposed 200mm sub-micron fab.<br />
Has sold 1M and 4M flash parts for several years.<br />
Designing products around a single-voltage<br />
architecture developed by AMD. Sampled 16M<br />
flash devices co-developed with NKK of Japan.<br />
Designing 1M and 2M flash products around a<br />
single-voltage architecture developed by AMD.<br />
Shipments will begin in mid-1996.<br />
Sampling first members of its flash family based<br />
on its proprietary EEPROM technology. <strong>The</strong> 256K<br />
and 1M 5V-only densities are built around a "splitgate"<br />
architecture, which differs from Intel's and<br />
AMD's cell structure.<br />
Figure 7-40. Taiwan Joining Flash Bandwagon<br />
<strong>MOS</strong> <strong>Memory</strong> <strong>Market</strong> <strong>Trends</strong><br />
Earlier, it was mentioned that flash memory has been a hit in the portable systems arena.<br />
Specifically, flash memory in the form of flash cards has received much attention as this market<br />
heats up. In 2H95, rival and incompatible memory-card proposals went public to garner a share<br />
of new-generation, low-cost digital consumer devices. Minicard, CompactFlash, and Solid State<br />
Floppy Disk represent three alternatives that aim to replace film, cassette tapes, and full-size PCM-<br />
CIA-type memory cards in digital cameras, audio recorders, and other portable systems. Figure<br />
7-41 provides highlights of each proposition.<br />
It is no wonder flash card technology is taking off. With prices dropping and applications increasing,<br />
consumers stand to benefit from the ease and repetitive use available with digital technology.<br />
Figure 7-42 details cost trends and advantages of flash cards.<br />
INTEGRATED CIRCUIT ENGINEERING CORPORATION 7-25<br />
20419
<strong>MOS</strong> <strong>Memory</strong> <strong>Market</strong> <strong>Trends</strong><br />
With the flurry of activity in the flash memory market, several product announcements and technology<br />
breakthroughs were reported. A sampling of some of the more significant company<br />
alliances and product announcements is listed below.<br />
7-26<br />
Compact-<br />
Flash<br />
Minicard<br />
Solid State<br />
Floppy Disk<br />
Proponent Size (mm)<br />
SanDisk,<br />
others to come<br />
Intel, Philips,<br />
others to come<br />
Toshiba<br />
*Full range not available at launch<br />
36 x 43<br />
x 3.3<br />
35 x 33<br />
x 3.5<br />
45 x 37<br />
x 0.76<br />
<strong>Memory</strong> Type Capacity Connector Type<br />
NOR flash<br />
NOR flash, DRAM,<br />
SRAM, OTP, ROM<br />
NAND flash<br />
2, 4, 12,<br />
15Mbytes<br />
64Kbytes* to<br />
128Mbytes<br />
2Mbytes<br />
50-pin subset<br />
of PCMCIA<br />
40-pad<br />
elastomeric<br />
68-pin PCMCIA<br />
with adapter<br />
Source: EE Times/ICE, "Status 1996" 20420<br />
Figure 7-41. Mini Flash Cards Target Cameras, Audio Recorders, and PDAs<br />
Retail Price ($)<br />
500<br />
400<br />
300<br />
200<br />
100<br />
0<br />
1993<br />
1994<br />
What does 5MB get you?<br />
• Images - over 50 digital images<br />
• Voice - More than 1 hour<br />
• Data - 3,500 pages of double-space text<br />
1995<br />
Year<br />
• AMD and Fujitsu started volume production of flash devices at their new jointly owned<br />
facility in Aizu-Wakamatsu, Japan. At the end of 1995, FASL was producing five million<br />
units per month. AMD and Fujitsu also discussed the possibility of building a second flashdedicated<br />
facility in Japan.<br />
1996<br />
1997<br />
1998<br />
Source: SanDisk/ICE, "Status 1996" 20421<br />
Figure 7-42. Retail Price of 5MB Flash Disk Card<br />
INTEGRATED CIRCUIT ENGINEERING CORPORATION
<strong>MOS</strong> <strong>Memory</strong> <strong>Market</strong> <strong>Trends</strong><br />
• Hitachi added its name to the list of vendors offering a 32M flash device. <strong>The</strong> company<br />
developed its version using its proprietary AND architecture on a 0.45µm C<strong>MOS</strong> process.<br />
<strong>The</strong> devices are aimed at solid-state disk applications, but the company also has plans to use<br />
the chips in the flash card business. Samples were available in 4Q95.<br />
• Hyundai Electronics created a new flash memory division in Sunnyvale, California. It<br />
expects to enter the market with 4M and 16M flash products in 1996.<br />
• Intel began offering 4M and 8M boot-block flash devices that are capable of operating at voltages<br />
as low as 2.7 volts. <strong>The</strong> SmartVoltage devices allow flash memories to be read and written<br />
to at multiple voltages, offering a higher degree of flexibility than single-voltage flash,<br />
according to Intel.<br />
• LG Semicon and SanDisk entered into an agreement under which LG Semicon will manufacture<br />
flash memory for use in SanDisk flash data storage products. As part of the agreement,<br />
LG Semicon made an minority investment in SanDisk. <strong>The</strong> agreement also provides<br />
that the two companies will cooperate in further development of flash products.<br />
• Matsushita will supply 32M flash memory chips to SanDisk beginning 1Q96. <strong>The</strong> devices<br />
will be packaged into CompactFlash PC cards with a memory storage capacity of 15MB.<br />
• Micron entered into a licensing agreement with flash market leader Intel. In doing so, it<br />
gained access to the full range of Intel’s flash patents while also signaling that it would align<br />
itself with Intel’s mixed-power supply flash mode.<br />
• Mitsubishi released its 3V-only 16M DINOR flash memory chip, the first in a series of products<br />
that incorporate Mitsubishi’s divided bit-line NOR technology. It was produced using<br />
a half-micron process and volume production is expected in early 1996. Hitachi, working<br />
with Mitsubishi to develop the technology, later introduced its 16M DINOR device.<br />
• National is reselling Toshiba-built 16M flash memories in the merchant market under the<br />
National brand label and is committed to building Toshiba-compatible flash devices.<br />
National also has plans to produce non-standard parts that better target specific applications.<br />
• NEC began marketing flash memory chips in 4Q95. <strong>The</strong> company will initially ship 1M and<br />
4M NOR-type chips that use 12V and 5V to write and read data, respectively. NEC plans to<br />
release an 8M chip in 2Q96. Production will start at 300,000 to 400,000 units per month at<br />
NEC Yamaguchi.<br />
• SanDisk and Intel signed an agreement that allows each to license the other’s patents covering<br />
the design and manufacture of flash memory products, giving both companies unrestricted<br />
rights to use those patents.<br />
INTEGRATED CIRCUIT ENGINEERING CORPORATION 7-27
<strong>MOS</strong> <strong>Memory</strong> <strong>Market</strong> <strong>Trends</strong><br />
• Samsung sampled its 32M NAND flash memory device. <strong>The</strong> 3V-only (also available in a 5Vonly<br />
version) IC is based on a 0.5µm C<strong>MOS</strong> process. Volume production started in 4Q95.<br />
Samsung expects to introduce a compatible 64M NAND flash memory device in 1996.<br />
• Toshiba developed a 32M flash device. Designed using a 0.425µm C<strong>MOS</strong> process, the<br />
NAND chip operates on a 3V or 5V supply.<br />
• Toshiba and Samsung signed a technical alliance that calls for co-development of NAND<br />
flash devices through (and including) the 64M density. Toshiba is also sharing some of its<br />
flash knowledge with IBM.<br />
• Xicor doubled the size of its flagship flash memory product with the addition of a 128K<br />
device to its SerialFlash family of low-voltage flash memories with serial architecture.<br />
SRAMs<br />
Static RAMs (SRAMs) are memory devices capable of retaining their information at very low<br />
power, without the need for periodic “refresh” as in the case with DRAMs. Although these<br />
devices have lived in the shadow of DRAMs for the longest time, SRAMs took on added importance<br />
and significance in 1995. Why? In a word, Pentium.<br />
Prior to the advent of the Pentium processor, SRAM was considered antiquated technology with<br />
little value. ASPs were such that profit margins were below the interest level of most manufacturers.<br />
<strong>The</strong> present environment, however, shows a 180-degree reversal of that pattern. In many<br />
cases, manufacturers scaled back production of other, less profitable chips to make room for additional<br />
SRAM production. Demand was high, capacity tight, and lead times long for SRAMs<br />
throughout most of 1995.<br />
<strong>The</strong> disparity between Pentium-class MPU clock speeds and DRAM access times became more<br />
apparent during 1995. In many cases, high-performance CPUs remained in idle wait states while<br />
accessing slower DRAM memory. To reduce or eliminate the wait state, designers looked to<br />
SRAM cache memory. Cache memory serves as temporary storage between the CPU and the<br />
main memory and helps CPUs to perform at their optimum level.<br />
As depicted in Figure 7-43, cache memory is becoming a more significant factor in PC systems. With<br />
few exceptions, MPU bus speeds now require a second-level cache built with fast SRAM to tap the<br />
full potential of the microprocessor. <strong>The</strong> result has been SRAM demand that has skyrocketed.<br />
It is estimated that less than one-quarter of 486-based machines—generally those with 50MHz and<br />
slower MPUs—have secondary cache. In contrast, forecasts show that secondary cache will be a<br />
feature on as many as three-fourths of Pentium-based PCs (Figure 7-44). Further, it is estimated<br />
7-28<br />
INTEGRATED CIRCUIT ENGINEERING CORPORATION
<strong>MOS</strong> <strong>Memory</strong> <strong>Market</strong> <strong>Trends</strong><br />
that Pentium-based systems with level-two cache operate 30 percent faster than systems without.<br />
Intel’s planned delivery of 30 million-plus Pentium’s in 1995 placed the SRAM market, specifically<br />
cache SRAMs, in a strong growth mode through the year and well into 1996 and beyond. In<br />
fact, ICE forecasts the SRAM market growth rate will hover around 20 percent per year through<br />
the year 2000 (Figure 7-45).<br />
16bit CPU<br />
Non Cache<br />
32bit CPU<br />
Standard<br />
SRAM<br />
64bit CPU<br />
With Cache<br />
Sync. Burst SRAM<br />
1987 1990 1993 1996 1999<br />
Year<br />
Source: Mitsubishi/ICE, "Status 1996" 20429<br />
Figure 7-43. Trend of PC Cache SRAM<br />
486-Based Systems<br />
<br />
<br />
<br />
23%<br />
<br />
<br />
<br />
77%<br />
Systems With<br />
<br />
Secondary Cache<br />
<br />
Source: ICE, "Status 1996"<br />
Systems Without<br />
Secondary Cache<br />
Pentium-Based<br />
Systems<br />
<br />
<br />
<br />
<br />
27%<br />
<br />
<br />
<br />
73%<br />
<br />
<br />
<br />
<br />
Figure 7-44. Who Has <strong>The</strong> Cache? Percentage of PC Systems With Secondary Cache<br />
SRAM suppliers are working to ramp production of 32K x 32 parts due to the continued migration<br />
toward RISC-based and Pentium-based PC systems. <strong>The</strong> market for SRAMs configured this<br />
way remains as tight as that for DRAMs. While fast 32K x 8 SRAMs support and perform well in<br />
Pentium-based systems, the x32 organization is touted as the primary second-level cache choice<br />
for Pentium-generation processors.<br />
INTEGRATED CIRCUIT ENGINEERING CORPORATION 7-29<br />
20108
<strong>MOS</strong> <strong>Memory</strong> <strong>Market</strong> <strong>Trends</strong><br />
Millions of Dollars<br />
With unit shortages and high margins associated with SRAMs, several vendors not previously<br />
associated with SRAM production plan to enter the market. Atmel linked with Paradigm<br />
Technology in a technology exchange program and may enter the business soon. Also, Intel plans<br />
to supply a significant portion of SRAMs for its Pentium Pro processor.<br />
Among those increasing production is Integrated Device Technology (IDT), which announced<br />
intentions to add five times as much SRAM capacity by the end of 1Q96 as it had during the worst<br />
part of the SRAM shortage. Additionally, Cypress announced plans to boost production of its<br />
most popular high-speed, low-voltage SRAMs in 4Q95, a move that could put downward pressure<br />
on SRAM prices in 1996.<br />
Many Korean and Japanese vendors increased their SRAM output and several Taiwanese suppliers<br />
cut their 256K and 512K SRAM prices by up to 20 percent in late 3Q95. <strong>The</strong>se factors may help<br />
balance SRAM supply with market demand in 1996. Furthermore, with more vendors producing<br />
SRAM devices, the potential exists for a buyer’s bonanza in 1996.<br />
Figure 7-46 shows the quarterly SRAM dollar volume, unit volume, and ASP data from 1990<br />
through 1995. In terms of unit growth rates, the SRAM industry has not always been a big winner.<br />
But, that is expected to change in the second half of the decade as demand for high-perfor-<br />
7-30<br />
16,000<br />
14,000<br />
12,000<br />
10,000<br />
8,000<br />
6,000<br />
4,000<br />
2,000<br />
0<br />
1991<br />
Source: ICE, "Status 1996"<br />
= Dollars<br />
= Percent Change<br />
1992<br />
1993<br />
1994<br />
1995 1996<br />
Year<br />
1997<br />
Figure 7-45. SRAM <strong>Market</strong> Growth<br />
1998<br />
1999<br />
2000<br />
INTEGRATED CIRCUIT ENGINEERING CORPORATION<br />
60<br />
55<br />
50<br />
45<br />
40<br />
35<br />
30<br />
25<br />
20<br />
15<br />
10<br />
Percent Change<br />
20118A
<strong>MOS</strong> <strong>Memory</strong> <strong>Market</strong> <strong>Trends</strong><br />
mance synchronous SRAMs grows. SRAM unit numbers are forecast to increase greatly in 1995<br />
(Figure 7-47). Unit growth will extend into 1996 as systems manufacturers continue to demand<br />
fast SRAMs and IC vendors provide additional capacity to meet that demand.<br />
Billings in Millions<br />
1800<br />
1600<br />
1400<br />
1200<br />
1000<br />
800<br />
600<br />
400<br />
200<br />
0<br />
$3.97<br />
560<br />
142<br />
ASP<br />
Dollar Volume<br />
Unit Volume<br />
1Q 2Q 3Q 4Q 1Q 2Q 3Q 4Q 1Q 2Q 3Q 4Q 1Q 2Q 3Q 4Q 1Q 2Q 3Q 4Q 1Q 2Q 3Q 4Q<br />
(EST)<br />
1990 1991 1992 1993 1994 1995<br />
Source: ICE, "Status 1996"<br />
Year<br />
17851G<br />
Figure 7-46. 1990-1995 SRAM <strong>Market</strong><br />
Unit shipment by density is plotted from 1991 through 1996 in Figure 7-48. While high-density is<br />
a key issue with several other memory products, it is not the highest concern for purchasers of<br />
SRAM. In fact, as shown in the figure, the 64K and smaller category was the dominate category<br />
in terms of unit shipments for many years. <strong>The</strong> 256K density had the highest shipment volume<br />
beginning only in 1994. Further, the 1M density is forecast to outship 64Ks to become the second<br />
highest shipped density in 1996.<br />
SRAM consumption by geographic region is shown in Figure 7-49. Though the North American<br />
region is forecast to remain the leading consumer of SRAMs in 1995, an impressive gain is forecast<br />
for the ROW region largely due to demand for PCs (motherboards) and other systems in that<br />
region.<br />
Meanwhile, SRAM production is forecast to remain firmly in control of Japanese suppliers even<br />
though its share was estimated to be down eight percentage points in 1995 (Figure 7-50). ICE<br />
expects Japan to continue with its solid lock on worldwide SRAM manufacturing. Nevertheless,<br />
it will have to watch as the ROW contributes more to worldwide SRAM production.<br />
INTEGRATED CIRCUIT ENGINEERING CORPORATION 7-31<br />
1,701<br />
$5.32<br />
320<br />
5.80<br />
5.40<br />
5.00<br />
4.60<br />
4.20<br />
3.80<br />
3.40<br />
3.00<br />
ASP ($)
<strong>MOS</strong> <strong>Memory</strong> <strong>Market</strong> <strong>Trends</strong><br />
7-32<br />
Millions of Units<br />
1,600<br />
1,400<br />
1,200<br />
1,000<br />
800<br />
600<br />
400<br />
200<br />
0<br />
1991<br />
Source: ICE, "Status 1996"<br />
Millions of Units<br />
700<br />
600<br />
500<br />
400<br />
300<br />
200<br />
100<br />
0<br />
1991<br />
Source: ICE, "Status 1996"<br />
= Units<br />
= Percent Change<br />
1992<br />
≤ 64K<br />
256K<br />
≥1M<br />
1993<br />
1994<br />
1995 1996<br />
Year<br />
1997<br />
1998<br />
Figure 7-4<strong>7.</strong> SRAM Unit Shipment Forecast<br />
1992<br />
1993<br />
Year<br />
1994<br />
1995<br />
(EST)<br />
Figure 7-48. Yearly Unit Shipments of Mainstream SRAM<br />
1999<br />
2000<br />
1996<br />
(FCST)<br />
20121B<br />
–10<br />
–20<br />
INTEGRATED CIRCUIT ENGINEERING CORPORATION<br />
50<br />
40<br />
30<br />
20<br />
10<br />
0<br />
Percent Change<br />
20120A
Japanese<br />
Companies<br />
62%<br />
European<br />
Companies<br />
3%<br />
Source: ICE, "Status 1996"<br />
1994<br />
$3.8B<br />
North<br />
America<br />
39%<br />
(41%)<br />
( ) = 1994 share<br />
Source: ICE, "Status 1996"<br />
1995 (EST)<br />
$6.0B<br />
ROW<br />
24%<br />
(16%)<br />
Japan<br />
23%<br />
(27%)<br />
Europe<br />
14%<br />
(16%)<br />
<strong>MOS</strong> <strong>Memory</strong> <strong>Market</strong> <strong>Trends</strong><br />
<strong>The</strong> leading SRAM suppliers are shown in Figure 7-51. Leading this field was Samsung, followed<br />
by Hitachi, NEC, Motorola, and Toshiba. Samsung has not been content to only be the world’s<br />
leading DRAM supplier. It has worked aggressively to place itself in the number one position in<br />
the SRAM market as well. Based on added capacity, ICE estimates that Samsung’s SRAM sales<br />
came in at approximately $720 million versus Hitachi’s $675 million for 1995.<br />
Not long ago, the concept of a low-power, fast SRAM was an oxymoron. Today, however, low<br />
power and blazing speed mix well in the SRAM arena. <strong>The</strong> growth of powerful new applications,<br />
portable systems, and energy conservation have fueled demand for low-power features in nearly<br />
all SRAMs. Figure 7-52 shows several vendors and the SRAMs they offer that feature high speed<br />
and low power.<br />
INTEGRATED CIRCUIT ENGINEERING CORPORATION 7-33<br />
13575M<br />
Figure 7-49. Regional <strong>MOS</strong> SRAM Consumption<br />
North<br />
American<br />
Companies<br />
25%<br />
ROW Companies<br />
10%<br />
Japanese<br />
Companies<br />
47%<br />
European<br />
Companies<br />
3%<br />
Figure 7-50. Worldwide <strong>MOS</strong> SRAM Production<br />
1995 (EST)<br />
$6.0B<br />
ROW<br />
Companies<br />
20%<br />
North<br />
American<br />
Companies<br />
30%<br />
13576L
<strong>MOS</strong> <strong>Memory</strong> <strong>Market</strong> <strong>Trends</strong><br />
7-34<br />
Company Configuration<br />
Fujitsu<br />
Hitachi<br />
Micron<br />
Mitsubishi<br />
Motorola*<br />
NEC*<br />
Samsung<br />
Toshiba<br />
2K x 36<br />
32K x 32<br />
128K x 8<br />
32K x 32<br />
32K x 36<br />
64K x 18<br />
128K x 8<br />
256K x 4<br />
128K x 8<br />
32K x 36<br />
128K x 8<br />
32K x 32<br />
128K x 8<br />
32K x 32<br />
128K x 8<br />
256K x 16<br />
Rank<br />
1<br />
2<br />
3<br />
4<br />
5<br />
6<br />
7<br />
8<br />
9<br />
10<br />
Company<br />
Samsung<br />
Hitachi<br />
Motorola<br />
NEC<br />
Toshiba<br />
IDT<br />
Mitsubishi<br />
Cypress<br />
Sony<br />
Alliance<br />
Others<br />
Total<br />
Source: ICE, "Status 1996"<br />
1995 Sales<br />
($M,EST)<br />
810<br />
675<br />
505<br />
480<br />
450<br />
350<br />
310<br />
300<br />
265<br />
260<br />
1,595<br />
6,000<br />
20129A<br />
Figure 7-51. 1995 Leading SRAM Suppliers<br />
Speed<br />
(ns)<br />
10 - 15<br />
10 - 15<br />
15 - 20<br />
8 - 12<br />
6 - 8<br />
6 - 8<br />
15 - 25<br />
15 - 25<br />
15<br />
5<br />
70 - 100<br />
8 - 12<br />
55<br />
9<br />
70 - 100<br />
70 - 100<br />
Lowest Standby<br />
Power<br />
(mW)<br />
33<br />
33<br />
10<br />
82.5<br />
<strong>7.</strong>2<br />
<strong>7.</strong>2<br />
0.5<br />
0.5<br />
23<br />
33<br />
0.025<br />
6.6<br />
0.25<br />
16.5<br />
0.045<br />
0.09<br />
Sleep<br />
Mode<br />
No<br />
No<br />
Yes<br />
Yes<br />
Yes<br />
Yes<br />
Yes<br />
Yes<br />
No<br />
No<br />
No<br />
No<br />
No<br />
Yes<br />
No<br />
No<br />
Package<br />
100-pin QFP<br />
100-pin QFP<br />
32-pin SOJ<br />
100-pin QFP<br />
100-pin TQFP<br />
100-pin TQFP, 52-pin PLCC<br />
32-pin TSOP, DIP, SOJ<br />
28-pin DIP, SOJ<br />
32-pin SOJ<br />
100-pin TQFP<br />
32-pin Mini Flat Pack, TSOP<br />
100-pin TQFP<br />
32-pin TSOP, SOIC, DIP<br />
100-pin TQFP<br />
32-pin DIP, SOP, TSOP<br />
54-pin TSOP<br />
* Developing SRAMs with sleep mode<br />
Source: Electronic Business Buyer/ICE, "Status 1996" 20352<br />
Figure 7-52. Comparison of High-Speed and Low-Power SRAMs<br />
INTEGRATED CIRCUIT ENGINEERING CORPORATION
Fast SRAMs ( 35ns) are specifically targeted to high-end applications such as workstations or PCs<br />
with speedy processors. Smaller, North American companies long excelled in this market but<br />
larger SRAM manufacturers have moved in. <strong>The</strong> listing of leading suppliers in this market is<br />
shown in Figure 7-53.<br />
Rank Company<br />
As microprocessors race to ever higher clock rates, some have argued that the only way for<br />
SRAMs to keep pace is to make them using BiC<strong>MOS</strong> technology (Figure 7-54). While BiC<strong>MOS</strong> has<br />
its advantages, ICE believes that C<strong>MOS</strong> is and will remain the primary SRAM technology. This is<br />
especially true for the vast majority of the standard SRAM market.<br />
Asynchronous versus Synchronous SRAMs<br />
1<br />
2<br />
3<br />
4<br />
5<br />
6<br />
7<br />
8<br />
9<br />
10<br />
Samsung<br />
Toshiba<br />
Motorola<br />
Alliance<br />
Cypress<br />
IDT<br />
Micron<br />
Hitachi<br />
Sony<br />
Winbond<br />
Source: ICE, "Status 1996"<br />
1995 Sales<br />
($M, EST)<br />
<strong>MOS</strong> <strong>Memory</strong> <strong>Market</strong> <strong>Trends</strong><br />
Asynchronous and synchronous SRAMs are used in many applications but each is primarily<br />
implemented in computer systems. Traditional (asynchronous) SRAMs are not synchronized with<br />
the clock frequency of the MPU and work fine in computers that operate with MPUs that run<br />
slower than about 50MHz. Asynchronous SRAMs are unable to achieve the speeds and densities<br />
required for high-performance systems.<br />
Synchronous (also called specialty) SRAMs are those whose clock frequency is synchronized with<br />
the MPU’s clock speed. <strong>The</strong>y are much better matched for processors that operate at higher levels<br />
(i.e., 66MHz and beyond). Synchronous SRAMs have registers for holding information such<br />
as data and control signals, which frees other elements of the memory device to prepare for the<br />
next access cycle. <strong>The</strong> registers allow synchronous devices to be at least 20 percent faster than<br />
their asynchronous counterparts. <strong>The</strong> SRAM market is moving to synchronous SRAMs.<br />
INTEGRATED CIRCUIT ENGINEERING CORPORATION 7-35<br />
430<br />
300<br />
280<br />
260<br />
225<br />
175<br />
165<br />
150<br />
100<br />
70<br />
20105<br />
Figure 7-53. 1995 Fast ( 35ns) SRAM <strong>Market</strong>share
<strong>MOS</strong> <strong>Memory</strong> <strong>Market</strong> <strong>Trends</strong><br />
Synchronous SRAMs are being produced in large numbers. Access times are generally in the 10ns<br />
to 15ns range and low-voltage models are becoming popular as well. Figure 7-55 shows the product<br />
lifecycle of some very fast synchronous and asynchronous SRAMs.<br />
7-36<br />
Asynchronous<br />
Synchronous<br />
Percent<br />
100<br />
80<br />
60<br />
40<br />
20<br />
0<br />
C<strong>MOS</strong><br />
95%<br />
BiC<strong>MOS</strong> 5%<br />
≥15ns<br />
Source: ICE, "Status 1996"<br />
C<strong>MOS</strong><br />
50%<br />
BiC<strong>MOS</strong><br />
50%<br />
10ns<br />
Speed<br />
C<strong>MOS</strong> 5%<br />
BiC<strong>MOS</strong><br />
95%<br />
Applications<br />
Besides serving as cache needs in computer systems, SRAMs are giving a boost to the floppy disk<br />
drive, LAN, modem, and fax machine markets. For Hitachi, disk array systems and local storage<br />
in telecommunications systems demand high volumes of fast (55ns), applications such as industrial control, telecommunications, and PCMCIA card markets<br />
that demand long life and volume support with a variety of densities will continue to boost<br />
growth. Figure 7-56 lists some of the major SRAM applications.<br />
PC/Office<br />
Automation<br />
Other Computer<br />
Industrial/Other<br />
Military<br />
Telecom<br />
Consumer<br />
Total<br />
Source: ICE, "Status 1996"<br />
1993<br />
$3,295M<br />
41%<br />
20%<br />
15%<br />
1996<br />
$7,200M<br />
2000<br />
$15,050M<br />
In the military market, SRAMs have been anything but static. Vendors continue to improve their<br />
offerings with smaller and faster devices. SRAMs are used in mission computers on airplanes and<br />
combat vehicles, in radar and sonar systems, smart bombs, pattern recognition, and portable communications<br />
equipment.<br />
Tight defense budgets mean fewer major weapons platforms being built. However, there is room<br />
for technically sophisticated retrofits, which will lead to continued SRAM sales to the military.<br />
Additional highlights of the 1995 SRAM market are shown below.<br />
7%<br />
10%<br />
7%<br />
100%<br />
<strong>MOS</strong> <strong>Memory</strong> <strong>Market</strong> <strong>Trends</strong><br />
• With sales of it SRAM products soaring, Alliance Semiconductor disclosed plans to enter into<br />
a wafer foundry agreement with S3 and United Microelectronics Corp. (UMC) in Taiwan.<br />
Alliance will have a 20 percent share in the joint venture, which will be formed as a separate<br />
company. It is expected to commence volume production in 199<strong>7.</strong><br />
INTEGRATED CIRCUIT ENGINEERING CORPORATION 7-37<br />
48%<br />
26%<br />
11%<br />
3%<br />
7%<br />
5%<br />
100%<br />
Figure 7-56. SRAM Applications<br />
52%<br />
28%<br />
8%<br />
1%<br />
8%<br />
3%<br />
100%<br />
18785D
<strong>MOS</strong> <strong>Memory</strong> <strong>Market</strong> <strong>Trends</strong><br />
• Despite its strategic moves into commodity memory markets, Cypress Semiconductor<br />
showed it intended to remain in the FIFO market. <strong>The</strong> company introduced several new<br />
synchronous FIFO devices that focus on space-saving packages, low power, and 100MHz<br />
performance.<br />
• Considering the future of higher performance workstations with parallel processing capabilities,<br />
Hitachi revealed its 1M synchronous SRAM that runs at 167MHz for RISC-based<br />
CPUs. It also announced that it would bypass development of a 2M follow-on part and<br />
instead move directly to fast 4M devices in the 1997 time period.<br />
• Integrated Device Technology (IDT) announced plans to boost production of its popular 3V,<br />
25ns 32K x 8 SRAMs by a factor of five by March 1996. Demand for the cache SRAMs has<br />
soared since Intel ramped production of its 3.3V Pentiums that work with low-power cache.<br />
• NEC unveiled its 1M synchronous BiC<strong>MOS</strong> SRAM with an access time of 3ns. Different versions<br />
support processor speeds of 143MHz, 166MHz, 182MHz, and 200MHz. All have 3V<br />
interfaces and support cache-and-buffer-memory applications in very high-performance<br />
workstations.<br />
• Simtek Corp. and Zentrum Microelectronik Dresden GmbH plan to create a “joint task force”<br />
to complete development and introduction of 64K and 256K non-volatile SRAMs using an<br />
0.8µm process at ZMD’s wafer fab in Dresden.<br />
• Sony unveiled a high-speed family of synchronous SRAMs that integrate input registers,<br />
output registers, and self-timed write logic on a single chip. <strong>The</strong> five SRAMs are optimized<br />
for use as primary and secondary cache memory with SPARC, Pentium, Hewlett-Packard<br />
PA-8000 and other workstation RISC processors.<br />
DRAMs<br />
<strong>The</strong> DRAM market continued to stun industry observers with its size and strength. For the past<br />
three years (1993-1995) the DRAM market displayed relentless growth. Few suppliers can recall<br />
memory demand ever being stronger over such a long time period. <strong>The</strong> vigorous U.S. PC market<br />
has been the backbone of solid DRAM growth. Even as new capacity was added worldwide, memory-hungry<br />
systems manufacturers kept DRAM vendors struggling to keep pace with demand.<br />
DRAM market history and forecast through the 1990’s is displayed in Figure 7-5<strong>7.</strong> ICE estimates<br />
the DRAM market grew 74 percent in 1995. This follows 78 percent growth in 1994 and 54 percent<br />
growth in 1993. For a mature market to grow as much as the DRAM market did since 1993<br />
is a rarity. <strong>The</strong> percentage increases are all the more impressive considering the DRAM market<br />
was very sizable ($13.1 billion) to begin with in 1993.<br />
7-38<br />
INTEGRATED CIRCUIT ENGINEERING CORPORATION
Millions of Dollars<br />
140,000<br />
130,000<br />
120,000<br />
110,000<br />
100,000<br />
90,000<br />
80,000<br />
70,000<br />
60,000<br />
50,000<br />
40,000<br />
30,000<br />
20,000<br />
10,000<br />
0<br />
6,605<br />
1991<br />
Source: ICE, "Status 1996"<br />
8,525<br />
13,140<br />
23,420<br />
40,700<br />
–1% 29% 54% 78% 74%<br />
1992<br />
1993<br />
1994<br />
1995<br />
<strong>MOS</strong> <strong>Memory</strong> <strong>Market</strong> <strong>Trends</strong><br />
As shown in Figure 7-58, the DRAM market doubled in size from 1991 to 1993, then tripled in size<br />
from 1993 to 1995! <strong>The</strong> DRAM market has been so strong and grown so fast that 4Q95 sales were<br />
nearly the size of the total DRAM market of 1993! During the decade of the 1990’s (1991-2000),<br />
ICE forecasts that the cumulative average annual growth rate for DRAMs will be 40 percent!<br />
In 1991, the DRAM market was only 14 percent of the total IC market (Figure 7-59). Beginning in<br />
1993, the DRAM market accounted for a larger percentage of the total IC market. ICE estimates<br />
that DRAMs accounted for 35 percent of all IC sales in 4Q95.<br />
Displayed in Figure 7-60 are the DRAM market trends through the first half of the 1990’s. <strong>The</strong> dramatic<br />
upswing in market size and ASPs reflects unprecedented worldwide demand by PC OEMs<br />
and the industry’s inability to adequately supply the market with the DRAMs it demanded.<br />
DRAM scarcity of the past several years can be traced back to 1992 when the first of several key<br />
events took place. First, in the early 1990’s, Japanese DRAM producers, hit with a severe domestic<br />
recession, cut back on wafer fab expansion. Second, some producers de-emphasized DRAMs,<br />
INTEGRATED CIRCUIT ENGINEERING CORPORATION 7-39<br />
Year<br />
50,075<br />
1996<br />
Figure 7-5<strong>7.</strong> DRAM <strong>Market</strong> <strong>Trends</strong><br />
57,715<br />
1997<br />
75,265<br />
1998<br />
100,595<br />
1999<br />
136,780<br />
23% 15% 30% 34% 36%<br />
2000<br />
13033R
<strong>MOS</strong> <strong>Memory</strong> <strong>Market</strong> <strong>Trends</strong><br />
and third, DRAM manufacturers mistakenly produced x4 organization 16M parts when the market<br />
wanted x16 16M chips. Further, the move to 16M chips was stalled because manufacturers had<br />
yield problems on their sub-0.5µm processes and difficulty transitioning to 3V from 5V devices.<br />
SEGMENT<br />
DRAM <strong>Market</strong> ($B)<br />
Throw in the fact that the yen gained considerable strength versus the dollar, the popular, yet<br />
memory-hungry Windows95 software was introduced, and wide varieties of “alternative” (and<br />
higher priced) DRAMs were introduced to more closely match DRAM performance with increasing<br />
system needs (Figures 7-61 and 7-62), and it is no wonder the DRAM market exploded.<br />
7-40<br />
Millions of Dollars<br />
DRAM Percent of<br />
IC <strong>Market</strong> (Dollars)<br />
Source: WSTS/ICE, "Status 1996"<br />
45,000<br />
40,000<br />
35,000<br />
30,000<br />
25,000<br />
20,000<br />
15,000<br />
10,000<br />
5,000<br />
0<br />
Source: ICE, "Status 1996"<br />
1.6<br />
15%<br />
6,605<br />
13,140<br />
2x 3x<br />
40,700<br />
1991 1993 1995<br />
Year<br />
(EST)<br />
Figure 7-58. DRAM <strong>Market</strong> Experiences Aggressive Growth<br />
2.6<br />
18%<br />
20003B<br />
1Q 2Q 3Q 4Q 1Q 2Q 3Q 4Q 1Q 2Q 3Q 4Q 1Q 2Q 3Q 4Q 1Q<br />
1.6<br />
14%<br />
1991 1992 1993<br />
1.6<br />
14%<br />
1.7<br />
15%<br />
1.9<br />
17%<br />
2.0<br />
17%<br />
2.2<br />
17%<br />
2.4<br />
17%<br />
3.0<br />
19%<br />
3.6<br />
20%<br />
4.0<br />
22%<br />
4.4<br />
23%<br />
Figure 7-59. Quarterly DRAM <strong>Market</strong> (1991-1995)<br />
1994<br />
INTEGRATED CIRCUIT ENGINEERING CORPORATION<br />
5.4<br />
25%<br />
6.3<br />
27%<br />
<strong>7.</strong>3<br />
29%<br />
8.0<br />
29%<br />
2Q<br />
9.6<br />
31%<br />
1995<br />
3Q<br />
10.8<br />
33%<br />
4Q<br />
(EST)<br />
12.3<br />
35%<br />
14520N
Billings in Millions<br />
13,000<br />
12,000<br />
11,000<br />
10,000<br />
9,000<br />
8,000<br />
7,000<br />
6,000<br />
5,000<br />
4,000<br />
3,000<br />
2,000<br />
1,000<br />
0<br />
1,580<br />
$4.65<br />
340<br />
Unit Volume<br />
<strong>MOS</strong> <strong>Memory</strong> <strong>Market</strong> <strong>Trends</strong><br />
INTEGRATED CIRCUIT ENGINEERING CORPORATION 7-41<br />
ASP<br />
Dollar Volume<br />
12,335<br />
$18.98<br />
1Q 2Q 3Q 4Q 1Q 2Q 3Q 4Q 1Q 2Q 3Q 4Q 1Q 2Q 3Q 4Q 1Q 2Q 3Q 4Q 1Q 2Q 3Q 4Q<br />
(EST)<br />
1990 1991 1992 1993 1994 1995<br />
Year<br />
Source: ICE, "Status 1996"<br />
17852G<br />
Figure 7-60. 1990-1995 DRAM <strong>Market</strong> <strong>Trends</strong><br />
VRAMs<br />
Specialty VRAMs<br />
Synchronous VRAMs<br />
Wide VRAMs<br />
Standard VRAMs<br />
Generic DRAMs<br />
Time<br />
Revolutionary<br />
Evolutionary<br />
Wide<br />
Low-power<br />
Rambus<br />
DRAMs<br />
650<br />
EDRAM<br />
SDRAM<br />
CDRAM<br />
Generic EDO<br />
Source: Micro Design Resources/Computer Design/ICE, "Status 1996" 19842<br />
Figure 7-61. DRAM <strong>Market</strong> Moving Toward Fragmentation<br />
20.00<br />
19.00<br />
18.00<br />
1<strong>7.</strong>00<br />
16.00<br />
15.00<br />
14.00<br />
13.00<br />
12.00<br />
11.00<br />
10.00<br />
9.00<br />
8.00<br />
<strong>7.</strong>00<br />
6.00<br />
5.00<br />
4.00<br />
ASP ($)
<strong>MOS</strong> <strong>Memory</strong> <strong>Market</strong> <strong>Trends</strong><br />
<strong>The</strong> question that many are now asking is, “How long will the DRAM market continue its strong<br />
upward ways?” ICE believes that system manufacturers’ needs will provide solid DRAM growth<br />
at least through the year 2000. 16M DRAMs have started to ramp in suitable configurations for<br />
PC systems. Moreover, the eventual move to 64-bit buses and the growing array of application<br />
software that requires more memory will keep DRAM demand strong.<br />
<strong>The</strong> DRAM market looks so promising, in fact, that Motorola, for years a sideline player in the<br />
DRAM business, announced that it joined the IBM-Siemens-Toshiba DRAM R&D team to develop<br />
a gigabit-generation memory. Motorola also plans to build a $1.5 billion DRAM fab in the<br />
United States in partnership with Siemens.<br />
DRAM consumption continued to be greatest in North America (Figure 7-63). In 1995, North<br />
America’s insatiable appetite for DRAMs helped it account for 36 percent of the market. 1995 was<br />
the first year that DRAM consumption in the ROW region surpassed that in Japan. Consumer<br />
electronic and PC-related work (assembly, packaging, test) in the ROW region provided the major<br />
thrust behind the jump in consumption.<br />
7-42<br />
Application Definition<br />
3DRAM<br />
Burst EDO<br />
CDRAM<br />
EDO DRAM<br />
EDRAM<br />
Fast Page Mode<br />
MDRAM<br />
RDRAM<br />
SDRAM<br />
SGRAM<br />
VRAM<br />
WDRAM<br />
Source: ICE, "Status 1996"<br />
Cache DRAM with on-board ALU for 3-D graphic functions.<br />
EDO plus a counter to transfer a linearly addressed string of data.<br />
Cache DRAM; internal SRAM cache added to DRAM.<br />
Extended Data Out DRAM, also called hyperpage;<br />
a modification of fast page mode to hold data after CAS goes high, allowing<br />
faster CAS cycles.<br />
Enhanced DRAM; very fast DRAM cells directly mapped to SRAM cache.<br />
A modification of the basic DRAM to allow multiple column<br />
accesses from a single row access.<br />
Multibank DRAM; a collection of smaller, fast blocks of DRAM with<br />
on-chip interleaving pipelining.<br />
Rambus DRAM; specialized interface and 500MHz 8-bit wide bus<br />
controller plus on-chip interleaving.<br />
Synchronous DRAM; a standard DRAM with all functions referenced<br />
to the system clock, burst output mode.<br />
Synchronous Graphics DRAM; an SDRAM with block write and write per bit.<br />
Video RAM; dual-port or multi-port RAM.<br />
Window DRAM; a modification of VRAM to reduce internal complexity.<br />
Figure 7-62. Application-Specific DRAM Glossary<br />
20035<br />
INTEGRATED CIRCUIT ENGINEERING CORPORATION
North<br />
America<br />
36%<br />
Source: ICE, "Status 1996"<br />
1995 (EST)<br />
$40.7B<br />
Europe<br />
19%<br />
Japan<br />
22%<br />
<strong>MOS</strong> <strong>Memory</strong> <strong>Market</strong> <strong>Trends</strong><br />
In contrast, DRAM production remained firmly in the hands of the Japanese (Figure 7-64),<br />
although the ROW region continued to harvest additional marketshare in 1995. Perhaps more<br />
interesting to note is that North American DRAM production went from 12 percent in 1993 to 15<br />
percent in 1994 and 1995.<br />
Projecting out current trends in regional production through the year 2005, it appears that ROWbased<br />
manufacturers could very well be supplying a greater percentage of DRAMs to the worldwide<br />
market than their Japanese counterparts (Figure 7-65). Equally-efficient manufacturing<br />
prowess, generally lower labor costs, and a market clamoring for electronic goods are factors that<br />
will contribute to the growth in DRAM production in the ROW region.<br />
Figure 7-66 shows that in terms of units, DRAM shipments still follow a reasonable bell-curve format,<br />
although that bell may be a bit wider than market watchers are used to seeing. <strong>The</strong> decline<br />
tails of the curve now cover a wider span of years. Longer lifecycles, at least on the “tail end” will<br />
likely be the trend for 16M, 64M, and most future DRAM generations.<br />
INTEGRATED CIRCUIT ENGINEERING CORPORATION 7-43<br />
ROW<br />
23%<br />
12001S<br />
Figure 7-63. Worldwide DRAM Consumption<br />
European<br />
Companies<br />
3%<br />
Japanese<br />
Companies<br />
49%<br />
Source: ICE, "Status 1996"<br />
1995 (EST)<br />
$40.7B<br />
North American<br />
Companies<br />
15%<br />
ROW<br />
Companies<br />
33%<br />
18922D<br />
Figure 7-64. Worldwide DRAM Production
<strong>MOS</strong> <strong>Memory</strong> <strong>Market</strong> <strong>Trends</strong><br />
Price trends for several DRAM densities are provided in Figure 7-6<strong>7.</strong> It is rare for a particular<br />
product to have a significant ASP increase, especially during its “mature” stage, but that’s exactly<br />
what happened to the 1M DRAM market in 1993 and 1994. Perhaps more amazing is the fact<br />
that demand at the 4M level kept ASPs essentially flat for four years (Figure 7-68).<br />
Figure 7-69 shows the DRAM market size, unit shipments, and ASP for five of the most popular<br />
DRAM densities. <strong>The</strong> 4M DRAM market is forecast to lose its dominance to the 16M density in<br />
1996. ICE estimates that 1995 unit shipments for the five DRAM densities increased 28 percent<br />
and are forecast to increase eight percent in 1996 on the strength of growing 16M shipments.<br />
DRAM applications remained largely oriented to the computer industry (Figure 7-70). ICE estimates<br />
that 50 percent of DRAM production was for PC main memory. <strong>The</strong> percentage of DRAMs<br />
used in computers is much larger than 50 percent if one includes workstations along with graphics<br />
and video applications.<br />
DRAMs serving as embedded memory present a solution to one of the biggest challenges facing<br />
PCs today—accessing data from memory at speeds fast enough to support multimedia functions.<br />
Silicon Magic, a startup, announced that it will offer a chip (the Mas-H) that combines graphics<br />
and audio and video functions with DRAM beginning in 2Q96. Silicon Magic joins NeoMagic and<br />
Cirrus Logic with embedded memory devices (Figure 7-71).<br />
7-44<br />
<strong>Market</strong>share (Percent)<br />
70<br />
60<br />
50<br />
40<br />
30<br />
20<br />
10<br />
0<br />
1991<br />
Source: ICE, "Status 1996"<br />
1993<br />
1995<br />
1997 1999<br />
Year<br />
Japan<br />
ROW<br />
2001<br />
2003<br />
Figure 7-65. ROW to Overtake Japan in DRAM Production?<br />
2005<br />
20040<br />
INTEGRATED CIRCUIT ENGINEERING CORPORATION
64K<br />
256K<br />
1M<br />
4M<br />
16M<br />
64M<br />
Millions of Units<br />
1,800<br />
1,600<br />
1,400<br />
1,200<br />
1,000<br />
800<br />
600<br />
400<br />
200<br />
0<br />
1991<br />
1M 827<br />
4M 145<br />
16M 0.1<br />
64M —<br />
Source: ICE, "Status 1996"<br />
3.84<br />
51.20<br />
—<br />
—<br />
—<br />
—<br />
Source: ICE, "Status 1996"<br />
1.92<br />
21.76<br />
—<br />
—<br />
—<br />
—<br />
1.28<br />
3.58<br />
100.00<br />
—<br />
—<br />
—<br />
1M<br />
4M<br />
16M<br />
64M<br />
1992<br />
822<br />
457<br />
2<br />
—<br />
0.90<br />
2.25<br />
35.00<br />
—<br />
—<br />
—<br />
1993<br />
596<br />
776<br />
20<br />
—<br />
1994<br />
500<br />
1,254<br />
103<br />
0.1<br />
1995<br />
470<br />
1,645<br />
318<br />
0.25<br />
<strong>MOS</strong> <strong>Memory</strong> <strong>Market</strong> <strong>Trends</strong><br />
INTEGRATED CIRCUIT ENGINEERING CORPORATION 7-45<br />
Year<br />
1996<br />
320<br />
1,500<br />
835<br />
4<br />
1997<br />
160<br />
1,150<br />
1,310<br />
65<br />
Figure 7-66. DRAM Lifecycle by Density<br />
1983 1984 1985 1986 1987 1988 1989 1990 1991<br />
1.09<br />
2.41<br />
25.00<br />
—<br />
—<br />
—<br />
1992<br />
1.47 1.59 1.25 1.33 1.45<br />
3.84 3.58 2.69 1.80 1.70<br />
1<strong>7.</strong>00 12.00 5.54 4.50 3.01<br />
— 124.00 36.43 16.05 11.72<br />
— — — 275.00 205.00<br />
— — — — —<br />
Figure 7-6<strong>7.</strong> DRAM ASP <strong>Trends</strong> ($)<br />
1998<br />
90<br />
750<br />
1,495<br />
295<br />
1993<br />
—<br />
1.80<br />
3.10<br />
11.91<br />
93.50<br />
—<br />
1999<br />
45<br />
400<br />
1,500<br />
700<br />
1994<br />
—<br />
2.15<br />
3.60<br />
12.00<br />
61.85<br />
575.00<br />
2000<br />
20<br />
275<br />
1,275<br />
1,400<br />
20009B<br />
1995<br />
(EST)<br />
—<br />
2.00<br />
3.00<br />
12.98<br />
56.00<br />
225.00<br />
1996<br />
(FCST)<br />
—<br />
1.96<br />
2.80<br />
10.00<br />
40.00<br />
190.00<br />
16876J
<strong>MOS</strong> <strong>Memory</strong> <strong>Market</strong> <strong>Trends</strong><br />
4M DRAMs<br />
ICE believes that after several strong years, the 4M market finally peaked in 1995 by growing 42<br />
percent to $21.4 billion (Figure 7-72). Unit shipments will remain very strong for at least two more<br />
years, but lower ASPs will drive down the overall market.<br />
7-46<br />
ASP ($)<br />
18.00<br />
16.00<br />
14.00<br />
12.00<br />
10.00<br />
8.00<br />
6.00<br />
4.00<br />
2.00<br />
0.00<br />
256K<br />
1M<br />
4M<br />
1991<br />
$1.80<br />
$4.50<br />
$16.05<br />
Source: ICE, "Status 1996"<br />
256K<br />
1M<br />
4M<br />
16M<br />
64M<br />
TOTAL<br />
ASP<br />
($)<br />
2.15<br />
3.60<br />
12.00<br />
61.85<br />
575.00<br />
12.19<br />
Source: ICE, "Status 1996"<br />
1992<br />
$1.70<br />
$3.01<br />
$11.72<br />
1994<br />
UNITS<br />
(M)<br />
64<br />
500<br />
1,254<br />
103<br />
0.1<br />
1,921<br />
1993<br />
$1.80<br />
$3.10<br />
$11.91<br />
1994<br />
$2.15<br />
$3.60<br />
$12.00<br />
1995 1996<br />
Year<br />
$2.00<br />
$3.00<br />
$12.98<br />
$1.96<br />
$2.80<br />
$10.00<br />
1997<br />
$2.05<br />
$2.70<br />
$8.00<br />
Figure 7-68. DRAM ASP <strong>Trends</strong><br />
MARKET<br />
($M)<br />
139<br />
1,800<br />
15,048<br />
6,371<br />
62<br />
23,420<br />
ASP<br />
($)<br />
2.00<br />
3.00<br />
12.98<br />
56.00<br />
225.00<br />
16.55<br />
UNITS<br />
(M)<br />
MARKET<br />
($M)<br />
1998<br />
—<br />
$3.10<br />
$<strong>7.</strong>00<br />
256K<br />
1M<br />
4M<br />
1999<br />
—<br />
$3.25<br />
$6.50<br />
1995 (EST) 1996 (FCST)<br />
30<br />
470<br />
1,645<br />
318<br />
0.25<br />
2,463<br />
60<br />
1,410<br />
21,355<br />
17,820<br />
55<br />
40,700<br />
Figure 7-69. DRAM <strong>Market</strong> Forecast<br />
ASP<br />
($)<br />
1.96<br />
2.80<br />
10.00<br />
40.00<br />
190.00<br />
18.76<br />
UNITS<br />
(M)<br />
10<br />
320<br />
1,500<br />
835<br />
4<br />
2,669<br />
2000<br />
—<br />
$3.40<br />
$<strong>7.</strong>00<br />
20422<br />
MARKET<br />
($M)<br />
20<br />
895<br />
15,000<br />
33,400<br />
760<br />
50,075<br />
14749L<br />
INTEGRATED CIRCUIT ENGINEERING CORPORATION
Consumer Digital<br />
Video 7%<br />
Workstation/<br />
Servers 12%<br />
Miscellaneous<br />
13%<br />
Computer<br />
Graphics/Video<br />
18%<br />
Source: ICE, "Status 1996"<br />
Desktop/Laptop<br />
Main <strong>Memory</strong> 50%<br />
<strong>MOS</strong> <strong>Memory</strong> <strong>Market</strong> <strong>Trends</strong><br />
Typically (if the word can still be used to describe the memory market), as an IC moves through<br />
its product lifecycle, ASPs decline as unit shipments increase. That did not happen in the 4M market.<br />
In fact, the 4M ASP actually increased from an already inflated 1994 level. Not until 1996 are<br />
ASPs expected to resume a more normal migration along the price decline curve.<br />
<strong>The</strong> 4M DRAM leaders shown in Figure 7-73 cashed in on the voracious appetite of OEMs to use<br />
these devices in their systems. Though it elected to direct its focus on the 16M generation,<br />
Samsung still enjoyed another outstanding year of 4M DRAM sales. Korean manufacturers LG<br />
Semicon and Hyundai also became a greater force in the DRAM market with the 4M generation.<br />
Meanwhile NEC, Hitachi, and Toshiba continued to be strong performers. <strong>The</strong>se and other<br />
Japanese manufacturers squeezed out every last bit of capacity to produce the 4M parts. Two U.S.<br />
manufacturers, TI and Micron, also enjoyed outstanding DRAM growth on account of the 4M generation.<br />
INTEGRATED CIRCUIT ENGINEERING CORPORATION 7-47<br />
19288B<br />
Figure 7-70. 1995 DRAM Applications<br />
Company Product Application Availability<br />
Neo Magic<br />
Silicon Magic<br />
MagicGraph<br />
Max-H<br />
Graphics controller chip for<br />
notebook computers that<br />
has 1M of embedded DRAM<br />
IC that couples 1.25M of<br />
DRAM with VGA graphics<br />
acceleration, audio, and<br />
MPEG-1 decompression<br />
functions<br />
Cirrus Logic also developing a product utilizing embedded memory.<br />
Source: ICE, "Status 1996"<br />
Figure 7-71. Embedded <strong>Memory</strong> Arrives<br />
Now<br />
2Q96<br />
20426
<strong>MOS</strong> <strong>Memory</strong> <strong>Market</strong> <strong>Trends</strong><br />
Billings in Millions<br />
7-48<br />
25,000<br />
20,000<br />
15,000<br />
10,000<br />
5,000<br />
0<br />
4M Units<br />
ASP ($)<br />
<strong>Market</strong> ($M)<br />
$16.05<br />
2,328<br />
145<br />
Source: ICE, "Status 1996"<br />
1991<br />
145<br />
16.05<br />
2,328<br />
1992<br />
457<br />
11.72<br />
5,355<br />
ASP<br />
1993<br />
776<br />
11.91<br />
9,240<br />
1994<br />
1,254<br />
12.00<br />
15,048<br />
Unit Volume<br />
1995<br />
1,645<br />
12.98<br />
21,355<br />
Year<br />
1996<br />
1,500<br />
10.00<br />
15,000<br />
Dollar Volume<br />
1997<br />
1,150<br />
8.00<br />
9,200<br />
Figure 7-72. 4M DRAM <strong>Market</strong> <strong>Trends</strong><br />
Company<br />
Samsung<br />
NEC<br />
Micron<br />
Hitachi<br />
TI<br />
LG Semicon<br />
Toshiba<br />
Fujitsu<br />
Hyundai<br />
Siemens<br />
Others<br />
Total<br />
Source: ICE, "Status 1996"<br />
Units<br />
(M)<br />
206<br />
174<br />
173<br />
163<br />
141<br />
126<br />
112<br />
94<br />
88<br />
80<br />
290<br />
1,645<br />
Sales<br />
($M)<br />
2,675<br />
2,250<br />
2,240<br />
2,110<br />
1,830<br />
1,630<br />
1,455<br />
1,225<br />
1,135<br />
1,035<br />
3,770<br />
21,355<br />
20047<br />
1998<br />
750<br />
<strong>7.</strong>00<br />
5,250<br />
Figure 7-73. 1995 4M DRAM Leaders (EST)<br />
1999<br />
400<br />
6.50<br />
2,600<br />
$<strong>7.</strong>00<br />
1,925<br />
275<br />
2000<br />
275<br />
<strong>7.</strong>00<br />
1,925<br />
18.00<br />
1<strong>7.</strong>00<br />
16.00<br />
15.00<br />
14.00<br />
13.00<br />
12.00<br />
11.00<br />
10.00<br />
9.00<br />
8.00<br />
<strong>7.</strong>00<br />
6.00<br />
5.00<br />
4.00<br />
INTEGRATED CIRCUIT ENGINEERING CORPORATION<br />
ASP ($)<br />
20423
Selected highlights from the 4M DRAM market are shown below.<br />
<strong>MOS</strong> <strong>Memory</strong> <strong>Market</strong> <strong>Trends</strong><br />
• Six major Japanese DRAM suppliers, including NEC, Hitachi, and Toshiba, were churning<br />
out a combined total of 56 million 4M devices per month in 4Q95 to meet continued strong<br />
DRAM demand, chiefly from the PC industry.<br />
• In response to steady U.S. demand for 4M devices, Fujitsu boosted production at its<br />
Gresham, Oregon, facility after it discontinued production of 1M DRAMs at the site.<br />
• Hyundai introduced a new 4M DRAM that offers performance needed to compete with popular<br />
EDO DRAMs. Designed to maximize performance while minimizing power consumption,<br />
Hyundai targeted the device at graphics memory applications, emerging set-top boxes,<br />
and networking products that require memories with wide-word configurations.<br />
• Demand for 4M DRAMs remained strong at Micron resulting in record sales and earnings.<br />
As a result, it has moved ahead with plans to increase manufacturing capacity. Micron will<br />
convert its two 150mm DRAM lines to 200mm. Also, Micron announced it would build a<br />
$1.3 billion (200mm) manufacturing complex in Lehi, Utah. Once up and running, the new<br />
fab will be able to pump out 10,000 wafers per week.<br />
• MoSys revealed that its MDRAMs (Multibank DRAM) will be built using foundry capacity<br />
at Siemens, IDT, Oki, and TSMC. MoSys’ initial DRAM product features peak bandwidth<br />
performance of 660MB per second.<br />
• NEC shifted 4M DRAM production to its Scotland-based subsidiary when it started producing<br />
16M chips in the U.S. (Roseville, California). In the U.K., NEC produces about 4 million<br />
4M DRAM units per month.<br />
• NEC and Samsung plan to work together to manufacture DRAMs for the European market.<br />
NEC will supply 4M DRAMs in wafer and die form at the rate of 100,000 units/month from<br />
its fab in Scotland. Samsung will then package and test the devices at its back-end facility<br />
near Oporto, Portugal.<br />
• Samsung unofficially announced plans to build a $1.35 billion U.S.-based fab for memory<br />
and logic ICs. <strong>The</strong> new facility, to be located in Austin, Texas, will use 200mm wafers and<br />
begin by producing 16M and 64M DRAMs using 0.35µm process technology.<br />
• Toshiba began sampling 4M EDO DRAMs in 4Q95. <strong>The</strong> new DRAMs have 40 percent faster<br />
cycle times compared to conventional high-speed page-mode products. Volume shipment<br />
was slated to begin by the first of the year.<br />
INTEGRATED CIRCUIT ENGINEERING CORPORATION 7-49
<strong>MOS</strong> <strong>Memory</strong> <strong>Market</strong> <strong>Trends</strong><br />
16M DRAMs<br />
<strong>The</strong> move to 16M DRAMs started in 1994, but accelerated in 1995. Prolonged 4M demand and<br />
some early yield problems with 16M devices did not allow the market to escalate quite as quickly<br />
as originally forecast. But with factors such as the introduction of Windows95 and 16MB main<br />
memory desired in PCs, it appears this generation is ready to move forward and will surely pay<br />
off for those memory manufacturers who were set to satisfy initial demand.<br />
On the whole, 16M DRAMs remained higher priced on a per-bit basis in 1995 than their 4M predecessors.<br />
DRAMs designed with the 16M x 1 and 4M x 4 architectures were cheaper on a per-bit<br />
basis than some 4M devices. However, configurations such as the 1M x 16 and 2M x 8 remained<br />
more expensive. <strong>The</strong>y will likely experience a cross-over with 4M DRAMs in the 4Q95/1H96 time<br />
period. Once that occurs, 16M demand will take a sharp upswing, extending a temporary shortage<br />
of x16 16M DRAM parts. Figure 7-74 provides an indication of the organizational trends of<br />
16M DRAMs. <strong>The</strong> graph shows that in 1996, about half of all 16M devices will be organized as x8,<br />
x16, or be one of the many application-specific DRAMs discussed earlier.<br />
A complete review of market trends in the 16M DRAM segment is shown in Figure 7-75. ICE forecasts<br />
the 16M DRAM market to crest in 199<strong>7.</strong> Unit shipments are expected to peak in 1999, but<br />
due to price erosion, the size of the market will be smaller.<br />
7-50<br />
Percentage (%)<br />
100<br />
80<br />
60<br />
40<br />
20<br />
<br />
<br />
x1<br />
<br />
<br />
<br />
<br />
<br />
<br />
<br />
<br />
<br />
<br />
<br />
<br />
<br />
<br />
<br />
<br />
<br />
<br />
<br />
<br />
<br />
<br />
<br />
<br />
<br />
<br />
<br />
<br />
<br />
<br />
<br />
<br />
<br />
<br />
<br />
<br />
<br />
<br />
x4<br />
As <strong>Memory</strong><br />
(SDRAM, 3D-RAM)<br />
0<br />
1993 1994 1995 1996<br />
Year<br />
1997 1998 1999 2000<br />
Source: Mitsubishi/ICE, "Status 1996" 20428<br />
Figure 7-74. Organization Trend of 16M DRAM<br />
x8<br />
x16<br />
INTEGRATED CIRCUIT ENGINEERING CORPORATION
Billings in Millions<br />
40,000<br />
35,000<br />
30,000<br />
25,000<br />
20,000<br />
15,000<br />
10,000<br />
5,000<br />
0<br />
16M Units<br />
ASP ($)<br />
<strong>Market</strong> ($M)<br />
$275.00<br />
0.1<br />
Source: ICE, "Status 1996"<br />
28<br />
1991<br />
0.1<br />
275.00<br />
28<br />
1992<br />
2<br />
180.00<br />
360<br />
ASP<br />
1993<br />
20<br />
93.00<br />
1,860<br />
Figure 7-76 shows the leading 16M<br />
DRAM suppliers of 1995. Samsung<br />
established an early lead in this<br />
market segment. Part of Samsung’s<br />
strategy was to ramp down its production<br />
of 4M DRAMs in early 1995<br />
while increasing its level of 16M<br />
production throughout the year.<br />
In 1995, NEC targeted 65 percent of<br />
its DRAM business to PC main<br />
memory in the U.S. alone. <strong>The</strong> company<br />
anticipates digital set-top<br />
boxes as the new memory application<br />
to watch in 1996.<br />
1994<br />
103<br />
61.85<br />
6,371<br />
Unit Volume<br />
1995<br />
318<br />
56.00<br />
17,820<br />
Year<br />
<strong>MOS</strong> <strong>Memory</strong> <strong>Market</strong> <strong>Trends</strong><br />
INTEGRATED CIRCUIT ENGINEERING CORPORATION 7-51<br />
1996<br />
835<br />
40.00<br />
33,400<br />
Dollar Volume<br />
1997<br />
1,310<br />
30.00<br />
39,300<br />
Figure 7-75. 16M DRAM <strong>Market</strong> <strong>Trends</strong><br />
Company<br />
Samsung<br />
NEC<br />
Hitachi<br />
Toshiba<br />
Hyundai<br />
LG Semicon<br />
Mitsubishi<br />
Fujitsu<br />
Oki<br />
TI<br />
Others<br />
Total<br />
Source: ICE, "Status 1996"<br />
1998<br />
1,495<br />
25.00<br />
37,375<br />
62<br />
42<br />
40<br />
39<br />
27<br />
25<br />
25<br />
18<br />
11<br />
8<br />
21<br />
318<br />
1,275<br />
1999<br />
1,500<br />
22.00<br />
33,000<br />
Units (M) Sales ($M)<br />
3,480<br />
2,355<br />
2,215<br />
2,185<br />
1,515<br />
1,375<br />
1,375<br />
1,010<br />
615<br />
450<br />
1,245<br />
17,820<br />
26,138<br />
$20.50<br />
2000<br />
1,275<br />
20.50<br />
26,138<br />
20016<br />
Figure 7-76. 1995 16M DRAM Leaders (EST)<br />
300.00<br />
275.00<br />
250.00<br />
225.00<br />
200.00<br />
175.00<br />
150.00<br />
125.00<br />
100.00<br />
75.00<br />
50.00<br />
25.00<br />
0.00<br />
20424<br />
ASP ($)
<strong>MOS</strong> <strong>Memory</strong> <strong>Market</strong> <strong>Trends</strong><br />
Siemens hopes to be among the leading 16M DRAM suppliers soon after it opens its new 200mm<br />
wafer fab in Dresden. <strong>The</strong> facility will make 16M and, later, 64M DRAMs. <strong>The</strong> company will<br />
ramp production in 1996.<br />
<strong>The</strong> only two local DRAM houses in Taiwan were Mosel-Vitelic and Texas Instruments—until<br />
1995. Taiwan’s Vanguard International Semiconductor Corp., a new company based in Hsinchu,<br />
began making 4M and 16M DRAMs on a small scale beginning in 1995. Also, Nan Ya Plastics<br />
Corp., Taiwan’s largest printed circuit board manufacturer, started producing 16M and 64M<br />
DRAMs in late 1995 as part of a technology agreement with Oki Semiconductor. Further, a group<br />
headed by Taiwan’s Elitegroup Computer Systems Co. Ltd. said it would spend approximately<br />
$800 million to build a 200mm wafer fab and enter into the 16M DRAM market beginning in 1996<br />
or 199<strong>7.</strong><br />
Additional company and product highlights surrounding the 16M DRAM market are listed<br />
below.<br />
7-52<br />
• Projected volume increases, as well as manufacturing cost savings, should result in there<br />
being little or no premium charged for 3V 16M DRAMs compared with 5V 16Ms by the end<br />
of first quarter 1996. 3V price reductions, averaging about 10 to 15 percent, will encourage<br />
the rapid conversion of PC main memory to pure 3V systems. <strong>The</strong> trend for low-voltage<br />
16M DRAMs is shown in Figure 7-7<strong>7.</strong><br />
Percentage (%)<br />
100<br />
80<br />
60<br />
40<br />
20<br />
0<br />
<br />
<br />
<br />
<br />
<br />
<br />
<br />
<br />
<br />
<br />
<br />
<br />
5V<br />
<br />
<br />
<br />
<br />
3V<br />
<br />
<br />
<br />
<br />
<br />
<br />
<br />
<br />
1st Introduction<br />
<br />
1991 1992 1993 1994 1995 1996<br />
Year<br />
Source: Mitsubishi/ICE, "Status 1996" 20427<br />
Figure 7-7<strong>7.</strong> Low Voltage Trend of 16M DRAM<br />
INTEGRATED CIRCUIT ENGINEERING CORPORATION
<strong>MOS</strong> <strong>Memory</strong> <strong>Market</strong> <strong>Trends</strong><br />
• Fujitsu initiated 0.35µm 16M DRAM production at its Iwate plant. <strong>The</strong> new line will be able<br />
to yield about 350 chips from a 200mm wafer, up 40 percent from its 0.5µm lines. Unlike<br />
many other vendors, Fujitsu hopes to maintain its eight million units-per-month 4M DRAM<br />
output while trying to capture 10 percent of the 16M DRAM market.<br />
• Fujitsu announced intentions to build a new U.S. DRAM manufacturing facility. <strong>The</strong> fab, to<br />
be located adjacent to its Gresham, Oregon, facility, will be equipped with 0.35µm C<strong>MOS</strong><br />
lines capable of processing 16M and 64M DRAMs. Production is slated to begin as early as<br />
199<strong>7.</strong><br />
• Hyundai’s 1996 DRAM plans call for it to build 16M EDO and burst EDO DRAMs as a way<br />
to bridge the performance and price chasm between memory devices and the CPUs they<br />
serve. Hyundai will keep synchronous DRAMs (SDRAMs) on the back burner until later in<br />
1996 while it feeds the market with beefed-up conventional DRAMs.<br />
• Kobe Steel ceased 4M DRAM production in 2H95, shifting all its production over to 16M<br />
DRAMs.<br />
• Mitsubishi was in the final stages of building its 16M DRAM production line at the<br />
Kumamoto facility at the end of 1995. <strong>The</strong> company plans to install 0.4µm processing equipment<br />
to build 1.5-2.0 million units/month on 200mm wafers.<br />
• Mitsubishi started construction on a 16M DRAM line at its subsidiary in Germany. <strong>The</strong> new<br />
0.35µm line is scheduled for operation in 1Q97 and will have a monthly output of 1.5 million<br />
units. Mitsubishi becomes the fourth Japanese chip maker to have a 16M DRAM wafer processing<br />
facility in Europe.<br />
• NEC developed a super-small 16M DRAM chip using the 0.25µm C<strong>MOS</strong> process that it used<br />
to develop a 1G DRAM prototype. It will sample the 16M chip in 1H96 and start production<br />
of the small chips in 2H96.<br />
• NEC expects 16M DRAM capacity to be approximately 10 million units per month by mid-<br />
1996. Its Kyushu facility will supply 40 percent of the output while the Roseville, California,<br />
plant is expected to supply 3.5 million 16M units per month. Hiroshima will add another 2.5<br />
million devices. Two other facilities will pick up the rest of the production.<br />
• At the end of 1995, NEC shipped about 75 percent of its 16M DRAMs configured 1M x 16<br />
and 2M x 8. <strong>The</strong> other 25 percent were configured in a 4M x 4 architecture.<br />
• Nippon Steel Semiconductor (NSS) plans to invest approximately $410 million to complete a<br />
new 0.35µm, 200mm wafer fab for 16M DRAM production in June 199<strong>7.</strong><br />
INTEGRATED CIRCUIT ENGINEERING CORPORATION 7-53
<strong>MOS</strong> <strong>Memory</strong> <strong>Market</strong> <strong>Trends</strong><br />
• Oki Electric will invest $700 million to build a 16M/64M DRAM production facility in the<br />
U.S. <strong>The</strong> 0.35µm 200mm wafer processing line will be located in Oregon.<br />
• More than 50 percent of Samsung’s 16M DRAM production was configured x16 at the end<br />
of 1995. Approximately 50 percent of Samsung’s 16M DRAM production is for extended<br />
data out (EDO) DRAMs.<br />
• Tatung Company, one of Taiwan’s largest consumer electronic businesses, will enter the 16M<br />
and 64M DRAM markets with a joint-venture partner. It hopes to be in production in 1996<br />
or 199<strong>7.</strong><br />
• Tohoku Semiconductor (Toshiba-Motorola joint venture) completed construction of a new<br />
0.5µm, 200mm wafer fabrication facility for 16M DRAMs in Sendai, Japan. At full capacity<br />
(1996), the facility will be able to produce three million units per month.<br />
• Toshiba announced the availability of its 60ns and 70ns 16M DRAMs featuring a x32 organization.<br />
<strong>The</strong> wide organization will be useful as a low-power, high-performance solution for<br />
embedded applications including printers and set-top boxes.<br />
• TI and Hitachi formed Twinstar Semiconductor, a soon-to-be manufacturer of 16M DRAMs.<br />
<strong>Chip</strong>-making equipment is to be installed in February 1996 with a planned startup date of<br />
May 1996.<br />
64M DRAMs<br />
While the 16M DRAM is in the growth stages of its lifecycle, the always forward-looking IC suppliers<br />
are already planning their 64M DRAM volume production strategies. <strong>The</strong> market’s first<br />
64M DRAM engineering samples, fabricated in 0.32µm processes, emerged from DRAM leaders<br />
NEC and Samsung in 2Q95. Each company shipped several units to workstation, server, and<br />
mainframe-computer makers. In the second half of 1995, NEC Kyushu produced sample quantities<br />
on its newest line, while Samsung’s third 200mm line increased 64M DRAM output in 4Q95.<br />
Figure 7-78 shows various characteristics of 64M DRAMs examined by ICE. It should be noted<br />
that all of the devices operated at 3V. Nearly all vendors agree that 64M market acceptance will<br />
be determined by granularity. Following the bungled granularity issue at the 16M level, suppliers<br />
are careful to design their 64M products to match the needs of the market. Currently, most<br />
chip makers believe their 64M devices will be readily accepted in the 2M x 32 configuration.<br />
7-54<br />
INTEGRATED CIRCUIT ENGINEERING CORPORATION
Hitachi: Die Size: 445 mils x 800 mils = 356K mils 2<br />
Feature Size: 0.35 µ<br />
<strong>Memory</strong> Cell Area: 0.9 µ x 1.8µ = 1.62µ2<br />
Package: 34-pin 500 mil plastic SOJ<br />
Mitsubishi: Die Size: 416 mils x 810 mils = 337K mils 2<br />
Feature Size: 0.35 µ<br />
<strong>Memory</strong> Cell Area: 0.9 µ x 1.8µ = 1.62µ2<br />
Package: 34-pin 500 mil plastic SOJ<br />
<strong>MOS</strong> <strong>Memory</strong> <strong>Market</strong> <strong>Trends</strong><br />
Samsung: Feature Size: 0.32 µ<br />
Access Time: 50ns or 60ns<br />
Package: 34-pin 400 mil plastic TSOP or SOJ<br />
Sampling: 1Q95 sampling price of $600; volume<br />
production due 4Q95<br />
NEC: Die Size: 251K mils 2<br />
Feature Size: 0.35 µ<br />
Package: 34-pin 400 mil plastic SOJ<br />
Sampling: 2Q95<br />
Fujitsu: Die Size: 360K mils 2<br />
Feature Size: 0.35 µ<br />
Micron: Die Size: 272K mils 2<br />
Feature Size: 0.35 µ<br />
Access Time: 60ns<br />
Sampling: $500/100<br />
Source: ICE, "Status 1996"<br />
Figure 7-78. Sampling of 64M DRAM Devices<br />
Japan and Korean firms have dedicated the most funding for 64M DRAM development. Figure<br />
7-79 reviews a few of the highlights that indicate the resources several companies have committed<br />
to 64M DRAM production.<br />
As stated briefly in the 16M segment, Taiwan is becoming more aggressive in its DRAM production<br />
plans. <strong>The</strong> same can be said for Taiwanese companies planning to enter the 64M DRAM market.<br />
For instance, Mosel-Vitelic announced that its 64M production would start in 1997 or early<br />
1998. <strong>The</strong> company will develop its own 64M design, rather than seek a co-development plan<br />
with another firm. <strong>The</strong> announcement followed similar plans described by Powerchip, Nan Ya<br />
Technology Corporation, Vanguard International Semiconductor Corporation (VISC), and TI-Acer<br />
(Figure 7-80).<br />
INTEGRATED CIRCUIT ENGINEERING CORPORATION 7-55<br />
19810
<strong>MOS</strong> <strong>Memory</strong> <strong>Market</strong> <strong>Trends</strong><br />
7-56<br />
Company<br />
Mosel-Vitelic<br />
Nan Ya Technology<br />
Fujitsu<br />
Mitsubishi<br />
NEC<br />
Toshiba<br />
Powerchip Semiconductor<br />
TI-Acer<br />
Vanguard International<br />
Source: ICE, "Status 1996"<br />
Company 64M Capacity Plans<br />
Samsung<br />
Source: ICE, "Status 1996"<br />
Considering expanding Gresham, OR DRAM plant<br />
to include 64M production capability.<br />
Spending $1.1 billion on a new fab line in an<br />
existing building at its plant in Saijo, Japan.<br />
Production is to start in late 1997 or early 1998.<br />
Announced construction of a new 64M fab in<br />
Hiroshima.<br />
Announced a $1.2B joint-venture 64M DRAM fab<br />
with IBM to be built in Manassas, VA–a sharp break<br />
from its past insistence that it can best build chips<br />
only in Japan. Production to begin in 4Q9<strong>7.</strong> Also<br />
negotiating with Winbond for a DRAM technology<br />
agreement.<br />
Announced in July its plans to invest $1.5 billion in<br />
a U.S. factory that will produce 16M and 64M<br />
DRAMs.<br />
20425<br />
Figure 7-79. Japan and Korea Prepare for 64M DRAM Production<br />
Design<br />
Development<br />
Own 64M DRAM design<br />
Joint-development<br />
with Oki<br />
DRAM design/technology<br />
assistance from Mitsubishi<br />
Designs from TI,<br />
manufacturing from Acer<br />
Joint-development with<br />
Mitsubishi<br />
First<br />
Shipments<br />
4Q97/1Q98<br />
1997<br />
4Q96/1Q97<br />
1997<br />
1997<br />
Figure 7-80. Taiwan’s Ambitious 64M DRAM Plans<br />
Comments<br />
Oki to provide foundry services.<br />
Will sell DRAMs under its own logo,<br />
but with technology licensed from Oki.<br />
Japan's Mitsubishi and Kanematsu<br />
have one-third ownership in Powerchip.<br />
TI sells the output under its own logo.<br />
Spending $1.2 billion to build a 64M<br />
DRAM fab in Taipei. Operations are<br />
due to begin in the spring of 199<strong>7.</strong><br />
Formerly government sponsored<br />
Industrial Technology Research<br />
Institute.<br />
20031A<br />
INTEGRATED CIRCUIT ENGINEERING CORPORATION
Highlights from the 64M DRAM market are shown below.<br />
<strong>MOS</strong> <strong>Memory</strong> <strong>Market</strong> <strong>Trends</strong><br />
• Based on a preliminary survey of DRAM manufacturers, production costs for 64M DRAMs<br />
will be about three times higher than the cost of producing 4M chips due to the higher integration<br />
levels.<br />
• Fujitsu announced its synchronous 64M DRAM. <strong>The</strong> move puts the company among the<br />
leaders in the competition for high-density SDRAMs. <strong>The</strong> 3V, 100MHz device is fabricated<br />
using 0.35µm C<strong>MOS</strong> technology. <strong>The</strong> company plans to bypass the conventional 64M<br />
DRAM market in favor of the faster and more profitable synchronous market.<br />
• LG Semicon announced plans to form a cooperative production agreement with Hitachi for<br />
64M DRAMs even though Hitachi and Texas Instruments already have a joint production<br />
venture for the same type of memory chip.<br />
• IBM demonstrated its 32MB small outline dual-in-line memory module (SO DIMM) using<br />
64M DRAMs in the IBM ThinkPad 701C notebook computer. <strong>Memory</strong> capacity and board<br />
space are two major concerns in the design process for laptops and portables. <strong>The</strong> 32MB SO<br />
DIMM using 64M DRAMs allows expanded memory capacity without increasing system<br />
board size. Several thousand 64M DRAM units a month are coming off the pilot production<br />
line at IBM’s Advanced Semiconductor Technology Center in New York.<br />
• Micron’s 64M DRAM effort was transferred from its pilot line to the manufacturing area for<br />
further product development and prototype evaluation. <strong>The</strong> company has made engineering<br />
samples available.<br />
• NEC plans to construct Europe’s first 64M DRAM plant at a cost of over $800 million. It will<br />
be built next to NEC’s current facilities in Scotland. <strong>The</strong> 0.35µm fab is scheduled to become<br />
operational in October 1996 and will initially produce 10,000 200mm wafers per month.<br />
Plans call for the eventual output of 20,000 wafers per month. <strong>The</strong> company announced that<br />
RDRAMs and SDRAMs will account for 15 to 20 percent of its DRAM shipments in 1996.<br />
• Rambus announced that each of the Rambus DRAM licensees—Hitachi, LG Semicon, NEC,<br />
Oki, Samsung, and Toshiba—is developing a 64M Rambus DRAM (RDRAM). <strong>The</strong> 64M<br />
RDRAMs are aimed at the main-memory market, where high bandwidth is necessary but not<br />
yet sufficient.<br />
• Samsung’s second-generation 64M DRAMs come in a smaller 400-mil package, which<br />
requires 20 percent less board space. Organized as 8M x 8 (50ns) or 16M x 4 (60ns), each<br />
operates using 3V power. Typical applications are for workstations, servers, and large memory<br />
systems.<br />
INTEGRATED CIRCUIT ENGINEERING CORPORATION 7-57
<strong>MOS</strong> <strong>Memory</strong> <strong>Market</strong> <strong>Trends</strong><br />
DRAM Price-per-Bit <strong>Trends</strong><br />
Figure 7-81 lists the overall DRAM price-per-bit values for the years 1985 through 1996. Increased<br />
competition or a slowing market (or both), which results in lower DRAM ASPs, may easily cause<br />
price-per-bit drops of nearly 50 percent (e.g., 1990). On the other hand, when demand outstrips<br />
supply, an increase in the average price-per-bit takes place (1993-1995). A forecasted decrease in<br />
16M DRAM ASPs will be the biggest contributing factor that lowers the total DRAM price-per-bit<br />
in 1996.<br />
DRAM price-per-bit trends are plotted in Figure 7-82 for densities ranging from 64K to 16M. As<br />
shown, the 4M DRAMs became price competitive with 1M devices in 1991 and have since enjoyed<br />
a long period of being the best value for money.<br />
A pricing curve for DRAM memory is shown in Figure 7-83. <strong>The</strong> traditional IC learning curve<br />
with a 68 percent slope is plotted along with the historical and forecasted annual DRAM priceper-bit<br />
figures.<br />
7-58<br />
Year<br />
1985<br />
1986<br />
1987<br />
1988<br />
1989<br />
1990<br />
1991<br />
1992<br />
1993<br />
1994<br />
1995 (EST)<br />
1996 (FCST)<br />
Price Per Bit<br />
(Millicents)<br />
1.65<br />
1.02<br />
1.12<br />
1.57<br />
1.24<br />
0.66<br />
0.43<br />
0.30<br />
0.31<br />
0.31<br />
0.32<br />
0.24<br />
*First time ever increase<br />
Source: ICE, "Status 1996"<br />
Percent Change<br />
From Previous Year<br />
–70<br />
–38<br />
10*<br />
40<br />
–21<br />
–47<br />
–35<br />
–30<br />
3<br />
—<br />
3<br />
–25<br />
Figure 7-81. DRAM Price-Per-Bit Comparison<br />
13346Q<br />
INTEGRATED CIRCUIT ENGINEERING CORPORATION
Millicents Per Bit<br />
20<br />
10<br />
8<br />
6<br />
4<br />
2<br />
0.8<br />
0.6<br />
0.4<br />
0.2<br />
1<br />
0.1<br />
256K<br />
64K<br />
1M<br />
83 84 85 86 87 88 89 90 91<br />
Source: ICE, "Status 1996"<br />
Price Per Bit (Millicents)<br />
100<br />
10<br />
1<br />
1979<br />
1980<br />
1981<br />
4M<br />
Year<br />
<strong>MOS</strong> <strong>Memory</strong> <strong>Market</strong> <strong>Trends</strong><br />
INTEGRATED CIRCUIT ENGINEERING CORPORATION 7-59<br />
16M<br />
Figure 7-82. DRAM Price-Per-Bit <strong>Trends</strong><br />
1982 1983<br />
92 93 94 95<br />
(EST)<br />
0.1<br />
1 10 100 1,000 10,000<br />
Source: ICE, "Status 1996"<br />
Post Recessionary<br />
Price Strengthening<br />
Traditional<br />
68% Slope<br />
1984<br />
1985<br />
1986<br />
Excess<br />
Capacity<br />
Price Erosion<br />
1987<br />
Cumulative Volume (Bits x 10 12 )<br />
Figure 7-83. Price Curve for DRAM<br />
Trade Agreement<br />
1988<br />
1989<br />
1990<br />
1991<br />
0.75 (256K)<br />
96<br />
(FCST)<br />
Strong Demand,<br />
Weak Supply<br />
0.27 (1M)<br />
0.24 (4M, 16M)<br />
14755M<br />
1995<br />
1992<br />
(EST)<br />
1993 1994<br />
1996<br />
(FCST)<br />
7437U
<strong>MOS</strong> <strong>Memory</strong> <strong>Market</strong> <strong>Trends</strong><br />
7-60<br />
INTEGRATED CIRCUIT ENGINEERING CORPORATION