Report of Investigation 196 - arkisto.gsf.fi - Geologian tutkimuskeskus
Report of Investigation 196 - arkisto.gsf.fi - Geologian tutkimuskeskus
Report of Investigation 196 - arkisto.gsf.fi - Geologian tutkimuskeskus

You also want an ePaper? Increase the reach of your titles
YUMPU automatically turns print PDFs into web optimized ePapers that Google loves.
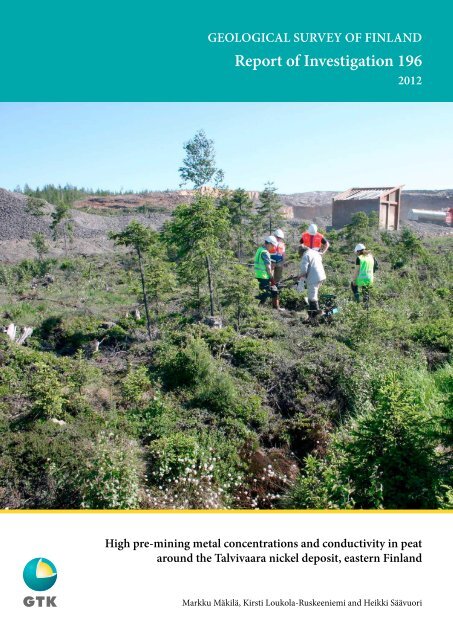
GEOLOGICAL SURVEY OF FINLAND<br />
<strong>Report</strong> <strong>of</strong> <strong>Investigation</strong> <strong>196</strong><br />
2012<br />
High pre-mining metal concentrations and conductivity in peat<br />
around the Talvivaara nickel deposit, eastern Finland<br />
Markku Mäkilä, Kirsti Loukola-Ruskeeniemi and Heikki Säävuori
GEOLOGIAN TUTKIMUSKESKUS GEOLOGICAL SURVEY OF FINLAND<br />
Tutkimusraportti <strong>196</strong> <strong>Report</strong> <strong>of</strong> <strong>Investigation</strong> <strong>196</strong><br />
Markku Mäkilä, Kirsti Loukola-Ruskeeniemi and Heikki Säävuori<br />
HIGH PRE-MINING METAL CONCENTRATIONS AND CONDUCTIVITY IN PEAT<br />
AROUND THE TALVIVAARA NICKEL DEPOSIT, EASTERN FINLAND<br />
Unless otherwise indicated, the <strong>fi</strong>gures have been prepared by the authors <strong>of</strong> the publication.<br />
Front cover: Study site M2 in the Talvivaara mine in 2011. The peat samples for the present study<br />
were selected in 2005 when the site was located in the middle <strong>of</strong> a forest, before the large-scale mining<br />
activities began. Photo: Markku Mäkilä, GTK.<br />
Layout: Elvi Turtiainen Oy<br />
Printing house: Vammalan Kirjapaino Oy<br />
Espoo 2012
Mäkilä, M., Loukola-Ruskeeniemi, K. & Säävuori, H. 2012. High pre-mining<br />
metal concentrations and conductivity in peat around the Talvivaara nickel<br />
deposit, eastern Finland. Geological Survey <strong>of</strong> Finland, <strong>Report</strong> <strong>of</strong> <strong>Investigation</strong><br />
<strong>196</strong>, 36 pages, 31 <strong>fi</strong>gures and 7 tables.<br />
The Talvivaara Ni-Cu-Zn-Co deposit contains more than 1500 Mt <strong>of</strong> lowgrade<br />
ore, and has been mined since 2008 (0.22% Ni, 0.13% Cu, 0.49% Zn,<br />
0.02% Co). Three peat study sites representing different bedrock types and hydrological<br />
conditions were sampled in the Talvivaara area in 2005, before the<br />
large-scale mining activities began. The chemical and physical properties <strong>of</strong><br />
peat were studied from 58 samples. The chemical concentrations <strong>of</strong> peat were<br />
affected by factors such as the capillary transport <strong>of</strong> water through the underlying<br />
sandy till, plant physiology and geochemical processes in peat. The concentrations<br />
<strong>of</strong> Co, Cu, Fe, Mn, Ni, U, Zn and S and conductivity were lower<br />
at the study site on mica schist bedrock than in peat at the two study sites underlain<br />
by so-called black schists (metasedimentary rocks rich in graphite and<br />
sulphides). These metals displayed greater concentrations in the bottom layers<br />
<strong>of</strong> Carex (sedge) peat than in the surface layer <strong>of</strong> Sphagnum (moss) -dominated<br />
peat. It seems likely that hydrological conditions at one sloping peatland site<br />
underlain by black schist have been conducive to production and transport <strong>of</strong><br />
acidic surface waters with metal- rich suspension from adjacent Ni-rich black<br />
schist outcrops and glacial till throughout the entire history <strong>of</strong> peat accumulation.<br />
The peat layer evidently functioned in the same way as peat <strong>fi</strong>lters in<br />
the remediation <strong>of</strong> acid mine drainage in present-day mine environments, i.e.<br />
metals were retained in the peat. Ditches also locally reached the underlying<br />
Ni-rich bedrock and/or Ni-rich glacial till. At this black schist study site, pH<br />
values varied between 2.8–3.8 beneath the surface peat layer. These pH values<br />
are lower than can be tolerated by Carex peat-forming plants. The acidity <strong>of</strong><br />
peat changed in the <strong>196</strong>0s when the peat became drier due to drainage <strong>of</strong> the<br />
the peatland, and sulphur oxidized to SO 4 . We conclude that in sulphide-rich<br />
terrain, sulphur concentrations in peat can be high, and leaching <strong>of</strong> sulphur<br />
from peat to surface waters during and after peatland drainage activities may<br />
lead to environmental problems. The conductivity probe developed at the Geological<br />
Survey <strong>of</strong> Finland provides a cost-effective tool for locating sulphiderich<br />
peat formations.<br />
Keywords (GeoRef Thesaurus, AGI): peat, chemical properties, metals, sulfur,<br />
background level, electrical conductivity, mica schist, black schists, nickel, acid<br />
rock drainage, Talvivaara, Sotkamo, Finland<br />
Markku Mäkilä, Kirsti Loukola-Ruskeeniemi, Heikki Säävuori<br />
Geological Survey <strong>of</strong> Finland, P. O. Box 96, FI-02151 Espoo, Finland<br />
E-mail: markku.makila@gtk.<strong>fi</strong>, kirsti.loukola-ruskeeniemi@gtk.<strong>fi</strong>, heikki.saavuori@gtk.<strong>fi</strong><br />
ISBN 978-952-217-194-8 (PDF)<br />
ISBN 978-952-217-195-5 (paperback)<br />
ISSN 0781-4240
Mäkilä, M., Loukola-Ruskeeniemi, K. & Säävuori, H. 2012. High pre-mining<br />
metal concentrations and conductivity in peat around the Talvivaara nickel<br />
deposit, eastern Finland. <strong>Geologian</strong> <strong>tutkimuskeskus</strong>, Tutkimusraportti <strong>196</strong>, 36<br />
sivua, 31 kuvaa ja 7 taulukkoa.<br />
Talvivaaran Ni-Cu-Zn-Co -esiintymä sisältää yli 1500 Mt metallipitoisuudeltaan<br />
suhteellisen alhaista malmia, jota on louhittu vuodesta 2008 lähtien<br />
(0,22 % Ni, 0,13 % Cu, 0,49 % Zn, 0,02 % Co). Talvivaaran alueelta otettiin<br />
vuonna 2005 turvenäytteitä kolmelta suolta, jotka edustavat erilaisia kallioperäalueita<br />
ja hydrologisia olosuhteita. Turpeen kemiallisia ja fysikaalisia ominaisuuksia<br />
tutkittiin 58 näytteestä. Näytteiden kemialliseen koostumukseen<br />
ovat vaikuttaneet monet eri tekijät kuten veden kapillaarinen nousu suon pohjan<br />
hiekkamoreenissa ja turpeen kasvifysiologiset ja geokemialliset prosessit.<br />
Co, Cu, Fe, Mn, Ni, U, Zn ja S -pitoisuudet ja johtavuus olivat alemmat kiilleliuske-kallioperässä<br />
olevalla suolla kuin mustaliuskeen (gra<strong>fi</strong>ittia ja sul<strong>fi</strong>deja sisältävien<br />
metasedimenttikivien) päällä olevilla soilla. Nämä metallit esiintyivät<br />
suurempina pitoisuuksina soiden pohjalla saraturpeissa kuin suon pinnan rahkaturpeissa.<br />
Mustaliuskealueella olevalla rinnesuolla hydrologiset olosuhteet<br />
edistivät happamien pintavesien muodostumista ja kulkeutumista turpeeseen<br />
viereisiltä runsaasti nikkeliä sisältäviltä mustaliuskekallioilta ja moreenikerroksista<br />
koko turpeen muodostumishistorian ajan. Ilmeisesti turvekerros toimi<br />
samalla tavalla kuin turvesuodattimet happaman kaivosvalunnan korjaamisessa<br />
nykypäivän kaivosympäristöissä, metalleja pidättyi turpeeseen. Mustaliuskealueella<br />
olevalla rinnesuolla pH-arvot vaihtelivat 2.8–3.8 välillä pintaturvekerroksen<br />
alla. Nämä pH-arvot ovat alempia kuin saraturvetta muodostavat<br />
kasvit kestävät. Turpeen happamuus muuttui <strong>196</strong>0-luvulla, kun turvekerrokset<br />
kuivuivat ojituksen vuoksi ja rikkiä hapettui sulfaatiksi. Alueilla, joissa<br />
kallioperä ja/tai maaperä sisältävät paljon sul<strong>fi</strong>deja, turpeen rikkipitoisuudet<br />
voivat olla korkeita. Rikin kulkeutuminen turpeesta pintavesiin turvemaiden<br />
ojituksen aikana ja sen jälkeen saattaa johtaa ympäristöongelmiin. <strong>Geologian</strong><br />
tutkimuskeskuksessa kehitetty johtavuusluotain tarjoaa kustannustehokkaan<br />
menetelmän sul<strong>fi</strong>dirikkaiden turvekerrosten paikantamiseen.<br />
Asiasanat (Geosanasto, GTK): turve, kemialliset ominaisuudet, metallit, rikki,<br />
taustapitoisuus, sähkönjohtokyky, kiilleliuske, mustaliuskeet, nikkeli, hapan<br />
valuma, Talvivaara, Sotkamo, Suomi<br />
Markku Mäkilä, Kirsti Loukola-Ruskeeniemi, Heikki Säävuori<br />
<strong>Geologian</strong> <strong>tutkimuskeskus</strong>, PL 96, 02151 Espoo<br />
S-posti: markku.makila@gtk.<strong>fi</strong>, kirsti.loukola-ruskeeniemi@gtk.<strong>fi</strong>, heikki.saavuori@gtk.<strong>fi</strong>
4<br />
CONTENTS<br />
1 INTRODUCTION ......................................................................................................................... 5<br />
2 STUDY AREA ............................................................................................................................... 6<br />
2.1 Bedrock ................................................................................................................................... 6<br />
2.2 Soil .......................................................................................................................................... 7<br />
2.3 Peatlands ................................................................................................................................. 7<br />
2.4 Airborne geophysics ................................................................................................................ 9<br />
3 MATERIALS AND METHODS .................................................................................................... 9<br />
3.1 Sampling .................................................................................................................................. 9<br />
3.2 Laboratory analyses ................................................................................................................10<br />
3.3 Electrical conductivity ............................................................................................................10<br />
4 RESULTS .......................................................................................................................................11<br />
4.1 Chemical concentrations and peat properties <strong>of</strong> study sites ...................................................11<br />
4.2 Correlation between peat properties .......................................................................................24<br />
5 APPLICATION OF ELECTRIC CONDUCTIVITY MEASUREMENTS IN<br />
ENVIRONMENTAL STUDIES ..................................................................................................32<br />
6 DISCUSSION ...............................................................................................................................32<br />
7 CONCLUSIONS ...........................................................................................................................34<br />
ACKNOWLEDGEMENTS ..............................................................................................................35<br />
REFERENCES .................................................................................................................................35
<strong>Geologian</strong> <strong>tutkimuskeskus</strong>, Tutkimusraportti <strong>196</strong> – Geological Survey <strong>of</strong> Finland, <strong>Report</strong> <strong>of</strong> <strong>Investigation</strong> <strong>196</strong>, 2012<br />
High pre-mining metal concentrations and conductivity in peat around the Talvivaara nickel deposit, eastern Finland<br />
Sulphide ores and certain other rock types can influence<br />
elemental abundances in peat (e.g. Salmi<br />
1955, Kokkola & Penttilä 1976, Virtanen 1978,<br />
1990, 1993, 2004, 2005, Virtanen et al. 1997, Virtanen<br />
& Lerssi 2008). Black schists contain sulphides,<br />
weather more easily than other rock types<br />
and cause acid rock drainage and acidi<strong>fi</strong>cation <strong>of</strong><br />
surface waters (Loukola-Ruskeeniemi et al. 1998,<br />
Gustavsson et al. 2012). The chemical composition<br />
<strong>of</strong> peat is affected by numerous factors including<br />
plant physiology, geochemical and microbiological<br />
processes and capillary flow <strong>of</strong> water<br />
through underlying soil. The concentrations <strong>of</strong><br />
soluble ions in peat are dependent, for example,<br />
on the acidity, oxidation conditions, the ion exchange<br />
capacity and the number <strong>of</strong> complex compounds<br />
(Rose et al. 1979).<br />
The mobility <strong>of</strong> potential or actual contaminants<br />
derived from bedrock and soil depends on<br />
(1) their distribution and mode <strong>of</strong> occurrence, (2)<br />
their abundance, i.e. whether minerals are present<br />
in suf<strong>fi</strong>cient quantities to have a measurable effect,<br />
(3) their reactivity, i.e. the energetics, rates and<br />
mechanisms <strong>of</strong> sorption and mineral dissolution<br />
and precipitation relative to the flow rate <strong>of</strong> the<br />
water, and (4) hydrology, i.e. the main flow paths<br />
for contaminated water. Post-dissolution sorption<br />
and precipitation (attenuation) reactions depend<br />
on the chemical behaviour <strong>of</strong> each element,<br />
the composition and pH <strong>of</strong> the solution, aqueous<br />
speciation, temperature, and contact times with<br />
mineral surfaces. For example, little metal attenuation<br />
occurs in waters <strong>of</strong> low pH (
<strong>Geologian</strong> <strong>tutkimuskeskus</strong>, Tutkimusraportti <strong>196</strong> – Geological Survey <strong>of</strong> Finland, <strong>Report</strong> <strong>of</strong> <strong>Investigation</strong> <strong>196</strong>, 2012<br />
Markku Mäkilä, Kirsti Loukola-Ruskeeniemi and Heikki Säävuori<br />
heavy metals in peat. Jones and Hao (1993) also<br />
demonstrated elevated concentrations <strong>of</strong> Cd, Cu,<br />
Fe, Pb, and Zn in peat due to industrial activities<br />
in Shef<strong>fi</strong>eld and Manchester. Historical mining<br />
and smelting has been recorded in peat pr<strong>of</strong>iles<br />
in many parts in the world, for example, in the<br />
Basque Country in Spain (Monna et al. 2004) and<br />
South West England (West et al. 1997).<br />
In the present study, results from the analysis <strong>of</strong><br />
three peat pr<strong>of</strong>iles sampled in 2005 around the Tal-<br />
The bedrock in the Talvivaara area consists <strong>of</strong><br />
both Archaean and Palaeoproterozoic rocks<br />
(Figs. 1 and 2). The Talvivaara deposit comprises<br />
two polymetallic ore bodies, Kuusilampi and Kolmisoppi.<br />
The mineral resource is 1 550 million<br />
tonnes at 0.22% <strong>of</strong> nickel, 0.13% <strong>of</strong> copper, 0.02%<br />
<strong>of</strong> cobalt and 0.49% <strong>of</strong> zinc (Talvivaara Mining<br />
Company 2010). Loukola-Ruskeeniemi and Heino<br />
(1996) classi<strong>fi</strong>ed the Talvivaara C-rich rocks<br />
into two main groups: black schists (Ni-rich, Nipoor,<br />
and Mn-rich subtypes) and graphite-rich<br />
calc-silicate rocks. The black schists at Talvivaara<br />
contain quartz, mica, graphite and sulphides as<br />
the main minerals, with rutile, apatite, zircon,<br />
feldspar and garnet as common accessory minerals.<br />
Quartz occurs in both the matrix and veins,<br />
together with sulphides, mica and feldspar. Pyrite<br />
and pyrrhotite are the dominant sulphide minerals<br />
in the Talvivaara deposit. Pyrite, pyrrhotite<br />
and sphalerite occur both as <strong>fi</strong>ne-grained disseminations<br />
(
7097 7100 7103<br />
N<br />
<strong>Geologian</strong> <strong>tutkimuskeskus</strong>, Tutkimusraportti <strong>196</strong> – Geological Survey <strong>of</strong> Finland, <strong>Report</strong> <strong>of</strong> <strong>Investigation</strong> <strong>196</strong>, 2012<br />
High pre-mining metal concentrations and conductivity in peat around the Talvivaara nickel deposit, eastern Finland<br />
3551 3555<br />
1 km<br />
KOLMISOPPI<br />
M2<br />
M1<br />
KUUSILAMPI<br />
M3<br />
3551 3555<br />
Grey and compact sandy basal glacial till is the<br />
prevailing soil type at Talvivaara and is present<br />
as a thin layer covering the entire area (Murtoniemi<br />
1984). Till fabric alignments vary from<br />
290º to 310º, corresponding to bedrock striation<br />
directions and the general orientation <strong>of</strong> drumlins<br />
and bedrock topography. The upper part <strong>of</strong> the<br />
basal till horizon has locally been reworked with<br />
removal <strong>of</strong> <strong>fi</strong>ne material, during the <strong>fi</strong>nal stages <strong>of</strong><br />
the last deglaciation. Ablation moraines, characterized<br />
by sand and gravel, form discrete mounds<br />
Because <strong>of</strong> the highly undulating topography in<br />
the Talvivaara area, as in much <strong>of</strong> the Sotkamo<br />
region, peatlands are relatively small. Together<br />
with several lakes, occupying low-lying areas<br />
throughout the region, commonly occurring in<br />
depressions between elevated moraine ridges (Fig.<br />
7097 7100 7103<br />
2.2 Soil<br />
2.3 Peatlands<br />
Upper Kaleva (
<strong>Geologian</strong> <strong>tutkimuskeskus</strong>, Tutkimusraportti <strong>196</strong> – Geological Survey <strong>of</strong> Finland, <strong>Report</strong> <strong>of</strong> <strong>Investigation</strong> <strong>196</strong>, 2012<br />
Markku Mäkilä, Kirsti Loukola-Ruskeeniemi and Heikki Säävuori<br />
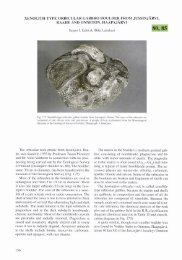
Fig. 3. Soil stratigraphy exposed at study site M2 in 2011. Photo: Ale Grundström, GTK.<br />
Fig. 4. Shaded topographic map <strong>of</strong> the Talvivaara area showing study sites and drainage watershed (broken red line). Old<br />
quarries are also marked on the map in violet. Detailed maps from study site M2 (inset enlargement at lower right) indicate<br />
that the old quarries did not influence the quality <strong>of</strong> surface and ground water affecting peat in M2. Outcrops <strong>of</strong> black schist<br />
containing abundant sulphides (inset enlargement at upper right) induce acid run<strong>of</strong>f and acidi<strong>fi</strong>cation <strong>of</strong> surface waters, after<br />
exposure to the atmosphere and surface waters (Loukola-Ruskeeniemi et al. 1998). Basemap@National Land Survey <strong>of</strong> Finland,<br />
licence no 13/MML/12.<br />
8<br />
7095 7096 7097 7098<br />
Watershed area<br />
Rock outcrop<br />
!( Study sites<br />
Old quarry<br />
m.a.s.l.<br />
High : 250 m<br />
Low : 200 m<br />
3553<br />
M2<br />
3553<br />
M2<br />
3554<br />
M1<br />
M3<br />
0 250 500 1 000 000Metriä<br />
m<br />
3554<br />
7097000 7098000 7099000<br />
7098000<br />
7097000<br />
7096000<br />
7098<br />
7097<br />
7096<br />
7095<br />
m a.s.l<br />
High : 218 m<br />
Low : 210 m<br />
M2<br />
M2<br />
!<br />
0 100 200 300 m
7097 7100 7103<br />
<strong>Geologian</strong> <strong>tutkimuskeskus</strong>, Tutkimusraportti <strong>196</strong> – Geological Survey <strong>of</strong> Finland, <strong>Report</strong> <strong>of</strong> <strong>Investigation</strong> <strong>196</strong>, 2012<br />
High pre-mining metal concentrations and conductivity in peat around the Talvivaara nickel deposit, eastern Finland<br />
3551 3555<br />
3551<br />
!( !(<br />
M2<br />
!( !(<br />
M1<br />
!(<br />
M3<br />
3555<br />
7103<br />
7100<br />
7097<br />
Fig 5. Magnetic map <strong>of</strong> the study area. Fig. 6. Electromagnetic in-phase component map <strong>of</strong> the<br />
study area.<br />
when the sandy till in depressions between moraine<br />
ridges became emergent. Peatland formation<br />
began on mineral soils on the sloping study<br />
site M2 at 7980 years ago (C14-age; Poz-4323).<br />
The rate <strong>of</strong> peat formation has averaged 0.31 mm<br />
Low altitude airborne geophysical surveys <strong>of</strong> the<br />
Talvivaara area were carried out along east-west<br />
flightlines in 1977. The black schist area is clearly<br />
delineated in both magnetic and electromagnetic<br />
maps. The magnetic map in Figure 5 illustrates the<br />
distribution <strong>of</strong> ferrimagnetic minerals in the bedrock.<br />
Magnetic anomalies in the black schists are<br />
due to the presence <strong>of</strong> monoclinic pyrrhotite and<br />
Sampling <strong>of</strong> the peat layers from study sites M1,<br />
M2 and M3 at Talvivaara was carried out in<br />
2.4 Airborne geophysics<br />
3 MATERIALS AND METHODS<br />
3.1 Sampling<br />
per year. The peat at study site M3 was formed<br />
by progressive paludication <strong>of</strong> forest, the evidence<br />
for which can be seen in wood residues at the bottom<br />
<strong>of</strong> the peat layer.<br />
are indicated by red colors in Figure 5. The electromagnetic<br />
in-phase component map in Figure 6<br />
corresponds generally to the mineral composition<br />
<strong>of</strong> the bedrock, but thick overburden and water<br />
bodies can obscure their distribution. The electrical<br />
anomalies in the black schist area are caused<br />
by both graphite and sulphides.<br />
2005, before the commencement <strong>of</strong> mining at Talvivaara<br />
(Fig. 7).<br />
9
<strong>Geologian</strong> <strong>tutkimuskeskus</strong>, Tutkimusraportti <strong>196</strong> – Geological Survey <strong>of</strong> Finland, <strong>Report</strong> <strong>of</strong> <strong>Investigation</strong> <strong>196</strong>, 2012<br />
Markku Mäkilä, Kirsti Loukola-Ruskeeniemi and Heikki Säävuori<br />
Fig. 7. Study site M2 in 2011. The mining area is visible in the<br />
background approximately 100 m from the study site. Photo:<br />
Markku Mäkilä, GTK.<br />
Sampling was carried out using a Russian<br />
core sampler with a diameter <strong>of</strong> 5 cm and length<br />
<strong>of</strong> 50 cm. Peat samples were taken at the in situ<br />
peat deposit study sites as 10 cm sections from<br />
the surface downwards (Fig. 8). Altogether, 58<br />
peat samples were taken. The main peat type and<br />
In the laboratory, peat samples were homogenized<br />
before analysis. The samples were chemically analysed<br />
by ICP-MS and ICP-AES methods. Analyses<br />
were carried out in the laboratory <strong>of</strong> the<br />
Geological Survey <strong>of</strong> Finland. The samples were<br />
analysed for organic carbon and ash content % <strong>of</strong><br />
Conductivity was measured at the three study<br />
sites from the surface to the bottom <strong>of</strong> the cored<br />
section at intervals <strong>of</strong> 25 cm. During sampling,<br />
conductivity and temperature were measured<br />
with an electric conductivity and temperature<br />
probe (Puranen et al. 1997 and 1999) (Fig. 9). The<br />
sensor was pressed into the peat using the shaft<br />
<strong>of</strong> the core sampler. The temperature sensor consisted<br />
<strong>of</strong> an integrated circuit (AD590), and the<br />
four Wenner electrodes (with a spacing <strong>of</strong> 1.5 cm)<br />
comprising the conductivity sensor operated at<br />
a high frequency (500 Hz) to avoid electrode polarization.<br />
Electrical conductivity correlates with<br />
the nutrient content, temperature and acidity (pH<br />
value) <strong>of</strong> peatland waters.<br />
10<br />
3.2 Laboratory analyses<br />
3.3 Electrical conductivity<br />
Fig. 8. Peat sampling. Photo: Markku Mäkilä, GTK.<br />
the proportions <strong>of</strong> any minor constituents were<br />
determined by visual inspection <strong>of</strong> the peat cores<br />
(Lappalainen et al. 1984). Humi<strong>fi</strong>cation was estimated<br />
according to the 10-degree scale <strong>of</strong> von<br />
Post (1922). In addition, the type <strong>of</strong> subsoil was<br />
recorded.<br />
dry weight, water content % <strong>of</strong> wet weight, pH,<br />
elemental sulphur and major and trace elements<br />
(mg/kg). Dry bulk density per cubic metre <strong>of</strong> peat<br />
(g/m 3 ) was calculated on the basis <strong>of</strong> the water<br />
content (Mäkilä 1994).<br />
Fig. 9. Probe for electrical conductivity and temperature logging<br />
<strong>of</strong> s<strong>of</strong>t sediments. P: probe; E: electronics unit; C: Kevlar<br />
cable; S: sampler shaft; L: lifting tool.
<strong>Geologian</strong> <strong>tutkimuskeskus</strong>, Tutkimusraportti <strong>196</strong> – Geological Survey <strong>of</strong> Finland, <strong>Report</strong> <strong>of</strong> <strong>Investigation</strong> <strong>196</strong>, 2012<br />
High pre-mining metal concentrations and conductivity in peat around the Talvivaara nickel deposit, eastern Finland<br />
4 RESULTS<br />
4.1 Chemical concentrations and peat properties <strong>of</strong> study sites<br />
Study site M1 was situated in a schist area outside<br />
the watershed (Figs. 2 and 4). The mire type at<br />
study site M1 represents a transformed pine bog.<br />
The peat layer was 1.8 m thick and mainly consisted<br />
<strong>of</strong> moderately decomposed woody-Sphagnum<br />
(moss) peat with a Carex (sedge) layer at the<br />
bottom. Beneath the peat was a 10 cm layer <strong>of</strong><br />
sandy till with peat (Table 1). The mean humi<strong>fi</strong>cation<br />
degree (H) <strong>of</strong> the peat was 5.5 according on<br />
the 10-degree scale <strong>of</strong> von Post (1922). The average<br />
ash content was 2.4% <strong>of</strong> dry weight, the water<br />
content 87.1% <strong>of</strong> wet weight, and the dry bulk<br />
density 125.3 kg per m 3 in situ (Table 1).<br />
Study site M2 represents peat development on<br />
sloping terrain, which occurs where ground water<br />
is discharges at the surface on a rather steep<br />
slope (Fig. 4). This type <strong>of</strong> peatland usually forms<br />
at the foot <strong>of</strong> a hill. Good drainage and aeration<br />
<strong>of</strong> the peat-generating layer ensures a high degree<br />
<strong>of</strong> peat decomposition, although some remaining<br />
wood residues are well preserved (Fig. 10). Study<br />
site M2 is located within the watershed, subject<br />
Fig. 10. Well-preserved woody residue at study site M2. Photo: Markku Mäkilä, GTK.<br />
to discharge from the Kuusilampi ore deposit,<br />
where the bedrock consists <strong>of</strong> black schists that<br />
are highly fractured and rich in sulphides (Fig. 2).<br />
The mire type at the study site consisted <strong>of</strong><br />
transformed spruce peatland. The peat layer was<br />
2.5 m thick and mainly consisted <strong>of</strong> well decomposed<br />
woody Carex peat. The subsoil was sandy<br />
till (Fig. 3). The mean humi<strong>fi</strong>cation degree (H)<br />
<strong>of</strong> the peat was 6.6. The average ash content was<br />
31.3% <strong>of</strong> dry weight, the water content 85.3% <strong>of</strong><br />
wet weight, and the dry bulk density 135.3 kg per<br />
m 3 in situ (Table 1).<br />
Study site M3 was situated in a black schist area<br />
outside the watershed (Figs. 2 and 4). This site<br />
represented a transformed spruce peatland. The<br />
peat layer was 1.2 m thick and mainly comprised<br />
moderately decomposed woody Sphagnum and<br />
Carex peat. The subsoil was sandy till. The mean<br />
humi<strong>fi</strong>cation degree (H) <strong>of</strong> the peat was 5.2. The<br />
average ash content was 5.6% <strong>of</strong> dry weight, the<br />
water concentration 85.9% <strong>of</strong> wet weight, and the<br />
dry bulk density 132.0 kg per m 3 in situ (Table 1).<br />
11
<strong>Geologian</strong> <strong>tutkimuskeskus</strong>, Tutkimusraportti <strong>196</strong> – Geological Survey <strong>of</strong> Finland, <strong>Report</strong> <strong>of</strong> <strong>Investigation</strong> <strong>196</strong>, 2012<br />
Markku Mäkilä, Kirsti Loukola-Ruskeeniemi and Heikki Säävuori<br />
Tables 1, 2 and 3. Concentrations <strong>of</strong> selected trace elements and sulphur, pH, carbon, water, and ash content and dry density. Conductivity is corrected at a temperature <strong>of</strong> 18 o C in peat<br />
at study sites M1, M2 and M3. Metal and sulphur concentrations are presented as mg/kg dry matter. The peat type is described using the following symbols: C Carex (sedge), S Sphagnum<br />
(moss), B Bryales (brown moss), ER Eriophorum (cotton grass), L wood residues, EQ Equisetum (horsetail), N Nanolignidi (dwarf shrub remains). Degree <strong>of</strong> humi<strong>fi</strong>cation 1-10 in von Post’s<br />
scale. Sphagnum-predominant peat is highlighted with light grey and Carex-predominant peat is highlighted with dark grey.<br />
12<br />
Depth Humi<strong>fi</strong>- Peat Co Cu Fe Mn Ni Pb U Zn S C pH Water Dry Ash Conduccm<br />
cation type mg/kg mg/kg mg/kg mg/kg mg/kg mg/kg mg/kg mg/kg mg/kg % cont. % density % tivity<br />
<strong>of</strong> dry <strong>of</strong> wet in situ <strong>of</strong> dry mS/m<br />
weight weight kg/m3 Table 1.<br />
weight 18 °C<br />
10 2 LS 1.10 10.3 8060 35.7 5.48 18.9 0.21 41.0 2400 43.6 3.4 87.2 100.6 3.5 12.8<br />
20 7 LS 0.87 5.09 4300 6.00 5.33 9.14 0.37 10.1 3200 51.2 3.2 88.3 114.2 3.1 12.8<br />
30 7 LS 0.84 5.41 1410 7.85 4.65 3.32 0.26 11.2 3730 48.3 3.1 86.2 135.4 2.1 12.8<br />
40 5 ERS 0.98 8.25 1210 9.52 5.79 1.87 0.34 7.08 3830 48.7 3.1 85.5 142.5 1.7 8.0<br />
50 5 ERS 0.75 4.79 1190 8.69 4.65 0.95 0.41 5.43 3510 49.8 3.2 84.4 153.6 1.4 8.0<br />
60 5 ERLS 0.72 10.1 1320 10.1 6.26 1.31 0.96 7.63 4110 51.1 3.3 84.4 153.5 1.9 8.0<br />
70 5 ERLS 0.68 10.9 1290 8.65 5.48 0.99 0.97 4.98 4800 51.0 3.3 84.6 151.5 1.8 6.7<br />
80 5 ERLS 1.00 15.5 1260 8.59 6.58 1.07 1.16 5.59 6620 50.9 3.4 86.3 134.5 1.7 6.7<br />
90 5 ERLS 0.88 16.2 1220 7.72 5.74 0.90 1.38 5.24 6250 51.5 3.6 88.2 115.5 1.8 4.3<br />
100 5 CS 1.12 19.2 1220 7.78 6.34 1.35 1.30 4.56 8450 51.6 3.6 90.2 95.5 1.7 4.3<br />
110 7 SC 0.94 18.5 1510 9.18 6.37 2.26 1.25 4.99 6730 51.0 3.5 89.0 107.3 1.9 4.3<br />
120 7 SC 0.87 28.6 1620 8.23 7.19 2.99 2.03 4.48 6850 51.2 3.6 88.7 110.2 2.5 5.1<br />
130 7 SC 0.73 30.8 1600 7.77 6.99 2.74 2.42 4.04 7380 51.8 3.6 87.3 123.8 3.2 5.1<br />
140 6 SC 0.62 26.1 1670 7.92 7.33 3.13 2.33 5.17 7930 52.7 3.7 84.6 150.6 3.0 4.5<br />
150 6 SC 0.69 30.7 1890 8.39 9.04 4.02 2.30 3.95 9970 51.1 3.7 84.3 153.5 3.2 4.5<br />
160 5 SC 1.05 31.5 2010 8.78 12.4 3.59 1.37 6.46 11600 51.5 3.7 87.6 121.0 2.7 4.5<br />
170 5 SC 1.11 18.9 2200 8.87 9.68 1.92 0.77 7.29 11000 51.6 3.9 89.9 98.4 2.2 3.7<br />
180 5 SC 1.43 15.5 2660 10.2 11.4 1.64 0.55 21.3 9030 49.8 3.9 90.4 93.2 3.4 3.7<br />
190 Sandy peat 1.91 47.1 3140 26.5 23.6 3.29 2.07 93.4 8530 35.9 4.1 32.3 3.3<br />
200 Peaty till 6.40 31.8 5900 86.6 29.1 6.98 2.41 38.0 2450 11.5 4.4 81.9 3.3<br />
Average 5.5 0.91 17 2091 10.00 7.04 3.5 1.13 8.92 6522 50.5 3.5 87.1 125.3 2.4 6.7
Table 2.<br />
<strong>Geologian</strong> <strong>tutkimuskeskus</strong>, Tutkimusraportti <strong>196</strong> – Geological Survey <strong>of</strong> Finland, <strong>Report</strong> <strong>of</strong> <strong>Investigation</strong> <strong>196</strong>, 2012<br />
High pre-mining metal concentrations and conductivity in peat around the Talvivaara nickel deposit, eastern Finland<br />
Depth Humi<strong>fi</strong>- Peat Co Cu Fe Mn Ni Pb U Zn S C pH Water Dry Ash Conduccm<br />
cation type mg/kg mg/kg mg/kg mg/kg mg/kg mg/kg mg/kg mg/kg mg/kg % cont. % density % tivity<br />
<strong>of</strong> dry <strong>of</strong> wet in situ <strong>of</strong> dry mS/m<br />
weight weight kg/m 3 weight 18 °C<br />
10 2 NS 2.72 29 26200 89.9 22.9 23.9 0.61 104 2230 43.8 3.5 85.3 100.6 6.6 3.5<br />
20 5 LCS 1.53 73 17000 7.09 17.6 12.7 2.36 36.4 4680 48.2 3.6 84.1 155.5 6.4 3.5<br />
30 6 LCS 1.35 180 13700 6.80 21.4 12.2 3.66 48.2 6740 46.9 3.7 85.1 144.8 10.1 3.5<br />
40 7 SC 2.00 276 25600 21.6 25.9 3.55 3.27 220 9540 40.3 4.2 85.7 135.5 20.8 4.5<br />
50 7 SC 4.06 93 9670 71.0 35.4 1.40 1.56 266 10300 29.7 4.4 86.3 124.7 41.7 4.5<br />
60 8 SC 9.88 94 20100 77.3 77.6 3.84 1.88 317 15700 34.9 4.3 87.1 119.6 29.8 4.5<br />
70 7 LSC 20.4 95 32200 76.9 162 1.33 1.69 568 27100 30.5 3.1 88.0 110.2 31.7 8.5<br />
80 6 SC 20.0 97 33500 85.0 156 1.28 2.00 676 26300 35.1 3.2 89.0 102.7 21.9 8.5<br />
90 7 SC 21.7 120 32300 68.1 148 0.65 2.08 795 26700 30.7 3.3 87.7 113.5 30.3 10.1<br />
100 7 SC 33.9 146 40000 56.0 220 0.53 2.64 1010 35300 26.1 3.3 87.5 114.0 36.7 10.1<br />
110 8 LSC 32.4 184 42400 57.9 230 0.62 3.47 1050 35000 28.0 3.3 87.8 112.0 32.5 10.1<br />
120 8 LSC 39.0 231 47600 54.3 303 0.64 4.47 1490 41100 26.5 3.3 87.7 112.7 34.1 9.5<br />
130 7 LSC 37.8 249 53300 48.7 305 0.69 5.67 1580 46500 25.0 3.2 87.2 117.3 35.2 9.5<br />
140 7 LSC 31.3 316 63700 40.4 286 0.83 6.94 1580 57900 23.8 3.4 86.1 127.9 36.4 11.7<br />
150 7 SC 16.9 292 80600 33.3 237 1.31 7.82 1830 75500 23.2 3.3 83.8 150.6 36.9 11.7<br />
160 7 SC 19.5 300 75100 32.8 244 1.32 7.71 1990 69600 23.5 3.7 84.9 139.6 37.3 11.7<br />
170 8 SC 20.3 324 78900 28.4 272 1.41 8.20 2380 74900 23.5 3.6 84.6 142.9 35.6 12.5<br />
180 7 SC 18.6 285 90700 22.0 260 1.36 6.92 2170 86500 23.2 3.8 84.6 143.1 34.9 12.5<br />
190 6 BC 18.7 234 97700 15.4 265 1.14 5.57 1990 93000 21.1 3.2 85.2 136.5 37.6 16.5<br />
200 6 BC 18.4 227 109000 11.6 293 0.76 5.07 2420 107000 20.6 3.1 84.4 144.9 35.7 16.5<br />
210 6 BC 27.0 194 120000 14.0 451 1.28 3.88 5270 121000 22.2 3.7 85.1 138.1 35.3 16.5<br />
220 6 SC 16.5 114 85600 22.5 292 0.43 3.48 2740 123000 18.8 3.5 83.5 153.5 36.9 21.5<br />
230 7 LSC 12.1 93 74600 23.5 277 0.66 2.64 1050 136000 14.9 3.6 80.3 183.7 43.3 21.5<br />
240 7 LSC 20.8 101 89800 16.6 612 3.44 4.84 1580 136000 16.1 3.2 79.5 192.1 40.9 27.8<br />
250 7 EQLSC 28.1 137 87700 23.4 758 7.06 10.5 4360 126000 24.8 2.8 82.4 165.1 33.7 27.8<br />
260 Peaty till 35.9 334 269000 29.9 1120 15.4 8.77 5400 33700 9.65 68.3 36.7<br />
Average 6.6 19.0 179 57879 40.2 239 3.4 4.4 1501 59744 28.1 3.5 85.3 135.3 31.3 11.9<br />
13
<strong>Geologian</strong> <strong>tutkimuskeskus</strong>, Tutkimusraportti <strong>196</strong> – Geological Survey <strong>of</strong> Finland, <strong>Report</strong> <strong>of</strong> <strong>Investigation</strong> <strong>196</strong>, 2012<br />
Markku Mäkilä, Kirsti Loukola-Ruskeeniemi and Heikki Säävuori<br />
14<br />
Table 3.<br />
Depth Humi<strong>fi</strong>- Peat Co Cu Fe Mn Ni Pb U Zn S C pH Water Dry Ash Conduccm<br />
cation type mg/kg mg/kg mg/kg mg/kg mg/kg mg/kg mg/kg mg/kg mg/kg % cont. % density % tivity<br />
<strong>of</strong> dry <strong>of</strong> wet in situ <strong>of</strong> dry mS/m<br />
weight weight kg/m3 weight 18 °C<br />
10 2 NS 1.41 17.5 4110 46.3 20.9 16.9 1.2 39.1 5090 45.1 3.4 83.3 100.6 6.4 7.3<br />
20 7 LS 1.33 27.4 3880 11.3 27.1 10.1 1.53 29.2 8700 47.9 3.5 83.5 161.9 4.7 7.3<br />
30 7 LS 1.72 20.6 3800 27.4 31.8 3.33 0.91 54.5 9470 48.2 3.6 85.2 144.8 5.2 7.3<br />
40 6 LCS 1.76 15.6 3500 22.9 34.7 1.71 0.96 64.5 9610 48.6 3.7 85.3 143.8 5.3 5.4<br />
50 6 LCS 1.88 12.9 3800 33.4 35.5 1.8 0.98 79.5 9910 47.9 3.8 84.8 148.7 5.9 5.4<br />
60 4 LCS 2.09 16.6 4500 55.3 35.4 1.89 0.58 73.6 10100 47.8 4.2 88.2 114.5 5.1 5.4<br />
70 5 LSC 2.28 15.3 5750 86.3 37.4 0.81 0.53 83.2 12300 47.5 4.1 86.7 129.2 5.6 8.9<br />
80 5 LSC 2.00 20.7 7100 105 40.6 0.86 0.91 93.3 13400 48.0 4.2 87.5 121.2 6.1 10.4<br />
90 5 LSC 1.64 24.2 7780 128 40.4 0.87 1.17 84.8 14500 47.5 4.3 86.6 130.0 6.6 13.6<br />
100 5 LSC 1.43 24.0 7610 120 34.0 0.89 1.03 100 13600 48.3 4.3 86.9 127.3 5.2 13.6<br />
110 5 LSC 1.33 18.8 6950 108 30.1 0.96 0.79 49.8 14900 49.5 4.6 87.8 118.6 4.6 13.6<br />
120 5 LSC 1.20 26.7 8260 124 37.4 1.15 1.42 118 14400 48.8 4.5 85.2 143.8 6.5 15.1<br />
Average 5.2 1.67 20.0 5587 72.3 33.8 3.4 1.0 72.5 11332 47.9 4.0 85.9 132.0 5.6 9.4
Tables 4, 5 and 6. Concentrations <strong>of</strong> selected trace elements, sulphur, pH value, carbon, water, and ash content, dry density and conductivity corrected at a temperature <strong>of</strong> 18 o C at study<br />
sites M1, M2 and M3. Metal and sulphur concentrations are presented as g/m3 <strong>of</strong> peat. The peat type is described with use <strong>of</strong> the following symbols: C Carex (sedge), S Sphagnum (moss),<br />
B Bryales (brown moss), ER Eriophorum (cotton grass), L wood residues, EQ Equisetum (horsetail), N Nanolignidi (dwarf shrub remains). Degree <strong>of</strong> humi<strong>fi</strong>cation 1-10 in von Post’s scale.<br />
Sphagnum-predominant peat is highlighted with light grey and Carex-predominant peat is highlighted with dark grey. Average values don´t include results <strong>of</strong> the sandy peat and peaty till<br />
samples.<br />
<strong>Geologian</strong> <strong>tutkimuskeskus</strong>, Tutkimusraportti <strong>196</strong> – Geological Survey <strong>of</strong> Finland, <strong>Report</strong> <strong>of</strong> <strong>Investigation</strong> <strong>196</strong>, 2012<br />
High pre-mining metal concentrations and conductivity in peat around the Talvivaara nickel deposit, eastern Finland<br />
Depth Humi<strong>fi</strong>- Peat Co Cu Fe Mn Ni Pb U Zn S C pH Water Dry Ash Conduccm<br />
cation type g/m3 g/m3 g/m3 g/m3 g/m3 g/m3 g/m3 g/m3 g/m3 % cont. % density % tivity<br />
<strong>of</strong> dry <strong>of</strong> wet in situ <strong>of</strong> dry mS/m<br />
weight weight kg/m3 Table 4.<br />
weight 18 °C<br />
10 2 LS 0.22 1.04 811 3.59 5.48 18.9 0.21 4.12 241 43.6 3.4 87.2 100.6 3.5 12.8<br />
20 7 LS 0.10 0.58 491 0.69 5.33 9.14 0.37 1.15 366 51.2 3.2 88.3 114.2 3.1 12.8<br />
30 7 LS 0.11 0.73 191 1.06 4.65 3.32 0.26 1.52 505 48.3 3.1 86.2 135.4 2.1 12.8<br />
40 5 ERS 0.14 1.18 172 1.36 5.79 1.87 0.34 1.01 546 48.7 3.1 85.5 142.5 1.7 8.0<br />
50 5 ERS 0.12 0.74 183 1.33 4.65 0.95 0.41 0.83 539 49.8 3.2 84.4 153.6 1.4 8.0<br />
60 5 ERLS 0.11 1.55 203 1.55 6.26 1.31 0.96 1.17 631 51.1 3.3 84.4 153.5 1.9 8.0<br />
70 5 ERLS 0.10 1.65 195 1.31 5.48 0.99 0.97 0.75 727 51.0 3.3 84.6 151.5 1.8 6.7<br />
80 5 ERLS 0.13 2.09 170 1.16 6.58 1.07 1.16 0.75 891 50.9 3.4 86.3 134.5 1.7 6.7<br />
90 5 ERLS 0.10 1.87 141 0.89 5.74 0.90 1.38 0.61 722 51.5 3.6 88.2 115.5 1.8 4.3<br />
100 5 CS 0.11 1.83 116 0.74 6.34 1.35 1.30 0.44 807 51.6 3.6 90.2 95.5 1.7 4.3<br />
110 7 SC 0.10 1.99 162 0.99 6.37 2.26 1.25 0.54 722 51.0 3.5 89.0 107.3 1.9 4.3<br />
120 7 SC 0.10 3.15 178 0.91 7.19 2.99 2.03 0.49 755 51.2 3.6 88.7 110.2 2.5 5.1<br />
130 7 SC 0.09 3.81 198 0.96 6.99 2.74 2.42 0.50 914 51.8 3.6 87.3 123.8 3.2 5.1<br />
140 6 SC 0.09 3.93 251 1.19 7.33 3.13 2.33 0.78 1194 52.7 3.7 84.6 150.6 3.0 4.5<br />
150 6 SC 0.11 4.71 290 1.29 9.04 4.02 2.30 0.61 1530 51.1 3.7 84.3 153.5 3.2 4.5<br />
160 5 SC 0.13 3.81 243 1.06 12.4 3.59 1.37 0.78 1403 51.5 3.7 87.6 121.0 2.7 4.5<br />
170 5 SC 0.11 1.86 216 0.87 9.68 1.92 0.77 0.72 1082 51.6 3.9 89.9 98.4 2.2 3.7<br />
180 5 SC 0.13 1.44 248 0.95 11.4 1.64 0.55 1.98 841 49.8 3.9 90.4 93.2 3.4 3.7<br />
190 Sandy peat 35.9 4.1 32.3 3.3<br />
200 Peaty till 11.5 4.4 81.9 3.3<br />
Average 5.5 0.12 2.1 248 1.2 7.04 3.45 1.13 1.0 801 50.5 3.5 87.1 125.3 2.4 6.7<br />
15
<strong>Geologian</strong> <strong>tutkimuskeskus</strong>, Tutkimusraportti <strong>196</strong> – Geological Survey <strong>of</strong> Finland, <strong>Report</strong> <strong>of</strong> <strong>Investigation</strong> <strong>196</strong>, 2012<br />
Markku Mäkilä, Kirsti Loukola-Ruskeeniemi and Heikki Säävuori<br />
16<br />
Table 5.<br />
Depth Humi<strong>fi</strong>- Peat Co Cu Fe Mn Ni Pb U Zn S C pH Water Dry Ash Conduccm<br />
cation type g/m 3 g/m 3 g/m 3 g/m 3 g/m 3 g/m 3 g/m 3 g/m 3 g/m 3 % cont. % density % tivity<br />
<strong>of</strong> dry <strong>of</strong> wet in situ <strong>of</strong> dry mS/m<br />
weight weight kg/m 3 weight 18 °C<br />
10 2 NS 0.27 2.90 2636 9.04 2.30 2.40 0.06 10.5 224 43.8 3.5 85.3 100.6 6.6 3.5<br />
20 5 LCS 0.24 11.3 2644 1.10 2.74 1.98 0.37 5.7 728 48.2 3.6 84.1 155.5 6.4 3.5<br />
30 6 LCS 0.20 26.1 1983 0.98 3.10 1.77 0.53 7.0 976 46.9 3.7 85.1 144.8 10.1 3.5<br />
40 7 SC 0.27 37.4 3470 2.93 3.51 0.48 0.44 29.8 1293 40.3 4.2 85.7 135.5 20.8 4.5<br />
50 7 SC 0.51 11.5 1206 8.85 4.41 0.17 0.19 33.2 1285 29.7 4.4 86.3 124.7 41.7 4.5<br />
60 8 SC 1.18 11.2 2404 9.24 9.3 0.46 0.22 37.9 1878 34.9 4.3 87.1 119.6 29.8 4.5<br />
70 7 LSC 2.25 10.5 3550 8.48 17.9 0.15 0.19 62.6 2988 30.5 3.1 88.0 110.2 31.7 8.5<br />
80 6 SC 2.05 10.0 3439 8.73 16.0 0.13 0.21 69.4 2700 35.1 3.2 89.0 102.7 21.9 8.5<br />
90 7 SC 2.46 13.6 3667 7.73 16.8 0.07 0.24 90.3 3032 30.7 3.3 87.7 113.5 30.3 10.1<br />
100 7 SC 3.87 16.6 4561 6.39 25.1 0.06 0.30 115 4025 26.1 3.3 87.5 114.0 36.7 10.1<br />
110 8 LSC 3.63 20.6 4750 6.49 25.8 0.07 0.39 118 3921 28.0 3.3 87.8 112.0 32.5 10.1<br />
120 8 LSC 4.39 26.0 5362 6.12 34.1 0.07 0.50 168 4630 26.5 3.3 87.7 112.7 34.1 9.5<br />
130 7 LSC 4.44 29.2 6254 5.71 35.8 0.08 0.67 185 5456 25.0 3.2 87.2 117.3 35.2 9.5<br />
140 7 LSC 4.00 40.4 8149 5.17 36.6 0.11 0.89 202 7407 23.8 3.4 86.1 127.9 36.4 11.7<br />
150 7 SC 2.54 44.0 12134 5.01 35.7 0.20 1.18 276 11367 23.2 3.3 83.8 150.6 36.9 11.7<br />
160 7 SC 2.72 41.9 10483 4.58 34.1 0.18 1.08 278 9715 23.5 3.7 84.9 139.6 37.3 11.7<br />
170 8 SC 2.90 46.3 11279 4.06 38.9 0.20 1.17 340 10707 23.5 3.6 84.6 142.9 35.6 12.5<br />
180 7 SC 2.66 40.8 12980 3.15 37.2 0.19 0.99 311 12379 23.2 3.8 84.6 143.1 34.9 12.5<br />
190 6 BC 2.55 32.0 13341 2.10 36.2 0.16 0.76 272 12699 21.1 3.2 85.2 136.5 37.6 16.5<br />
200 6 BC 2.67 32.9 15794 1.68 42.5 0.11 0.73 351 15504 20.6 3.1 84.4 144.9 35.7 16.5<br />
210 6 BC 3.73 26.8 16569 1.93 62.3 0.18 0.54 728 16707 22.2 3.7 85.1 138.1 35.3 16.5<br />
220 6 SC 2.53 17.5 13141 3.45 44.8 0.07 0.53 421 18883 18.8 3.5 83.5 153.5 36.9 21.5<br />
230 7 LSC 2.22 17.1 13701 4.32 50.9 0.12 0.48 193 24977 14.9 3.6 80.3 183.7 43.3 21.5<br />
240 7 LSC 4.00 19.4 17253 3.19 117.6 0.66 0.93 304 26129 16.1 3.2 79.5 192.1 40.9 27.8<br />
250 7 EQLSC 4.64 22.6 14483 3.86 125.2 1.17 1.73 720 20808 24.8 2.8 82.4 165.1 33.7 27.8<br />
260 Peaty till 9.65 68.3 36.7<br />
Average 6.6 2.5 24.3 8209 5.0 34.3 0.4 0.6 213 8817 28.1 3.5 85.3 135.3 31.3 11.9
<strong>Geologian</strong> <strong>tutkimuskeskus</strong>, Tutkimusraportti <strong>196</strong> – Geological Survey <strong>of</strong> Finland, <strong>Report</strong> <strong>of</strong> <strong>Investigation</strong> <strong>196</strong>, 2012<br />
High pre-mining metal concentrations and conductivity in peat around the Talvivaara nickel deposit, eastern Finland<br />
Table 6.<br />
Depth Humi<strong>fi</strong>- Peat Co Cu Fe Mn Ni Pb U Zn S C pH Water Dry Ash Conduccm<br />
cation type g/m 3 g/m 3 g/m 3 g/m 3 g/m 3 g/m 3 g/m 3 g/m 3 g/m 3 % cont. % density % tivity<br />
<strong>of</strong> dry <strong>of</strong> wet in situ <strong>of</strong> dry mS/m<br />
weight weight kg/m 3 weight 18 °C<br />
10 2 NS 0.14 1.76 413 4.66 2.10 1.70 0.12 3.93 512 45.1 3.4 83.3 100.6 6.4 7.3<br />
20 7 LS 0.22 4.44 628 1.83 4.39 1.64 0.25 4.73 1409 47.9 3.5 83.5 161.9 4.7 7.3<br />
30 7 LS 0.25 2.98 550 3.97 4.60 0.48 0.13 7.89 1371 48.2 3.6 85.2 144.8 5.2 7.3<br />
40 6 LCS 0.25 2.24 503 3.29 4.99 0.25 0.14 9.27 1382 48.6 3.7 85.3 143.8 5.3 5.4<br />
50 6 LCS 0.28 1.92 565 4.97 5.28 0.27 0.15 11.82 1473 47.9 3.8 84.8 148.7 5.9 5.4<br />
60 4 LCS 0.24 1.90 515 6.33 4.05 0.22 0.07 8.43 1156 47.8 4.2 88.2 114.5 5.1 5.4<br />
70 5 LSC 0.29 1.98 743 11.15 4.83 0.10 0.07 10.75 1589 47.5 4.1 86.7 129.2 5.6 8.9<br />
80 5 LSC 0.24 2.51 860 12.72 4.92 0.10 0.11 11.31 1624 48.0 4.2 87.5 121.2 6.1 10.4<br />
90 5 LSC 0.21 3.14 1011 16.63 5.25 0.11 0.15 11.02 1884 47.5 4.3 86.6 130.0 6.6 13.6<br />
100 5 LSC 0.18 3.06 969 15.28 4.33 0.11 0.13 12.73 1732 48.3 4.3 86.9 127.3 5.2 13.6<br />
110 5 LSC 0.16 2.23 824 12.81 3.57 0.11 0.09 5.90 1767 49.5 4.6 87.8 118.6 4.6 13.6<br />
120 5 LSC 0.17 3.84 1188 17.84 5.38 0.17 0.20 16.97 2071 48.8 4.5 85.2 143.8 6.5 15.1<br />
Average 5.2 0.22 2.67 731 9.29 4.47 0.44 0.13 9.56 1497 47.9 4.0 85.9 132.0 5.6 9.4<br />
17
<strong>Geologian</strong> <strong>tutkimuskeskus</strong>, Tutkimusraportti <strong>196</strong> – Geological Survey <strong>of</strong> Finland, <strong>Report</strong> <strong>of</strong> <strong>Investigation</strong> <strong>196</strong>, 2012<br />
Markku Mäkilä, Kirsti Loukola-Ruskeeniemi and Heikki Säävuori<br />
At study site M2 in the black schist area, the<br />
average concentrations <strong>of</strong> copper, nickel, zinc<br />
and sulphur in the peat were many times higher<br />
than average values reported by Virtanen (2005)<br />
from Ostrobothnia in western Finland (Table 7).<br />
These differences were particularly signi<strong>fi</strong>cant<br />
for zinc, nickel, cobolt and sulphur. At the black<br />
schist study site M3, Zn, Ni and S concentrations<br />
showed the greatest differences when compared<br />
with average values from Ostrobothia. At study<br />
site M1, located in an area <strong>of</strong> mica schists with<br />
black schist intercalations, element concentrations<br />
were closer to the average values <strong>of</strong> Ostrobothnia<br />
(Table 7).<br />
The concentrations <strong>of</strong> Co, Cu, Fe, Mn, Ni, Zn<br />
and S were greater in peat at black schist study site<br />
M3 than at mica schist study site M1. However,<br />
the above-mentioned concentrations, apart from<br />
those for Mn, were signi<strong>fi</strong>cantly greater at study<br />
18<br />
site M2 in an area where hydrologically modi<strong>fi</strong>ed<br />
peat overlies black schist than at study sites M1 or<br />
M3, (Tables 1−6).<br />
At study sites M1 and M3 the concentrations<br />
<strong>of</strong> cobalt remained relatively constant with increasing<br />
depth (Fig. 11). At M2 the cobalt concentration<br />
increased more than tenfold from the<br />
surface down to a depth <strong>of</strong> 0.3 m, after which the<br />
concentration remained relatively constant.<br />
The copper concentration also increased as a<br />
function <strong>of</strong> depth (Fig. 12). At the black schist<br />
study sites M2 and M3 the peak copper concentration<br />
was recorded at a depth <strong>of</strong> less than half<br />
a metre, while at the mica schist study site M1 the<br />
peak was close to the bottom <strong>of</strong> the peat layer.<br />
The iron concentration increased at all study<br />
sites as a function <strong>of</strong> depth below 50 cm, the largest<br />
increase being recorded at study site M2 (Fig.<br />
13).<br />
Table 7. The average concentrations <strong>of</strong> selected trace elements and sulphur at study sites M1, M2 and M3 at Talvivaara. Results<br />
from peatlands <strong>of</strong> northern Ostrobothnia were used as reference values for comparison (Virtanen 2005). Red background<br />
colour indicates higher concentrations and blue background lower concentrations compared to average values provided by<br />
Virtanen (2005). The Talvivaara ore has rather low Pb concentrations, which is evident in the comparative data: the Pb content<br />
<strong>of</strong> peat at Talvivaara is lower than in Ostrobothnia.<br />
Co Cu Fe Mn Ni Pb Zn S<br />
Study site mg/kg mg/kg mg/kg mg/kg mg/kg mg/kg mg/kg mg/kg<br />
M1 0.9 17.0 2091 10.0 7.0 3.5 8.9 6522<br />
M2 19.0 179.4 57 879 40.2 238.9 3.4 1501 59 744<br />
M3 1.7 20.0 5587 72.3 33.8 3.4 72.5 11 332<br />
Virtanen (2005) 1.3 7.8 7710 83.9 3.9 4.2 8.9 1611<br />
norm. concent.)<br />
Depth [cm]<br />
Co concentration [mg/kg]<br />
0.1 1 10 100<br />
0<br />
50<br />
100<br />
150<br />
200<br />
250<br />
Fig. 11. Cobalt concentrations in peat at study sites M1, M2 and M3. The scale is logarithmic for Co.<br />
M1<br />
M2<br />
M3
<strong>Geologian</strong> <strong>tutkimuskeskus</strong>, Tutkimusraportti <strong>196</strong> – Geological Survey <strong>of</strong> Finland, <strong>Report</strong> <strong>of</strong> <strong>Investigation</strong> <strong>196</strong>, 2012<br />
High pre-mining metal concentrations and conductivity in peat around the Talvivaara nickel deposit, eastern Finland<br />
Depth [cm]<br />
1<br />
0<br />
10 100 1000<br />
M1<br />
50<br />
100<br />
150<br />
200<br />
250<br />
Fig. 12. Copper concentrations in peat at study sites M1, M2 and M3. The scale is logarithmic for Cu.<br />
Depth [cm]<br />
0<br />
50<br />
100<br />
150<br />
200<br />
250<br />
Cu concentration [mg/kg]<br />
1000 10000 100000<br />
Fig. 13. Iron concentrations at study sites M1, M2 and M3. The scale is logarithmic for Fe.<br />
Depth [cm]<br />
Fe concentration [mg/kg]<br />
Mn concentration [mg/kg]<br />
1<br />
0<br />
10 100 1000<br />
50<br />
M1<br />
M2<br />
M3<br />
100<br />
150<br />
200<br />
250<br />
Fig. 14. Manganese concentrations at study sites M1, M2 and M3. The scale is logarithmic for Mn.<br />
M2<br />
M3<br />
M1<br />
M2<br />
M3<br />
19
<strong>Geologian</strong> <strong>tutkimuskeskus</strong>, Tutkimusraportti <strong>196</strong> – Geological Survey <strong>of</strong> Finland, <strong>Report</strong> <strong>of</strong> <strong>Investigation</strong> <strong>196</strong>, 2012<br />
Markku Mäkilä, Kirsti Loukola-Ruskeeniemi and Heikki Säävuori<br />
Manganese concentrations were high in the uppermost<br />
sur<strong>fi</strong>cial peat at all study sites (Fig. 14).<br />
Manganese was enriched at the peatland surface.<br />
However, the minimum manganese concentration<br />
at all study sites was recorded at a depth <strong>of</strong> 20 cm.<br />
Below the surface, the manganese concentration<br />
remained relatively constant with depth at study<br />
site M1, while at M3 it increased towards the bottom<br />
<strong>of</strong> the peat layer. At study site M2, the manganese<br />
concentration increased from the surface<br />
to a depth <strong>of</strong> 80 cm, below which the concentration<br />
steadily decreased towards the bottom.<br />
The nickel concentration increased towards the<br />
bottom at all study sites, the largest increase being<br />
recorded at study site M2 (Fig. 15). Nickel was<br />
enriched in the bottom peatland layers.<br />
The lead concentration was greatest near the<br />
surface <strong>of</strong> the peat layer at all study sites (Fig. 16).<br />
20<br />
Depth [cm]<br />
0<br />
50<br />
100<br />
150<br />
200<br />
250<br />
Lead was enriched at the peatland surface. Lead<br />
concentrations decreased downwards to a depth<br />
<strong>of</strong> less than a metre, after which they increased<br />
again. The average lead concentration was the<br />
same at each study site, which reflects the concentrations<br />
<strong>of</strong> bedrock and soil (Tables 1–3). The Talvivaara<br />
black schists tend not be enriched in Pb<br />
when compared to the average mica schists, which<br />
could also indicate that lead effectively binds to<br />
humic substances and is not easily transported<br />
through the soil.<br />
Uranium concentrations in the peat increased<br />
towards the bottom, with the exception <strong>of</strong> study<br />
site M3 (Fig. 17). At study site M3 the uranium<br />
concentration began to increase below a depth<br />
<strong>of</strong> 70 cm. The maximum uranium concentrations<br />
were recorded close to the soil.<br />
Except near the peat surface, the concentra-<br />
Ni concentration [mg/kg]<br />
1 10 100 1000<br />
Fig. 15. Nickel concentrations at study sites M1, M2 and M3. The scale is logarithmic for Ni.<br />
Depth [cm]<br />
0.1<br />
0<br />
1 10 100<br />
M1<br />
50<br />
100<br />
150<br />
200<br />
250<br />
Pb concentration [mg/kg]<br />
Fig. 16. Lead concentrations at study sites M1, M2 and M3. The scale is logarithmic for Pb.<br />
M1<br />
M2<br />
M3<br />
M2<br />
M3
<strong>Geologian</strong> <strong>tutkimuskeskus</strong>, Tutkimusraportti <strong>196</strong> – Geological Survey <strong>of</strong> Finland, <strong>Report</strong> <strong>of</strong> <strong>Investigation</strong> <strong>196</strong>, 2012<br />
High pre-mining metal concentrations and conductivity in peat around the Talvivaara nickel deposit, eastern Finland<br />
Depth [cm]<br />
0.1 1 10<br />
0<br />
50<br />
100<br />
150<br />
200<br />
250<br />
U concentration [mg/kg]<br />
Fig. 17. Uranium concentrations at study sites M1, M2 and M3. The scale is logarithmic for U.<br />
Depth [cm]<br />
0<br />
50<br />
100<br />
150<br />
200<br />
250<br />
tion <strong>of</strong> zinc increased as a function <strong>of</strong> depth at<br />
the black schist study sites M2 and M3 (Fig. 18).<br />
The zinc concentration decreased with depth at<br />
the mica schist study site M1, at least to a depth<br />
<strong>of</strong> one and a half metres, after which the concentration<br />
increased again. The average zinc content<br />
at study site M2 was 168 times greater than at M1<br />
(Table 7).<br />
The acidity <strong>of</strong> the peat layers decreased downwards,<br />
as seen at M1 and M3 (Fig. 18). At study<br />
site M2, acidity decreased down to a depth <strong>of</strong><br />
about 50 cm, after which there was a sharp reversal<br />
in trend. Because the surrounding bedrock was<br />
sulphide-rich, pH values were also anomalous at<br />
M2. The pH <strong>of</strong> peat is usually lowest in the surface<br />
layer (regional average 3.1–3.7) (Virtanen et<br />
al. 2003). The pH <strong>of</strong> the surface peat is dependent<br />
Zn concentration [mg/kg]<br />
1 10 100 1000 10000<br />
Fig. 18. Zinc concentrations at study sites M1, M2 and M3. The scale is logarithmic for Zn.<br />
M1<br />
M2<br />
M3<br />
M1<br />
M2<br />
M3<br />
upon the availability <strong>of</strong> hydrogen ions in Sphagnum<br />
peat, in that free hydrogen ions are produced<br />
by the cation exchange in the Sphagnum peat and<br />
organic acids are released by the aerobic decomposition<br />
<strong>of</strong> Sphagnum (Shotyk 1988).<br />
The pH value increases with depth in the peat<br />
layer. A high sulphur concentration causes a lowering<br />
<strong>of</strong> pH and an increase in conductivity (see<br />
Figs. 19–20). The average pH values for bottom<br />
peat layer in Finland range from 4.5 to 4.9 (Virtanen<br />
et al. 2003). At study site M1, pH levels<br />
were closest to the Finnish average, whereas the<br />
largest differences were found at the black schist<br />
study site M2; at this site the pH <strong>of</strong> the bottom<br />
peat layer (2.8–3.7) was the same or lower than<br />
the Finnish average values for surface peat.<br />
The sulphide concentration <strong>of</strong> study site M1<br />
21
<strong>Geologian</strong> <strong>tutkimuskeskus</strong>, Tutkimusraportti <strong>196</strong> – Geological Survey <strong>of</strong> Finland, <strong>Report</strong> <strong>of</strong> <strong>Investigation</strong> <strong>196</strong>, 2012<br />
Markku Mäkilä, Kirsti Loukola-Ruskeeniemi and Heikki Säävuori<br />
22<br />
Depth [cm]<br />
2.5<br />
0<br />
3 3.5 4 4.5 5<br />
M1<br />
50<br />
100<br />
150<br />
200<br />
250<br />
Fig. 19. Acidity (pH value) at study sites M1, M2 and M3.<br />
Depth [cm]<br />
pH value<br />
1000<br />
0<br />
10000 100000 1000000<br />
M1<br />
50<br />
100<br />
150<br />
200<br />
250<br />
S concentration [mg/kg]<br />
Fig. 20. Sulphur concentrations at study sites M1, M2 and M3. The scale is logarithmic for S.<br />
was lower than at M3 and markedly less than at<br />
M2 (Fig. 20). Sulphur concentrations increased as<br />
a function <strong>of</strong> depth at all the study sites, most notably<br />
at M2 (Fig. 20). The increasing effect <strong>of</strong> the<br />
underlying soil was seen at the bottom <strong>of</strong> study<br />
sites M1 and M2. Essentially, sulphur in peat is<br />
transported from the underlying soil via plant<br />
roots. Sulphur is also likely to have risen into the<br />
peat layer by capillary flow, and then to have become<br />
bound to the peat. The high sulphur concentrations<br />
appear to be influenced most strongly<br />
by the bedrock in the black schist areas, while at<br />
study site M2, acidic drainage has also contributed<br />
signi<strong>fi</strong>cantly to the elevated S concentrations.<br />
The highest average sulphur concentrations reported<br />
for Finnish peatlands are from the black<br />
schist areas <strong>of</strong> North Karelia (Herranen 2010),<br />
M2<br />
M3<br />
M2<br />
M3<br />
which together account for approximately a third<br />
<strong>of</strong> the peatlands with the highest average sulphur<br />
concentrations in Finland. Virtanen and Lerssi<br />
(2006) observed that some element concentrations<br />
in peat are typically elevated in areas underlain<br />
by black schists; sulphur concentrations for<br />
example, may be up to 50–100 times greater than<br />
background levels.<br />
At study sites M1 and M3 the carbon content<br />
remained relatively constant with increasing<br />
depth. However, at study site M2, the carbon content<br />
decreased with depth, along with a coincident<br />
increase in ash content (Fig. 21).<br />
At the black schist study sites M2 and M3,<br />
the water content in peat increased from the surface<br />
down to a depth <strong>of</strong> about 0.6 m, mainly due<br />
to peatland drainage activities which had been
<strong>Geologian</strong> <strong>tutkimuskeskus</strong>, Tutkimusraportti <strong>196</strong> – Geological Survey <strong>of</strong> Finland, <strong>Report</strong> <strong>of</strong> <strong>Investigation</strong> <strong>196</strong>, 2012<br />
High pre-mining metal concentrations and conductivity in peat around the Talvivaara nickel deposit, eastern Finland<br />
Depth [cm]<br />
0<br />
50<br />
100<br />
150<br />
200<br />
250<br />
Fig. 21. Carbon content at study sites M1, M2 and M3.<br />
Depth [cm]<br />
particularly intensive in the Talvivaara area in<br />
the <strong>196</strong>0s (Fig. 22). The water table in the peat<br />
shows slight seasonal variations but was located<br />
at a depth <strong>of</strong> about half a metre at each <strong>of</strong> the<br />
study sites. Below this depth, the water content<br />
decreased most markedly at study site M2. Acidic<br />
waters had also displaced the peat pore waters;<br />
this was particulary evident at study site M2,<br />
where the ash content was high and the water content<br />
low (Table 2). There was a distinct correlation<br />
between the water content and the concentrations<br />
<strong>of</strong> analysed metals.<br />
At study site M1, the ash content <strong>of</strong> the peat<br />
layer was representative <strong>of</strong> the average ash content<br />
<strong>of</strong> peatlands in Finland, but the ash content<br />
was anomalously high at study site M2 (Fig. 23).<br />
According to Mäkilä (1994), the average ash con-<br />
C content [%]<br />
0 10 20 30 40 50 60 70<br />
79 81<br />
0<br />
50<br />
100<br />
150<br />
200<br />
250<br />
Fig. 22. Water content at study sites M1, M2 and M3.<br />
Water content [%]<br />
M1<br />
M2<br />
M3<br />
83 85 87 89 91 93<br />
M1<br />
M2<br />
M3<br />
tents <strong>of</strong> different peat types are 4.0% in Sphagnum-<br />
Carex peat, 3.8% in Carex peat, 3.4% in Carex-<br />
Sphagnum peat and 1.6% in Sphagnum peat. The<br />
degree <strong>of</strong> humi<strong>fi</strong>cation <strong>of</strong> peat also affects the ash<br />
content, although its effect is smaller than that<br />
due to the peat type. The elements contained in<br />
ash and their various resultant compounds constitute<br />
the inorganic component <strong>of</strong> the chemical<br />
composition <strong>of</strong> peat. Peat ash is derived from<br />
peatland vegetation (primary ash) and surrounding<br />
mineral matter (secondary ash). Material is<br />
classi<strong>fi</strong>ed as peat when the proportion <strong>of</strong> organic<br />
dry mass is at least 75%. At study site M2 in particular,<br />
the ash content was very high, so that with<br />
the exception <strong>of</strong> the peat surface the ash content<br />
exceeded the 25% threshold.<br />
Electrical conductivity increased from top to<br />
23
<strong>Geologian</strong> <strong>tutkimuskeskus</strong>, Tutkimusraportti <strong>196</strong> – Geological Survey <strong>of</strong> Finland, <strong>Report</strong> <strong>of</strong> <strong>Investigation</strong> <strong>196</strong>, 2012<br />
Markku Mäkilä, Kirsti Loukola-Ruskeeniemi and Heikki Säävuori<br />
bottom at the black schist study sites M2 and<br />
M3 (Fig. 24). At study site M1, conductivity de-<br />
24<br />
Depth [cm]<br />
0<br />
50<br />
100<br />
150<br />
200<br />
250<br />
0 5 10 15<br />
Fig. 23. Ash content at study sites M1, M2 and M3.<br />
Depth [cm]<br />
0<br />
50<br />
100<br />
150<br />
200<br />
250<br />
Figure 25 presents statistically signi<strong>fi</strong>cant correlations<br />
between each <strong>of</strong> the parameters analysed<br />
at study sites M1, M2 and M3, computed using<br />
the Spearman method. Dark blue and light blue<br />
colours indicate a negative correlations with signi<strong>fi</strong>cance<br />
levels <strong>of</strong>
M1<br />
Co<br />
Cu<br />
Ni<br />
Pb<br />
U<br />
Fe<br />
Mn<br />
S<br />
Zn<br />
pH<br />
WaterCont.<br />
DryDensity<br />
Ash<br />
C<br />
Conductivity<br />
Depth<br />
Humi<strong>fi</strong>cation<br />
M3 Co<br />
Co<br />
Cu<br />
Ni<br />
Pb<br />
U<br />
Fe<br />
Mn<br />
S<br />
Zn<br />
pH<br />
WaterCont.<br />
DryDensity<br />
Ash<br />
C<br />
Conductivity<br />
Depth<br />
Humi<strong>fi</strong>cation<br />
Co<br />
Cu<br />
Ni<br />
Pb<br />
<strong>Geologian</strong> <strong>tutkimuskeskus</strong>, Tutkimusraportti <strong>196</strong> – Geological Survey <strong>of</strong> Finland, <strong>Report</strong> <strong>of</strong> <strong>Investigation</strong> <strong>196</strong>, 2012<br />
High pre-mining metal concentrations and conductivity in peat around the Talvivaara nickel deposit, eastern Finland<br />
U<br />
Fe<br />
Cu<br />
Ni<br />
Pb<br />
U<br />
Fe<br />
Mn<br />
Mn<br />
S<br />
S<br />
Zn<br />
Zn<br />
pH<br />
WaterCont.<br />
pH<br />
WaterCont.<br />
DryDensity<br />
Ash<br />
DryDensity<br />
Ash<br />
C<br />
Conductivity<br />
C<br />
Conductivity<br />
Depth<br />
Humi<strong>fi</strong>cation<br />
tivity correlate with other analysed elements and<br />
peat properties.<br />
At study site M1, iron correlated most strongly<br />
with ash content, lead and zinc (Fig. 26). Iron<br />
showed a strong positive correlation with Ni, S,<br />
Zn, U, Co and conductivity at study site M2. At<br />
study site M3, iron had a strongly positive correlation<br />
with conductivity, manganese and sulphur,<br />
and a strongly negative correlation with cobalt<br />
and lead.<br />
At study site M1, uranium showed a strongly<br />
positive correlation with copper, sulphur, nickel<br />
and pH and a negative correlation with conductivity<br />
(Fig. 27). Uranium had a strongly positive<br />
correlation with Cu, Zn, Fe, Ni, conductivity, S<br />
and Co at study site M2 and a negative correlation<br />
with Mn. At study site M3, uranium was<br />
strongly correlated with Co.<br />
At study site M1, a positive correlation was ob-<br />
M2 Co<br />
Co<br />
Cu<br />
Ni<br />
Pb<br />
U<br />
Fe<br />
Mn<br />
S<br />
Zn<br />
pH<br />
WaterCont.<br />
DryDensity<br />
Ash<br />
C<br />
Conductivity<br />
Depth<br />
Humi<strong>fi</strong>cation<br />
Cu<br />
Ni<br />
Pb<br />
U<br />
Fe<br />
Mn<br />
S<br />
Zn<br />
pH<br />
WaterCont.<br />
DryDensity<br />
Ash<br />
C<br />
Conductivity<br />
Depth<br />
Humi<strong>fi</strong>cation<br />
Pos. correlation is signi<strong>fi</strong>cant at the 0.01 level (2-tailed).<br />
Pos. correlation is signi<strong>fi</strong>cant at the 0.05 level (2-tailed).<br />
Neg. correlation is signi<strong>fi</strong>cant at the 0.01 level (2-tailed).<br />
Neg. correlation is signi<strong>fi</strong>cant at the 0.05 level (2-tailed).<br />
Fig. 25. Statistically signi<strong>fi</strong>cant correlations between the studied properties at study sites M1, M2 and M3.<br />
Depth<br />
Humi<strong>fi</strong>cation<br />
served between sulphur and copper, pH, uranium<br />
and nickel, but a signi<strong>fi</strong>cant negative correlation<br />
was found between sulphur and conductivity (Fig.<br />
28). Signi<strong>fi</strong>cant positive correlations between sulphur<br />
and conductivity, nickel, iron and zinc were<br />
recorded at the black schist study site M2 (Figs.<br />
24 and 28). It is probable that the iron and the<br />
sulphur have combined to form an iron-sulphur<br />
compound in the peat (Virtanen & Lerssi 2006).<br />
Iron-sulphur compounds in peat appear to reduce<br />
the pH <strong>of</strong> peat when present at high concentrations.<br />
This effect becomes apparent when the<br />
contents <strong>of</strong> both iron and sulphur exceed 1% <strong>of</strong><br />
dry mass (Virtanen & Lerssi 2006). In the present<br />
data, an effect on pH levels is discernible at study<br />
site M2 when the contents <strong>of</strong> both iron and sulphur<br />
were approximately 20 000 mg/kg or 2 000 g/<br />
peatland-m 3 (Tables 2 and 5). At the black schist<br />
study site M3, a signi<strong>fi</strong>cant positive correlation<br />
25
<strong>Geologian</strong> <strong>tutkimuskeskus</strong>, Tutkimusraportti <strong>196</strong> – Geological Survey <strong>of</strong> Finland, <strong>Report</strong> <strong>of</strong> <strong>Investigation</strong> <strong>196</strong>, 2012<br />
Markku Mäkilä, Kirsti Loukola-Ruskeeniemi and Heikki Säävuori<br />
26<br />
Fe<br />
Spearman’s correlation coef<strong>fi</strong>cient<br />
Spearman’s correlation coef<strong>fi</strong>cient<br />
Spearman’s correlation coef<strong>fi</strong>cient<br />
1.0<br />
0.8<br />
0.6<br />
0.4<br />
0.2<br />
0<br />
-0.2<br />
-0.4<br />
-0.6<br />
-0.8<br />
-1.0<br />
1.0<br />
0.8<br />
0.6<br />
0.4<br />
0.2<br />
0<br />
-0.2<br />
-0.4<br />
-0.6<br />
-0.8<br />
-1.0<br />
1.0<br />
0.8<br />
0.6<br />
0.4<br />
0.2<br />
0<br />
-0.2<br />
-0.4<br />
-0.6<br />
-0.8<br />
-1.0<br />
WaterCont.<br />
C<br />
Conductivity<br />
Humi<strong>fi</strong>cation<br />
U<br />
Cu<br />
S<br />
Co<br />
C<br />
M1<br />
M2<br />
M3<br />
Co<br />
Pb<br />
WaterCont.<br />
pH<br />
Mn<br />
Pb<br />
Humi<strong>fi</strong>cation<br />
Humi<strong>fi</strong>cation<br />
DryDensity<br />
C<br />
WaterCont.<br />
Cu<br />
DryDensity<br />
U<br />
Ni<br />
Ash<br />
Zn<br />
Cu<br />
pH<br />
Pos. correlation is signi<strong>fi</strong>cant at the 0.01 level (2-tailed).<br />
Pos. correlation is signi<strong>fi</strong>cant at the 0.05 level (2-tailed).<br />
Neg. correlation is signi<strong>fi</strong>cant at the 0.01 level (2-tailed).<br />
Neg. correlation is signi<strong>fi</strong>cant at the 0.05 level (2-tailed).<br />
Depth<br />
DryDensity<br />
Mn<br />
pH<br />
Ni<br />
Zn<br />
Pb<br />
Ash<br />
Fe<br />
Ash<br />
Co<br />
U<br />
Zn<br />
S<br />
Conductivity<br />
Ni<br />
Depth<br />
Fe<br />
S<br />
Depth<br />
Mn<br />
Conductivity<br />
Fe<br />
Fig. 26. The statistically most signi<strong>fi</strong>cant correlations between iron and other measured variables at study sites M1, M2 and<br />
M3.
<strong>Geologian</strong> <strong>tutkimuskeskus</strong>, Tutkimusraportti <strong>196</strong> – Geological Survey <strong>of</strong> Finland, <strong>Report</strong> <strong>of</strong> <strong>Investigation</strong> <strong>196</strong>, 2012<br />
High pre-mining metal concentrations and conductivity in peat around the Talvivaara nickel deposit, eastern Finland<br />
U<br />
Spearman’s correlation coef<strong>fi</strong>cient<br />
Spearman’s correlation coef<strong>fi</strong>cient<br />
Spearman’s correlation coef<strong>fi</strong>cient<br />
1.0<br />
0.8<br />
0.6<br />
0.4<br />
0.2<br />
0<br />
-0.2<br />
-0.4<br />
-0.6<br />
-0.8<br />
-1.0<br />
1.0<br />
0.8<br />
0.6<br />
0.4<br />
0.2<br />
0<br />
-0.2<br />
-0.4<br />
-0.6<br />
-0.8<br />
-1.0<br />
1.0<br />
0.8<br />
0.6<br />
0.4<br />
0.2<br />
0<br />
-0.2<br />
-0.4<br />
-0.6<br />
-0.8<br />
-1.0<br />
M1<br />
M2<br />
C<br />
Conductivity<br />
WaterCont.<br />
Zn<br />
Co<br />
WaterCont.<br />
Mn<br />
pH<br />
WaterCont.<br />
pH<br />
S<br />
Depth<br />
Co<br />
Mn<br />
C<br />
Zn<br />
Conductivity<br />
Fe<br />
M3<br />
Fe<br />
Mn<br />
Pb<br />
C<br />
Humi<strong>fi</strong>cation<br />
Ash<br />
DryDensity<br />
pH<br />
Ni<br />
Depth<br />
Pb<br />
Humi<strong>fi</strong>cation<br />
Ash<br />
DryDensity<br />
Co<br />
S<br />
Conductivity<br />
Ni<br />
Fe<br />
Depth<br />
Zn<br />
Cu<br />
Humi<strong>fi</strong>cation<br />
Ni<br />
Pos. correlation is signi<strong>fi</strong>cant at the 0.01 level (2-tailed).<br />
Pos. correlation is signi<strong>fi</strong>cant at the 0.05 level (2-tailed).<br />
Neg. correlation is signi<strong>fi</strong>cant at the 0.01 level (2-tailed).<br />
Neg. correlation is signi<strong>fi</strong>cant at the 0.05 level (2-tailed).<br />
S<br />
Cu<br />
Ash<br />
Pb<br />
Cu<br />
DryDensity<br />
Fig. 27. The statistically most signi<strong>fi</strong>cant correlations between uranium and other investigated parameters at study sites M1,<br />
M2 and M3.<br />
U<br />
U<br />
U<br />
27
<strong>Geologian</strong> <strong>tutkimuskeskus</strong>, Tutkimusraportti <strong>196</strong> – Geological Survey <strong>of</strong> Finland, <strong>Report</strong> <strong>of</strong> <strong>Investigation</strong> <strong>196</strong>, 2012<br />
Markku Mäkilä, Kirsti Loukola-Ruskeeniemi and Heikki Säävuori<br />
28<br />
S<br />
Spearman’s correlation coef<strong>fi</strong>cient<br />
Spearman’s correlation coef<strong>fi</strong>cient<br />
Spearman’s correlation coef<strong>fi</strong>cient<br />
1.0<br />
0.8<br />
0.6<br />
0.4<br />
0.2<br />
0<br />
-0.2<br />
-0.4<br />
-0.6<br />
-0.8<br />
-1.0<br />
1.0<br />
0.8<br />
0.6<br />
0.4<br />
0.2<br />
0<br />
-0.2<br />
-0.4<br />
-0.6<br />
-0.8<br />
-1.0<br />
1.0<br />
0.8<br />
0.6<br />
0.4<br />
0.2<br />
0<br />
-0.2<br />
-0.4<br />
-0.6<br />
-0.8<br />
-1.0<br />
Conductivity<br />
Zn<br />
WaterCont.<br />
Mn<br />
Co<br />
DryDensity<br />
Humi<strong>fi</strong>cation<br />
Pb<br />
Fe<br />
C<br />
C<br />
Pb<br />
M1<br />
M2<br />
M3<br />
WaterCont.<br />
Mn<br />
pH<br />
Pb<br />
DryDensity<br />
Co<br />
U<br />
Humi<strong>fi</strong>cation<br />
Cu<br />
Ash<br />
Ni<br />
C<br />
Humi<strong>fi</strong>cation<br />
Cu<br />
DryDensity<br />
Co<br />
Ash<br />
U<br />
Ash<br />
Ni<br />
Pos. correlation is signi<strong>fi</strong>cant at the 0.01 level (2-tailed).<br />
Pos. correlation is signi<strong>fi</strong>cant at the 0.05 level (2-tailed).<br />
Neg. correlation is signi<strong>fi</strong>cant at the 0.01 level (2-tailed).<br />
Neg. correlation is signi<strong>fi</strong>cant at the 0.05 level (2-tailed).<br />
U<br />
pH<br />
Cu<br />
Depth<br />
Zn<br />
Fe<br />
Ni<br />
Conductivity<br />
Depth<br />
Zn<br />
WaterCont.<br />
Fe<br />
Conductivity<br />
Mn<br />
Depth<br />
pH<br />
Fig. 28. The statistically most signi<strong>fi</strong>cant correlations between sulphur and other investigated variables at study sites M1, M2<br />
and M3.<br />
S<br />
S<br />
S
<strong>Geologian</strong> <strong>tutkimuskeskus</strong>, Tutkimusraportti <strong>196</strong> – Geological Survey <strong>of</strong> Finland, <strong>Report</strong> <strong>of</strong> <strong>Investigation</strong> <strong>196</strong>, 2012<br />
High pre-mining metal concentrations and conductivity in peat around the Talvivaara nickel deposit, eastern Finland<br />
pH<br />
Spearman’s correlation coef<strong>fi</strong>cient<br />
Spearman’s correlation coef<strong>fi</strong>cient<br />
Spearman’s correlation coef<strong>fi</strong>cient<br />
1.0<br />
0.8<br />
0.6<br />
0.4<br />
0.2<br />
0<br />
-0.2<br />
-0.4<br />
-0.6<br />
-0.8<br />
-1.0<br />
1.0<br />
0.8<br />
0.6<br />
0.4<br />
0.2<br />
0<br />
-0.2<br />
-0.4<br />
-0.6<br />
-0.8<br />
-1.0<br />
1.0<br />
0.8<br />
0.6<br />
0.4<br />
0.2<br />
0<br />
-0.2<br />
-0.4<br />
-0.6<br />
-0.8<br />
-1.0<br />
M1<br />
Conductivity<br />
DryDensity<br />
Humi<strong>fi</strong>cation<br />
Mn<br />
Zn<br />
WaterCont.<br />
Co<br />
C<br />
Pb<br />
M2<br />
M3<br />
Co<br />
Fe<br />
Ni<br />
DryDensity<br />
Co<br />
U<br />
Humi<strong>fi</strong>cation<br />
Cu<br />
Ash<br />
Ni<br />
Zn<br />
C<br />
Conductivity<br />
S<br />
Depth<br />
Zn<br />
U<br />
Pb<br />
Fe<br />
Ash<br />
U<br />
WaterCont.<br />
Mn<br />
Ash<br />
Ni<br />
Cu<br />
S<br />
Depth<br />
pH<br />
DryDensity<br />
Cu<br />
C<br />
Humi<strong>fi</strong>cation<br />
Pb<br />
pH<br />
Fe<br />
WaterCont.<br />
Conductivity<br />
Mn<br />
Pos. correlation is signi<strong>fi</strong>cant at the 0.01 level (2-tailed).<br />
Pos. correlation is signi<strong>fi</strong>cant at the 0.05 level (2-tailed).<br />
Neg. correlation is signi<strong>fi</strong>cant at the 0.01 level (2-tailed).<br />
Neg. correlation is signi<strong>fi</strong>cant at the 0.05 level (2-tailed).<br />
S<br />
Depth<br />
pH<br />
Fig. 29. The statistically most signi<strong>fi</strong>cant correlations between pH and the other measured parameters at study sites M1, M2<br />
and M3.<br />
29
<strong>Geologian</strong> <strong>tutkimuskeskus</strong>, Tutkimusraportti <strong>196</strong> – Geological Survey <strong>of</strong> Finland, <strong>Report</strong> <strong>of</strong> <strong>Investigation</strong> <strong>196</strong>, 2012<br />
Markku Mäkilä, Kirsti Loukola-Ruskeeniemi and Heikki Säävuori<br />
30<br />
Ash<br />
Spearman’s correlation coef<strong>fi</strong>cient<br />
Spearman’s correlation coef<strong>fi</strong>cient<br />
Spearman’s correlation coef<strong>fi</strong>cient<br />
1.0<br />
0.8<br />
0.6<br />
0.4<br />
0.2<br />
0<br />
-0.2<br />
-0.4<br />
-0.6<br />
-0.8<br />
-1.0<br />
1.0<br />
0.8<br />
0.6<br />
0.4<br />
0.2<br />
0<br />
-0.2<br />
-0.4<br />
-0.6<br />
-0.8<br />
-1.0<br />
1.0<br />
0.8<br />
0.6<br />
0.4<br />
0.2<br />
0<br />
-0.2<br />
-0.4<br />
-0.6<br />
-0.8<br />
-1.0<br />
M1<br />
Conductivity<br />
C<br />
WaterCont.<br />
DryDensity<br />
Co<br />
Mn<br />
Humi<strong>fi</strong>cation<br />
U<br />
S<br />
M2<br />
C<br />
M3<br />
C<br />
WaterCont.<br />
Pb<br />
pH<br />
Mn<br />
Humi<strong>fi</strong>cation<br />
WaterCont.<br />
Pb<br />
DryDensity<br />
Humi<strong>fi</strong>cation<br />
pH<br />
Co<br />
S<br />
Cu<br />
Co<br />
U<br />
Depth<br />
Cu<br />
DryDensity<br />
Conductivity<br />
Pos. correlation is signi<strong>fi</strong>cant at the 0.01 level (2-tailed).<br />
Pos. correlation is signi<strong>fi</strong>cant at the 0.05 level (2-tailed).<br />
Neg. correlation is signi<strong>fi</strong>cant at the 0.01 level (2-tailed).<br />
Neg. correlation is signi<strong>fi</strong>cant at the 0.05 level (2-tailed).<br />
U<br />
Zn<br />
Cu<br />
Ni<br />
Depth<br />
pH<br />
Pb<br />
Fe<br />
Ash<br />
Zn<br />
Fe<br />
Ni<br />
S<br />
Depth<br />
Conductivity<br />
Ash<br />
Mn<br />
Fe<br />
Ni<br />
Zn<br />
Ash<br />
Fig. 30. The statistically most signi<strong>fi</strong>cant correlations between ash content and the parameters investigated at study sites M1,<br />
M2 and M3.
<strong>Geologian</strong> <strong>tutkimuskeskus</strong>, Tutkimusraportti <strong>196</strong> – Geological Survey <strong>of</strong> Finland, <strong>Report</strong> <strong>of</strong> <strong>Investigation</strong> <strong>196</strong>, 2012<br />
High pre-mining metal concentrations and conductivity in peat around the Talvivaara nickel deposit, eastern Finland<br />
Conductivity<br />
Spearman’s correlation coef<strong>fi</strong>cient<br />
Spearman’s correlation coef<strong>fi</strong>cient<br />
Spearman’s correlation coef<strong>fi</strong>cient<br />
1.0<br />
0.8<br />
0.6<br />
0.4<br />
0.2<br />
0<br />
-0.2<br />
-0.4<br />
-0.6<br />
-0.8<br />
-1.0<br />
1.0<br />
0.8<br />
0.6<br />
0.4<br />
0.2<br />
0<br />
-0.2<br />
-0.4<br />
-0.6<br />
-0.8<br />
-1.0<br />
1.0<br />
0.8<br />
0.6<br />
0.4<br />
0.2<br />
0<br />
-0.2<br />
-0.4<br />
-0.6<br />
-0.8<br />
-1.0<br />
C<br />
Co<br />
M1<br />
M2<br />
M3<br />
Depth<br />
pH<br />
Pb<br />
S<br />
Cu<br />
U<br />
WaterCont.<br />
pH<br />
Mn<br />
Pb<br />
Ni<br />
DryDensity<br />
Humi<strong>fi</strong>cation<br />
Humi<strong>fi</strong>cation<br />
Cu<br />
DryDensity<br />
U<br />
Ni<br />
WaterCont.<br />
Ash<br />
Fig. 31. The statistically most signi<strong>fi</strong>cant correlations between conductivity and the other measured parameters at study sites<br />
M1, M2 and M3.<br />
C<br />
Ash<br />
WaterCont.<br />
C<br />
Co<br />
Fe<br />
Co<br />
Ash<br />
U<br />
Zn<br />
Cu<br />
pH<br />
Humi<strong>fi</strong>cation<br />
Pb<br />
Zn<br />
Mn<br />
DryDensity<br />
Conductivity<br />
Zn<br />
Fe<br />
Pos. correlation is signi<strong>fi</strong>cant at the 0.01 level (2-tailed).<br />
Pos. correlation is signi<strong>fi</strong>cant at the 0.05 level (2-tailed).<br />
Neg. correlation is signi<strong>fi</strong>cant at the 0.01 level (2-tailed).<br />
Neg. correlation is signi<strong>fi</strong>cant at the 0.05 level (2-tailed).<br />
S<br />
S<br />
Depth<br />
Mn<br />
Ni<br />
Depth<br />
Conductivity<br />
Fe<br />
Conductivity<br />
31
<strong>Geologian</strong> <strong>tutkimuskeskus</strong>, Tutkimusraportti <strong>196</strong> – Geological Survey <strong>of</strong> Finland, <strong>Report</strong> <strong>of</strong> <strong>Investigation</strong> <strong>196</strong>, 2012<br />
Markku Mäkilä, Kirsti Loukola-Ruskeeniemi and Heikki Säävuori<br />
was observed between sulphur and pH, manganese,<br />
conductivity and iron, but a signi<strong>fi</strong>cant negative<br />
correlation between sulphur and lead.<br />
At the mica schist study site M1, pH values<br />
displayed a positive correlation with sulphur, copper,<br />
nickel and uranium and a negative correlation<br />
with conductivity (Fig. 29). At study site M2 there<br />
was no marked association between pH and any<br />
<strong>of</strong> the analysed elements, although a negative correlation<br />
with cobalt was observed. At study site<br />
M3, pH was positively correlated with S, Mn and<br />
conductivity and negatively with Pb and Co.<br />
At study site M1 there was a marked correla-<br />
32<br />
tion between the ash content and iron, lead and<br />
pH (Fig. 30). At study site M2, a marked positive<br />
correlation was observed between the ash content<br />
and conductivity, sulphur, nickel, iron, zinc and<br />
uranium.<br />
There was a strong negative correlation between<br />
electrical conductivity and depth, pH, S<br />
and Cu at study site M1 (Fig. 31), and a clearly<br />
positive correlation <strong>of</strong> conductivity with depth,<br />
nickel, sulphur, iron and zinc at M2. Conductivity<br />
was positively correlated with iron, depth, manganese,<br />
sulphur and pH at study site M3.<br />
5 APPLICATION OF ELECTRIC CONDUCTIVITY MEASUREMENTS IN<br />
ENVIRONMENTAL STUDIES<br />
The logging probe (Fig. 9, p. 10) can be used for<br />
mapping the electrical conductivity and temperature<br />
<strong>of</strong> peatlands and underlying unconsolidated<br />
sediments. Conductivity data have been applied<br />
in the interpretation <strong>of</strong> electromagnetic (AEM)<br />
maps, and for tracing pollutants within peatlands.<br />
Electric conductivity also reflects the nutrient conditions<br />
(salinity, acidity), which, together with<br />
temperature, control the growth and decay processes<br />
within peatlands (Puranen et al. 1997, Puranen<br />
et al. 1999). Electrical conductivity correlates<br />
with the temperature and acidity (pH value)<br />
<strong>of</strong> peatland waters. A rise in temperature <strong>of</strong> one<br />
degree Celcius increases the electrical conductivity<br />
<strong>of</strong> the solution by approximately 2% (Hem 1985).<br />
Electrical conductivity measurements provide a<br />
reliable indication <strong>of</strong> anomalies in peat, and can<br />
be used as a preliminary indicator <strong>of</strong> peat conductivity<br />
(Puranen et al. 1996). The method is also<br />
more cost-effective than other geophysical techniques.<br />
The high sulphur content <strong>of</strong> peatlands in<br />
the black schist area had an effect on the high conductivity,<br />
especially in the sedge-dominated bottom<br />
and middle layers (Lerssi & Virtanen 2006).<br />
The peat layers investigated in the Talvivaara<br />
area contain high Zn, Cu and Ni concentrations<br />
but low Pb concentration compared with the values<br />
from western Finland reported by Virtanen<br />
(2005). This is because at Talvivaara the black<br />
schist has high Ni, Cu, and Zn concentrations but<br />
does not contain more Pb in average than the ad-<br />
6 DISCUSSION<br />
Higher acidity <strong>of</strong> peat layers and increasing metal<br />
contents enhances the conductivity <strong>of</strong> peat. Highly<br />
conductive run<strong>of</strong>f and groundwaters in poorly<br />
conducting peat is an optimal research target for<br />
conductivity probing (Puranen et al. 1996, Mäkilä<br />
& Toivonen 1998).<br />
A high sulphur concentration lowers the pH<br />
and increases the conductivity in Carex peat. In<br />
the acidic surface layers at the study sites the hydrogen<br />
ions signi<strong>fi</strong>cantly increase or even dominate<br />
the electric conductivity <strong>of</strong> peat. For pH<br />
values lower than 3.5 the conductivity effect due<br />
to hydrogen ions is at least 10 mS/m (e.g. Kivinen<br />
1935). At the black schist study sites M2 and M3,<br />
the effect <strong>of</strong> bedrock composition on the metal<br />
(Fe, Ni, Zn) and sulphur concentration <strong>of</strong> the<br />
peat as well as the conductivity can be seen in<br />
the basalmost peat layers (Figs. 13, 15 and 18).<br />
At the mica schist study site M1 the metal concentrations<br />
were lower and the change in acidity<br />
from the about 3.1. in the surface layer to 4.4 in<br />
the bottom layer is the principal cause <strong>of</strong> the observed<br />
reduction in conductivity from 13 mS/m to<br />
3 mS/m.<br />
jacent granitic rocks. According to Virtanen et al.<br />
(1997), the basal peat layer overlying the Pampalo<br />
gold-arsenic ore deposit at Ilomantsi, in easternmost<br />
Finland, contains 100 times more arsenic<br />
than than the average background value for peat<br />
in the area. Such high values arise from upwards<br />
migration <strong>of</strong> metals in groundwater or gaseous
<strong>Geologian</strong> <strong>tutkimuskeskus</strong>, Tutkimusraportti <strong>196</strong> – Geological Survey <strong>of</strong> Finland, <strong>Report</strong> <strong>of</strong> <strong>Investigation</strong> <strong>196</strong>, 2012<br />
High pre-mining metal concentrations and conductivity in peat around the Talvivaara nickel deposit, eastern Finland<br />
phases from the underlying till. Transport <strong>of</strong> metals<br />
in groundwater is influenced by a number <strong>of</strong><br />
factors including capillary flow. At the peatland<br />
surface, Sphagnum moss absorbs water and nutrients,<br />
the latter being retained in the moss while the<br />
water evaporates to the air (Salmi 1955), causing<br />
slow but continuous upwards migration <strong>of</strong> water<br />
from soil to the upper layers <strong>of</strong> the peat. It has<br />
also been shown that metal species can be transported<br />
upwards through bedrock and soils within<br />
gas bubbles (Kristiansson & Malmqvist 1982).<br />
Uranium and lead concentrations in peat at<br />
study sites M1-M3 resemble each other in showing<br />
higher concentrations <strong>of</strong> Pb and lower concentrations<br />
<strong>of</strong> U in surface layers compared with<br />
the bottom layers. Uranium concentrations were<br />
also lower in surface sediments than deeper in the<br />
pr<strong>of</strong>ile in organic lake sediments from Lake Kolmisoppi<br />
at Talvivaara, while lead concentrations<br />
were higher in surface sediments than deeper in<br />
the pr<strong>of</strong>ile (Loukola-Ruskeeniemi et al. 1998).<br />
The same tendency in peat pr<strong>of</strong>iles is probably<br />
due to the inherent differences between Pb and U<br />
with respect to redox behaviour and microbiological<br />
processes.<br />
At the mica schist study site M1, the concentrations<br />
<strong>of</strong> analysed metals and sulphur were lower<br />
than at the black schist study site M3, with the exception<br />
<strong>of</strong> uranium and lead which were present<br />
at roughly similar concentrations. At the mica<br />
schist study site, the influence <strong>of</strong> the bedrock on<br />
the metal concentrations and conductivity <strong>of</strong> the<br />
peat was low, while at the black schist study sites<br />
the effect <strong>of</strong> bedrock composition on peat conductivity<br />
was reflected in elevated concentrations<br />
<strong>of</strong> sulphur. A high sulphur concentration lowers<br />
the pH and increases the conductivity in Carex<br />
peat. It is notable that the most signi<strong>fi</strong>cant positive<br />
correlations between metals were recorded<br />
at study site M2 and the least signi<strong>fi</strong>cant at study<br />
site M3. At study site M2 there was a highly signi<strong>fi</strong>cant<br />
positive correlation between all metals<br />
except for lead and manganese. At study site M3,<br />
manganese displayed a highly positive correlation<br />
with iron and sulphur. Copper and uranium were<br />
also strongly correlated.<br />
Of the three study sites, the greatest metal and<br />
ash concentrations were recorded at the black<br />
schist study site M2, which is situated on the sloping<br />
peatland, with Ni-rich black schists outcropping<br />
on the nearby hillside. The average concentrations<br />
<strong>of</strong> copper, nickel, zinc and sulphur in the<br />
peat were many times higher than average values<br />
reported by Virtanen (2005) from Ostrobothnia,<br />
western Finland. It seems likely that the outcrops<br />
<strong>of</strong> black schist were a source <strong>of</strong> acid rock drain-<br />
age during peat formation. A ten-fold ash content<br />
compared to average values in Finnish peatlands<br />
provides distinct evidence <strong>of</strong> acid run<strong>of</strong>f. The distance<br />
from the black schist outcrops to study site<br />
M2 is about 100 m and at the onset <strong>of</strong> paludi<strong>fi</strong>cation<br />
there was a difference in elevation <strong>of</strong><br />
more than ten metres. The acidity <strong>of</strong> peat did not<br />
change until the <strong>196</strong>0s when the peat became drier<br />
due to drainage <strong>of</strong> the the peatland, such that sulphur<br />
(S-ion) became oxidized to SO 4 . The buffering<br />
capacity <strong>of</strong> peat was low because <strong>of</strong> the high<br />
H 2 SO 4 concentration.<br />
In addition, peat is always affected by the<br />
movement <strong>of</strong> ground water, as the waters carry<br />
soluble metal ions in the direction <strong>of</strong> flow. During<br />
and after transport, the metal concentrations in<br />
peat pore water may continue to change through<br />
a variety <strong>of</strong> chemical reactions. Metal ions have<br />
remained in the peat because <strong>of</strong> changes in pH<br />
or oxidation-reduction state or because they have<br />
become bound in complexes with peat organic<br />
compounds, such as humic and fulvic acids (Kapata-Pendias<br />
1994). Statistically signi<strong>fi</strong>cant correlations<br />
between Fe, S, Ni, Co, Zn and U were<br />
observed for peat at study site M2. The pH values<br />
were lower than the tolerance threshold for peatforming<br />
plants. Carex peat forms under conditions<br />
where the pH <strong>of</strong> the peat layers is typically<br />
between 4 and 5. Accordingly, the pH <strong>of</strong> peat at<br />
study site M2 must also have been <strong>of</strong> the same<br />
order <strong>of</strong> magnitude, as Carex peat had formed in<br />
the area. Beneath the surface layer <strong>of</strong> the peat deposits,<br />
pH values varied between 2.8–3.8.<br />
Peat acidity at site M2 changed during and after<br />
pre-mining peatland drainage activity in the<br />
<strong>196</strong>0s. Excavations extended in the margins <strong>of</strong><br />
mire down to the bedrock or at least to the basalmost<br />
layers <strong>of</strong> glacial till. A variety <strong>of</strong> chemical<br />
and microbiological reactions affect the metal<br />
concentrations in the pore waters in peat. Since<br />
both the bedrock and till at Talvivaara contain<br />
abundant sulphides, the surface waters flowing<br />
in peatland drainage channels reacted with<br />
sulphide-rich material resulting in acid run<strong>of</strong>f in<br />
the nearby streams. A dense network <strong>of</strong> drainage<br />
channels also promotes vegetation growth and<br />
root systems, which in turn enhances the movement<br />
<strong>of</strong> water in peatlands because the permeability<br />
<strong>of</strong> peat is dependent primarily on the structure<br />
<strong>of</strong> the peat and the presence <strong>of</strong> tree roots and<br />
debris. Drainage directly improves water run<strong>of</strong>f<br />
and movement possibilities. In general, permeability<br />
is greater in woody peat than in Carex or<br />
Sphagnum peat, when compared at the same degree<br />
<strong>of</strong> humi<strong>fi</strong>cation (Päivänen 1982).<br />
33
<strong>Geologian</strong> <strong>tutkimuskeskus</strong>, Tutkimusraportti <strong>196</strong> – Geological Survey <strong>of</strong> Finland, <strong>Report</strong> <strong>of</strong> <strong>Investigation</strong> <strong>196</strong>, 2012<br />
Markku Mäkilä, Kirsti Loukola-Ruskeeniemi and Heikki Säävuori<br />
Element concentrations in peat layers result from<br />
complex interactions between a number <strong>of</strong> processes.<br />
Elements and more complex compounds<br />
are transported from the underlying mineral substrate<br />
into peat via plant roots in the form <strong>of</strong> soluble<br />
ions. The concentrations <strong>of</strong> soluble ions in peat<br />
are controlled by several factors, including acidity,<br />
oxidation conditions, ion exchange capacity,<br />
and the number <strong>of</strong> complex compounds. In areas<br />
such as Talvivaara, characterized by high natural<br />
sulphur and metal concentrations in bedrock soil,<br />
capillary water, surface water and ground water<br />
all contain above average abundances <strong>of</strong> sulphur<br />
and metals. Since peat accumulation in the Talvivaara<br />
area commenced about 10 000 years ago,<br />
there has been a considerable amount <strong>of</strong> time for<br />
metals to precipitate from groundwaters within<br />
peat. The analysed metals displayed greater concentrations<br />
in the basalmost peat deposits <strong>of</strong><br />
Carex peat than in the surface layers <strong>of</strong> Sphagnum-dominated<br />
peat. Iron-sulphur compounds<br />
in peat evidently cause a lowering <strong>of</strong> pH at high<br />
concentrations and thereby lead to an increase in<br />
conductivity. The effect on pH levels becomes apparent<br />
when the concentrations <strong>of</strong> both iron and<br />
sulphur are approximately 20 000 mg/kg or 2 000<br />
g/peatland-m 3 .<br />
At the black schist study sites M2 and M3, the<br />
elements showing the greatest increase in concentration<br />
with depth were nickel, iron, sulphur and<br />
zinc. At the mica schist study site M1, the concentrations<br />
<strong>of</strong> copper, nickel and sulphur increased<br />
as a function <strong>of</strong> depth. Variations in concentrations<br />
were caused by fluctuations in ground water<br />
level as well as changes in the movement and accumulation<br />
<strong>of</strong> the elements. The concentrations<br />
<strong>of</strong> zinc, manganese and lead were greatest at the<br />
peatland surface, immediately below the surface<br />
layer <strong>of</strong> peat.<br />
Of the three Talvivaara study sites, the highest<br />
metal and ash concentrations were recorded at the<br />
black schist study site M2. Instead <strong>of</strong> attributing<br />
We thank Ale Grundström for assistance during<br />
<strong>fi</strong>eldwork and for many inspiring discussions<br />
and valuable comments on the manuscript, and<br />
numerous colleagues at the Geological Survey <strong>of</strong><br />
34<br />
7 CONCLUSIONS<br />
ACKNOwLEDGEMENTS<br />
this to the influence <strong>of</strong> Ni-rich ground waters, it<br />
seems more likely that there has been acid rock<br />
drainage from Ni-rich black schists on the adjacent<br />
hillside throughout the entire history <strong>of</strong> peat<br />
formation. In addition, peatland drainage activities<br />
in the <strong>196</strong>0s resulted in acid run<strong>of</strong>f wherever<br />
excavation penetrated to the underlying Ni-rich<br />
bedrock or Ni-rich glacial till. At this study site<br />
metals were precipitated in the peat deposits.<br />
Therefore, we can see a natural analogue for the<br />
method <strong>of</strong> remediation <strong>of</strong> mining environments<br />
with peat at Talvivaara.<br />
Under anaerobic conditions, such as those<br />
prevailing in peat, sulphur mainly occurs as sulphides.<br />
Sulphides are oxidized to soluble and<br />
mobile sulphates when conditions change from<br />
anaerobic to aerobic. Peatland drainage leads to<br />
aerobic conditions and consequently oxidation <strong>of</strong><br />
sulphides to sulphates. Leaching <strong>of</strong> sulphur from<br />
peat may in turn cause environmental problems<br />
such as acid run<strong>of</strong>f. The high sulphur content in<br />
peatlands in black schist areas and the consequent<br />
low pH values lead to high electrical conductivity<br />
levels, especially in the sedge-dominated bottom<br />
layer.<br />
Except for the topmost Sphagnum-dominated<br />
layer, the sulphur concentrations in the layer underlying<br />
the sur<strong>fi</strong>cial peat at each <strong>of</strong> the study sites<br />
exceeded the upper limit <strong>of</strong> 0.50% <strong>of</strong> dry mass,<br />
which is the highest value class for energy peat<br />
in northern Europe (Nordtest Innovation Center<br />
2006). The sulphur content <strong>of</strong> peat has a signi<strong>fi</strong>cant<br />
impact on the suitability <strong>of</strong> peatland for<br />
commercial peat production. This is mainly due<br />
to the corrosive effects on power plant equipment,<br />
but the evaluation and minimization <strong>of</strong> sulphur<br />
emissions resulting from peat incineration is also<br />
important (Virtanen 2005, Herranen 2010). When<br />
planning peat production near sulphide-rich bedrock<br />
and/or soil, the quality <strong>of</strong> peat should be<br />
studied and sulphur-rich peat should be excluded<br />
from production.<br />
Finland for their co-operation. We are particularly<br />
grateful to Kimmo Virtanen for his comments<br />
and Peter Sorjonen-Ward for checking the English<br />
<strong>of</strong> the manuscript.
<strong>Geologian</strong> <strong>tutkimuskeskus</strong>, Tutkimusraportti <strong>196</strong> – Geological Survey <strong>of</strong> Finland, <strong>Report</strong> <strong>of</strong> <strong>Investigation</strong> <strong>196</strong>, 2012<br />
High pre-mining metal concentrations and conductivity in peat around the Talvivaara nickel deposit, eastern Finland<br />
Ervamaa, P. & Heino, T. 1980. A progress report on ore<br />
prospecting in the Kainuu−Nort Savo black schist − serpentinite<br />
formations in 1977−1979. Geological Survey<br />
<strong>of</strong> Finland, archive report M19/3344/-80/1/10. 73 p. (in<br />
Finnish)<br />
Govett, G. J. 1976. Detection <strong>of</strong> deeply buried and blind sulphide<br />
deposits by measurement <strong>of</strong> H+ and conductivity<br />
<strong>of</strong> closely spaced surface soil samples. Journal <strong>of</strong> Geochemical<br />
Exploration 6, 359−382.<br />
Gustavsson, N., Loukola-Ruskeeniemi, K. & Tenhola, M.<br />
2011.Evaluation <strong>of</strong> geochemical background levels<br />
around sul<strong>fi</strong>de mines – A new statistical procedure with<br />
beanplots. Applied Geochemistry 27, 240−249.<br />
Häikiö, J., Luukkanen, A. & Porkka, H. 1997. Sotkamossa<br />
tutkitut suot, niiden trurvevarat ja turpeiden käyttökelpoisuus.<br />
Osa II. Abstract: the peatlands and peat reserves<br />
and their potential use in Sotkamo, Part II. Geological<br />
Survey <strong>of</strong> Finland, <strong>Report</strong> <strong>of</strong> Peat <strong>Investigation</strong> 310. 48<br />
p. + 2 app.<br />
Hem, J. D. 1985. Study and interpretation <strong>of</strong> the chemical<br />
characteristics <strong>of</strong> natural water. U.S. Geological Survey,<br />
Water Supply-Paper 2254. 264 p.<br />
Herranen, T. 2010. Turpeen rikkipitoisuus Suomen soissa<br />
− tuloksia laajasta turveinventoinnista. (Summary: Sulphur<br />
concentration <strong>of</strong> peat in Finland − results <strong>of</strong> wide<br />
scale peat inventories). Suo − Mires and Peat, 49–56.<br />
Jones, J. M. & Hao, J. 1993. Ombrotrophic peat as a medium<br />
for historical monitoring <strong>of</strong> heavy metal pollution. Environmental<br />
Geochemistry and Health 15(2–3), 67–74.<br />
Kabata-Pendias, A. 2004. Soil-plant transfer <strong>of</strong> trace elements-an<br />
environmental issue. Geoderma, Vol. 122<br />
(2−4), 143−149.<br />
Kivinen, E. 1935. Über Elektrolytgehalt und Reaktion der<br />
Moorwässer. Agrogeol. Julk., n:o 38, 1−71.<br />
Kokkola, M. & Penttilä, V.-J. 1976. Aittojärvi: molybdenum<br />
in humus, drift and bedrock. Journal <strong>of</strong> Geochemical Exploration<br />
5 (3), 198−208.<br />
Kontinen, A. 2012. Talvivaara Ni-Zn-Cu. In: Eilu, P. (ed.)<br />
Mineral deposits and metallogeny <strong>of</strong> Fennoscandia. Geological<br />
Survey <strong>of</strong> Finland, Special Paper 53, 276−280.<br />
Kristiansson, K. & Malmqvist, L. 1982. Evidence for nondiffuse<br />
transport <strong>of</strong> 222 Rn in the ground and new physical<br />
model for the transport. Geophysics, Vol. 45 (10),<br />
1444−1452.<br />
Lappalainen, E., Sten, C.-G. & Häikiö, J. 1984. Field guide<br />
for peat research. Geological Survey <strong>of</strong> Finland, Guide<br />
12. 62 p. (in Finnish)<br />
Lerssi, J. & Virtanen, K. 2006. Influence <strong>of</strong> black shist to<br />
metal and sulphur content <strong>of</strong> peat. The 12th European<br />
Meeting <strong>of</strong> Environmental and Engineering Geophysics<br />
Finland, Espoo 2006. 4 p.<br />
Loukola-Ruskeeniemi, K. 1999. Origin <strong>of</strong> Black Schists and<br />
the Serpentinite−Associated Cu-Zn-Co Ores at Outokumpu,<br />
Finland. Economic Geology 94, 1007−1028.<br />
Loukola-Ruskeeniemi K. & Heino T. 1996. Geochemistry and<br />
genesis <strong>of</strong> the black schist-hosted Ni-Cu-Zn Deposit at<br />
Talvivaara, Finland. Economic Geology, 91, 80−110.<br />
Loukola-Ruskeeniemi, K., Uutela, A., Tenhola, M. & Paukola,<br />
T. 1998. Environmental impact <strong>of</strong> metalliferous black<br />
schists at Talvivaara in Finland, with indication <strong>of</strong> lake<br />
acidi<strong>fi</strong>cation 9000 years ago. Journal <strong>of</strong> Geochemical Exploration<br />
64, 395−407.<br />
Mäkilä, M. 1994. Suon energiasisällön laskeminen turpeen<br />
ominaisuuksien avulla. Summary: Calculation <strong>of</strong> the en-<br />
REFERENCES<br />
ergy content <strong>of</strong> peatlands on the basis <strong>of</strong> peat properties.<br />
Geological Survey <strong>of</strong> Finland, <strong>Report</strong> <strong>of</strong> <strong>Investigation</strong><br />
121. 73 p. + 11 app.<br />
Mäkilä, M. & Toivonen, T. 1998. Turvetutkimusten ja johtavuusluotausten<br />
käyttömahdollisuudet suoalueen ympäristötutkimuksussa:<br />
esimerkkinä Lapuan Löyhinkinevan<br />
jätevesialue. Summary: Utilization <strong>of</strong> peat investigations<br />
and conductivity probing in environmental research <strong>of</strong><br />
peatlands, with the waste water area <strong>of</strong> Löyhinkineva<br />
peatland in Lapua municipality as an example. Geological<br />
Survey <strong>of</strong> Finland, <strong>Report</strong> <strong>of</strong> Peat <strong>Investigation</strong> 313,<br />
1−25.<br />
Monna, F., Galopc, D., Carozzad, L., Tuala, M., Beyrie, A.,<br />
Marembertf, F., Chateau C., Dominikh, J. & Grousset, F.<br />
E. 2004. Environmental impact <strong>of</strong> early Basque mining<br />
and smelting recorded in a high ash minerogenic peat<br />
deposit Science <strong>of</strong> the Total Environment 327, 197–214.<br />
Murtoniemi, S. 1984. Mustaliuskeiden Cu-Ni-Zn – mineralisaatioiden<br />
kuvastuminen eri tyyppisissä purosedimenteissä<br />
sekä humus- ja kaarnanäytteissä Sotkamon Talvivaaran<br />
alueella MSc thesis, Oulu University, Oulu. 64 p.<br />
(in Finnish)<br />
Nordic Innovation Centre 2006. Quality Guidelines for fuel<br />
Peat. Fuel classi<strong>fi</strong>cation and quality assurance, sampling<br />
and analysis <strong>of</strong> properties. Nordtest, NT ENVIR 009.<br />
Method.<br />
Nordstrom, K. 2011. Hydrogeochemical processes governing<br />
the origin, transport and fate <strong>of</strong> major and trace elements<br />
from mine wastes and mineralized rock to surface waters<br />
Applied Geochemistry 26, 1777−1791.<br />
Päivänen, J. 1982. Turvemaan fysikaaliset ominaisuudet.<br />
Abstract: Physical properties <strong>of</strong> peat soil. Publications<br />
from the department <strong>of</strong> peatland forestry. University <strong>of</strong><br />
Helsinki. 69 p.<br />
von Post, L. 1922. Sveriges Geologiska Undersöknings<br />
torvinventering och några av dess hittils vunna resultat.<br />
Svenska Mosskulturföreningens tidsskrift 1, 1−27. (in<br />
Swedish)<br />
Puranen, R., Mäkilä, M., Sulkanen, K. & Grundström, A.<br />
1997. A new apparatus for electric conductivity and<br />
temperature logging <strong>of</strong> s<strong>of</strong>t sediments. In: Autio, S.<br />
(ed.) Geological Survey <strong>of</strong> Finland, Current Research<br />
1995−1996. Geological Survey <strong>of</strong> Finland, Special Paper<br />
23, 149−155.<br />
Puranen, R., Mäkilä, M. & Säävuori, H. 1999. Electric conductivity<br />
and temperature variations within a raised bog<br />
in Finland: implications for bog development. The Holocene,<br />
9, 13−24.<br />
Putkinen, S. 2002. Turpeen geokemiaa neljällä suolla Pohjois-Kiuruveden<br />
mustaliuskealueilla. Pro gradu tutkielma,<br />
Oulun yliopisto, geotieteiden laitos. 115 p. (in Finnish)<br />
Räisänen, M.-L. & Nikkarinen, M. 2000. Happamoitumisen<br />
seurausvaikutukset peltojen ravinnetilaan ja vesien<br />
laatuun mustaliuskekallioperäalueilla. Vesitalous 41 (6),<br />
9−15. (in Finnish)<br />
Rausch, N., Nieminen, T., Ukonmaanaho, L., Le Roux, G.,<br />
Krachler, M., Cheburkin, K., Bonani, G. & Shotyk, w.<br />
2005. Comparison <strong>of</strong> atmospheric deposition <strong>of</strong> copper,<br />
nickel, cobalt, zinc and cadmium recorded by Finnish<br />
peat cores with monitoring data and emission records.<br />
Environmental Science and Technology 39(16), 5989–<br />
5998.<br />
Rose, A. w., Hawkes, H. E. & webb, J. S. 1979. Geochemis-<br />
35
<strong>Geologian</strong> <strong>tutkimuskeskus</strong>, Tutkimusraportti <strong>196</strong> – Geological Survey <strong>of</strong> Finland, <strong>Report</strong> <strong>of</strong> <strong>Investigation</strong> <strong>196</strong>, 2012<br />
Markku Mäkilä, Kirsti Loukola-Ruskeeniemi and Heikki Säävuori<br />
try in mineral exploration. Academic Press. 657 p.<br />
Salmi, M. 1955. Prospecting for Bog covered ore by means<br />
<strong>of</strong> peat investigations. Bull. Comm. Geol. Finlande 169.<br />
34 p.<br />
Salmi, M. <strong>196</strong>7. Peat in prospecting: Applications in Finland.<br />
In: Kvalheim, A. (ed.) Geochemical prospecting in Fennoscandia.<br />
London: Interscience Publishers, 113−126.<br />
Shotyk, W. 1988. Review <strong>of</strong> the Inorganic Geochemistry <strong>of</strong><br />
Peats and Peatland Waters. Earth-Science Reviews 25,<br />
95−76.<br />
Talvivaara Mining Company 2010. Talvivaara Mining Company<br />
Plc home page. Available at: http://www.talvivaara.<br />
com/operations/Talvivaara_operations/Geology.<br />
Turveteollisuusliitto, Metsäteollisuus ry & Energiateollisuus<br />
2006. Peat energy quality guide 2006. 24 p.<br />
Ukonmaanaho, L., Nieminen, T.M., Rausch, N., Cheburkin,<br />
A., Le Roux, G. & Shotyk, W. 2006. Recent organic matter<br />
accumulation in relation to some climatic factors<br />
in ombrotrophic peat bogs near heavy metal emission<br />
sources in Finland. Global and Planetary Change 53,<br />
259−268.<br />
Verplanck, P. L., Nordstrom, D. K., Bove, D. J., Plumlee, G.<br />
S. & Runkel, R. L. 2009. Naturally acidic surface and<br />
ground waters draining porphyry-related mineralized<br />
areas <strong>of</strong> the Southern Rocky Mountains. Colorado and<br />
New Mexico Applied Geochemistry 24, 255–267.<br />
Virtanen, K. 1978. Mineralisaation kuvastuminen turpeessa<br />
kolmella Keski-Pohjanmaan suolla. Pro gradu-tutkielma,<br />
Turun yliopisto, Maaperägeologian osasto. 152 p. (in<br />
Finnish)<br />
Virtanen, K. 1990. The Influence <strong>of</strong> Bedrock Belts on the<br />
Trace Elements <strong>of</strong> Peatlands in Haapavesi, Central Finland.<br />
Peat 90. Int. Conf. On Peat Production and Use<br />
11−15.6 1990 Jyväskylä, Finland, 462−474.<br />
Virtanen, K. 1993. The impact <strong>of</strong> the weathering products<br />
<strong>of</strong> calcareous schist on the vegetation and peat chemistry<br />
<strong>of</strong> the peatlands at Kuivaniemi Northern Finland.<br />
In: Autio, S. (ed.) Geological Survey <strong>of</strong> Finland, Cur-<br />
36<br />
rent Research 1991−1992. Geological Survey <strong>of</strong> Finland,<br />
Special Paper 18. 186 p.<br />
Virtanen, K. 1995. Turpeen geokemialliset tutkimukset<br />
Ylivieskan Sydännevalla (2431 07). Geological Survey <strong>of</strong><br />
Finland, archive report P 45.002. 12 p. + 5 app.<br />
Virtanen, K. 2004. Arseeni Pohjois-Pohjanmaan soiden turvekerrostumissa.<br />
Arseeni Suomen luonnossa (in Finnish).<br />
In: Loukola-Ruskeeniemi, K. & Lahermo, P. (eds.)<br />
Ympäristövaikutukset ja riskit. Geological Survey <strong>of</strong><br />
Finland, 51−58.<br />
Virtanen, K. 2005. Geochemistry <strong>of</strong> peat (Turpeen geokemiasta)<br />
Seitsemännet geokemian päivät 24−25.2.2005. In:<br />
Salminen, R. (ed.) Tiivistelmät. Vuorimiesyhdistys sarja<br />
B No 83, 2005, 35−41. (in Finnish)<br />
Virtanen, K., Kokkola, M. & Sandberg, E. 1997. Turpeen<br />
geokemialliset tutkimukset Ilomantsin Pampalossa. Neljännet<br />
geokemian päivät 12.−13.11.1997. In: Lestinen, P.<br />
(ed.) Laajat tiivistelmät. Vuorimiesyhdistys sarja B no 64,<br />
103−109. (in Finnish)<br />
Virtanen, K., Hänninen, P., Kallinen, R-L., Vartiainen, S.,<br />
Herranen, T. & Jokisaari, R. 2003. Suomen turvevarat<br />
2000. Summary: The peat reserves <strong>of</strong> Finland in 2000.<br />
Geological Survey <strong>of</strong> Finland, <strong>Report</strong> <strong>of</strong> <strong>Investigation</strong><br />
156. 101 p. + 7 app.<br />
Virtanen, K. & Lerssi, J. 2006. Influence <strong>of</strong> black schists on<br />
element concentration <strong>of</strong> peat. Geological Survey <strong>of</strong> Finland,<br />
archive report S 42/0000/2006/1. 33 p. + 29 app. (in<br />
Finnish, abstract in English)<br />
Virtanen, K. & Lerssi, J. 2008. The influence <strong>of</strong> metal bearing<br />
black schist bedrock to metal and sulphur concentrations<br />
<strong>of</strong> peat deposits. In: Farrell, C. & Feehan, J. (eds.) After<br />
Wise Use − The Future <strong>of</strong> Peatlands: Proceedings <strong>of</strong><br />
the 13th International Peat Congress − Volume 2. Poster<br />
Presentations. Int. Peat. Soc, 55–59.<br />
West, S., Charman D. J., Grattan J. P. & Cherburkin, A. K.<br />
1997. Heavy metals on Holocene peats from South-West<br />
England: detecting mining impacts and atmospheric pollution.<br />
Water Air Soil Poll 100, 343–353.
www.gtk.<strong>fi</strong><br />
info@gtk.<strong>fi</strong><br />
Three peat study sites representing different bedrock types<br />
and hydrological conditions were sampled in the Talvivaara<br />
area in 2005, before the large-scale mining activities began in<br />
2008. The concentrations <strong>of</strong> Co, Cu, Fe, Mn, Ni, U, Zn and S<br />
and conductivity were lower in peat at a study site on mica<br />
schist bedrock than at two study sites underlain by black<br />
schists hosting the Talvivaara Ni-Cu-Zn-Co deposit. Black<br />
schist refers to a graphite and sulphide rich metasedimentary<br />
rock. It seems likely that hydrological conditions at one sloping<br />
peatland site underlain by black schist have been conducive<br />
to acid rock drainage, production and transport <strong>of</strong> acidic<br />
surface waters with Ni-Cu-Zn-Co- rich suspension from<br />
adjacent black schist outcrops and glacial till throughout the<br />
entire history <strong>of</strong> peat accumulation. The peat layer evidently<br />
functioned in the same way as peat <strong>fi</strong>lters in the remediation<br />
<strong>of</strong> acid mine drainage in present-day mine environments, i.e.<br />
metals were retained in the peat. The acidity <strong>of</strong> peat changed<br />
beneath the surface peat layer in the <strong>196</strong>0s when the peat<br />
became drier due to drainage <strong>of</strong> the peatland, and sulphur<br />
oxidized to SO 4 . We conclude that in sulphide-rich terrain,<br />
sulphur concentrations in peat can be high, and leaching <strong>of</strong><br />
sulphur from peat to surface waters during and after peatland<br />
drainage activities may lead to environmental problems.<br />
ISBN 978-952-217-194-8 (PDF)<br />
ISBN 978-952-217-195-5 (paperback)<br />
ISSN 0781-4240