Annual Global Climate and Catastrophe Report: Impact ... - Aon
Annual Global Climate and Catastrophe Report: Impact ... - Aon
Annual Global Climate and Catastrophe Report: Impact ... - Aon

You also want an ePaper? Increase the reach of your titles
YUMPU automatically turns print PDFs into web optimized ePapers that Google loves.
AnnuAl GlobAl Cli mAte And C AtAstroph e r e port<br />
Executive Summary — 2009’s Top <strong>Catastrophe</strong>s<br />
With our annual report, <strong>Impact</strong> Forecasting <strong>and</strong> <strong>Aon</strong> Benfield are helping to redefine the way in which our<br />
clients interpret <strong>and</strong> view natural catastrophe events <strong>and</strong> the potential impacts to their business. Insights in this<br />
year’s report include a recap of 2009’s top natural catastrophe events, a monthly tabular look at 2009’s events,<br />
as well as climate reviews <strong>and</strong> forecasts for the first five months of 2010 - including the initial forecasts for the<br />
2010 Atlantic Hurricane Season. By presenting catastrophe, meteorological, climatological <strong>and</strong> insurance data<br />
with a meaningful method, we are redefining the way in which information can be accessed <strong>and</strong> the value in<br />
which it is delivered to our clients.<br />
2009’s global natural catastrophic activity remained near the levels of the last two years. At least 222 separate<br />
events had damaging effects on various parts of the world, resulting in economic losses of US$58 billion<br />
<strong>and</strong> insured losses of US$20 billion. In comparison, 2008 had 213 events that produced damage, while 2007<br />
had 217 events. Both Europe <strong>and</strong> the United States tallied the most insured losses for 2009 primarily due to<br />
damaging winter <strong>and</strong> springtime weather. Asia accounted for most of the economic losses, with flooding <strong>and</strong><br />
typhoons accounting for the majority of their losses. Of the top 10 natural catastrophic events in 2009 from an<br />
insured loss st<strong>and</strong>point, there were six severe weather events (tornadoes, hail, severe thunderstorm winds), one<br />
winter-based storm event (snow, icing, cold temperatures <strong>and</strong> damaging winds), one tropical system event,<br />
one wildfire event <strong>and</strong> one earthquake event.<br />
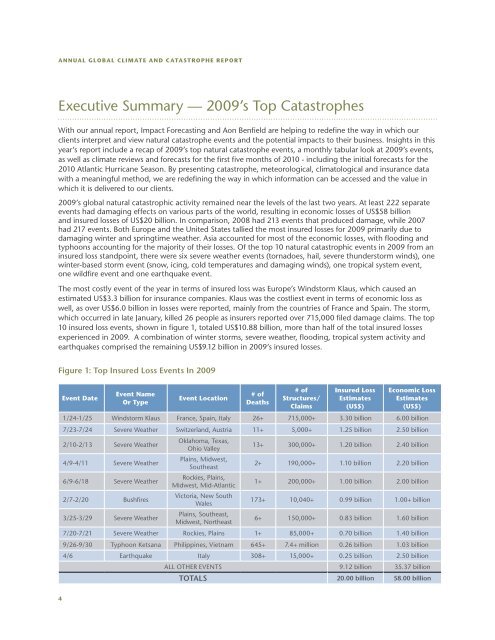
The most costly event of the year in terms of insured loss was Europe’s Windstorm Klaus, which caused an<br />
estimated US$3.3 billion for insurance companies. Klaus was the costliest event in terms of economic loss as<br />
well, as over US$6.0 billion in losses were reported, mainly from the countries of France <strong>and</strong> Spain. The storm,<br />
which occurred in late January, killed 26 people as insurers reported over 715,000 filed damage claims. The top<br />
10 insured loss events, shown in figure 1, totaled US$10.88 billion, more than half of the total insured losses<br />
experienced in 2009. A combination of winter storms, severe weather, flooding, tropical system activity <strong>and</strong><br />
earthquakes comprised the remaining US$9.12 billion in 2009’s insured losses.<br />
Figure 1: Top Insured Loss Events In 2009<br />
4<br />
event date<br />
event name<br />
or type<br />
event location<br />
# of<br />
deaths<br />
# of<br />
structures/<br />
Claims<br />
insured loss<br />
estimates<br />
(us$)<br />
economic loss<br />
estimates<br />
(us$)<br />
1/24-1/25 Windstorm Klaus France, Spain, Italy 26+ 715,000+ 3.30 billion 6.00 billion<br />
7/23-7/24 Severe Weather Switzerl<strong>and</strong>, Austria 11+ 5,000+ 1.25 billion 2.50 billion<br />
2/10-2/13 Severe Weather<br />
Oklahoma, Texas,<br />
Ohio valley<br />
13+ 300,000+ 1.20 billion 2.40 billion<br />
4/9-4/11 Severe Weather<br />
Plains, Midwest,<br />
Southeast<br />
2+ 190,000+ 1.10 billion 2.20 billion<br />
6/9-6/18 Severe Weather<br />
Rockies, Plains,<br />
Midwest, Mid-Atlantic<br />
1+ 200,000+ 1.00 billion 2.00 billion<br />
2/7-2/20 Bushfires<br />
victoria, New South<br />
Wales<br />
173+ 10,040+ 0.99 billion 1.00+ billion<br />
3/25-3/29 Severe Weather<br />
Plains, Southeast,<br />
Midwest, Northeast<br />
6+ 150,000+ 0.83 billion 1.60 billion<br />
7/20-7/21 Severe Weather Rockies, Plains 1+ 85,000+ 0.70 billion 1.40 billion<br />
9/26-9/30 Typhoon Ketsana Philippines, vietnam 645+ 7.4+ million 0.26 billion 1.03 billion<br />
4/6 Earthquake Italy 308+ 15,000+ 0.25 billion 2.50 billion<br />
ALL OTHER EvENTS 9.12 billion 35.37 billion<br />
TOTALS 20.00 billion 58.00 billion