Annual Global Climate and Catastrophe Report: Impact ... - Aon
Annual Global Climate and Catastrophe Report: Impact ... - Aon
Annual Global Climate and Catastrophe Report: Impact ... - Aon

You also want an ePaper? Increase the reach of your titles
YUMPU automatically turns print PDFs into web optimized ePapers that Google loves.
AnnuAl GlobAl Cli mAte And C AtAstroph e r e port<br />
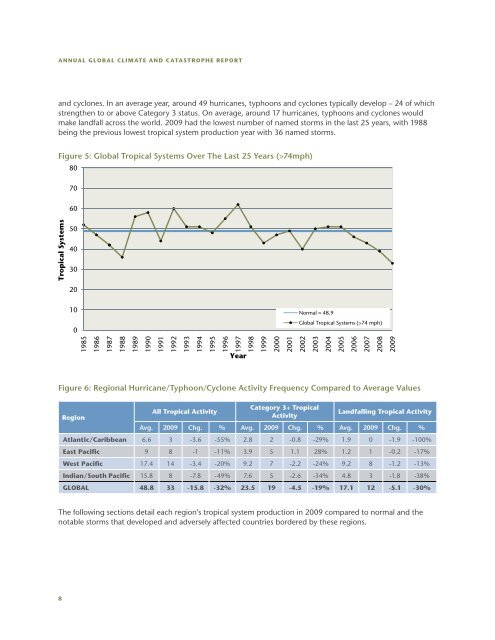
<strong>and</strong> cyclones. In an average year, around 49 hurricanes, typhoons <strong>and</strong> cyclones typically develop – 24 of which<br />
strengthen to or above Category 3 status. On average, around 17 hurricanes, typhoons <strong>and</strong> cyclones would<br />
make l<strong>and</strong>fall across the world. 2009 had the lowest number of named storms in the last 25 years, with 1988<br />
being the previous lowest tropical system production year with 36 named storms.<br />
Figure 5: <strong>Global</strong> Tropical Systems Over The Last 25 Years (>74mph)<br />
80<br />
Tropical Systems<br />
Figure 6: Regional Hurricane/Typhoon/Cyclone Activity Frequency Compared to Average Values<br />
8<br />
70<br />
60<br />
50<br />
40<br />
30<br />
20<br />
10<br />
0<br />
1985<br />
region<br />
1986<br />
1987<br />
1988<br />
1989<br />
1990<br />
1991<br />
1992<br />
1993<br />
1994<br />
1995<br />
All tropical Activity<br />
1996<br />
1997<br />
Year<br />
Category 3+ tropical<br />
Activity<br />
l<strong>and</strong>falling tropical Activity<br />
Avg. 2009 Chg. % Avg. 2009 Chg. % Avg. 2009 Chg. %<br />
Atlantic/Caribbean 6.6 3 -3.6 -55% 2.8 2 -0.8 -29% 1.9 0 -1.9 -100%<br />
east pacific 9 8 -1 -11% 3.9 5 1.1 28% 1.2 1 -0.2 -17%<br />
West pacific 17.4 14 -3.4 -20% 9.2 7 -2.2 -24% 9.2 8 -1.2 -13%<br />
indian/south pacific 15.8 8 -7.8 -49% 7.6 5 -2.6 -34% 4.8 3 -1.8 -38%<br />
GlobAl 48.8 33 -15.8 -32% 23.5 19 -4.5 -19% 17.1 12 -5.1 -30%<br />
The following sections detail each region’s tropical system production in 2009 compared to normal <strong>and</strong> the<br />
notable storms that developed <strong>and</strong> adversely affected countries bordered by these regions.<br />
1998<br />
1999<br />
2000<br />
2001<br />
Normal = 48.9<br />
<strong>Global</strong> Tropical Systems (>74 mph)<br />
2002<br />
2003<br />
2004<br />
2005<br />
2006<br />
2007<br />
2008<br />
2009