Annual Global Climate and Catastrophe Report: Impact ... - Aon
Annual Global Climate and Catastrophe Report: Impact ... - Aon
Annual Global Climate and Catastrophe Report: Impact ... - Aon

You also want an ePaper? Increase the reach of your titles
YUMPU automatically turns print PDFs into web optimized ePapers that Google loves.
AnnuAl GlobAl Cli mAte And C AtAstroph e r e port<br />
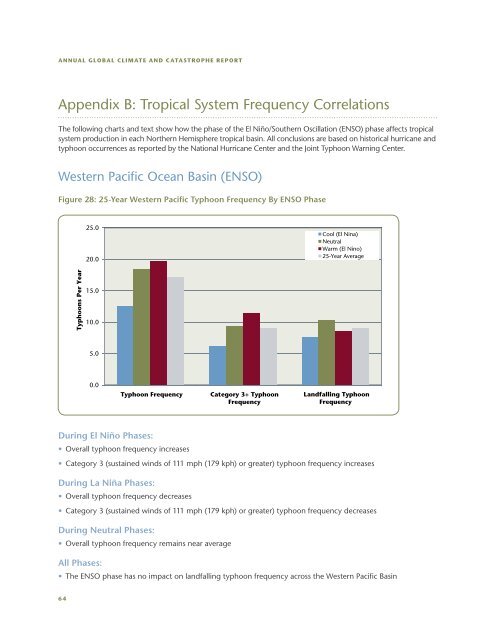
Appendix B: Tropical System Frequency Correlations<br />
The following charts <strong>and</strong> text show how the phase of the El Niño/Southern Oscillation (ENSO) phase affects tropical<br />
system production in each Northern Hemisphere tropical basin. All conclusions are based on historical hurricane <strong>and</strong><br />
typhoon occurrences as reported by the National Hurricane Center <strong>and</strong> the Joint Typhoon Warning Center.<br />
Western Pacific Ocean Basin (ENSO)<br />
Figure 28: 25-Year Western Pacific Typhoon Frequency By ENSO Phase<br />
During El Niño Phases:<br />
• Overall typhoon frequency increases<br />
• Category 3 (sustained winds of 111 mph (179 kph) or greater) typhoon frequency increases<br />
During La Niña Phases:<br />
• Overall typhoon frequency decreases<br />
• Category 3 (sustained winds of 111 mph (179 kph) or greater) typhoon frequency decreases<br />
During Neutral Phases:<br />
• Overall typhoon frequency remains near average<br />
All Phases:<br />
• The ENSO phase has no impact on l<strong>and</strong>falling typhoon frequency across the Western Pacific Basin<br />
6 4<br />
Typhoons Per Year<br />
25.0<br />
20.0<br />
15.0<br />
10.0<br />
5.0<br />
0.0<br />
Typhoon Frequency Category 3+ Typhoon<br />
Frequency<br />
CCool l (L (El Nina) Ni )<br />
Neutral<br />
Warm (El Nino)<br />
25-Year Average<br />
L<strong>and</strong>falling Typhoon<br />
Frequency