Annual Global Climate and Catastrophe Report: Impact ... - Aon
Annual Global Climate and Catastrophe Report: Impact ... - Aon
Annual Global Climate and Catastrophe Report: Impact ... - Aon

Create successful ePaper yourself
Turn your PDF publications into a flip-book with our unique Google optimized e-Paper software.
2009 <strong>Climate</strong> Review<br />
<strong>Aon</strong> b e n field: i m pAC t foreC AstinG<br />
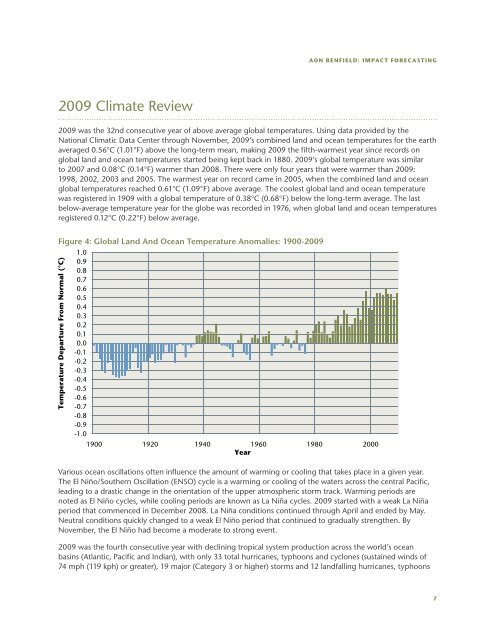
2009 was the 32nd consecutive year of above average global temperatures. Using data provided by the<br />
National Climatic Data Center through November, 2009’s combined l<strong>and</strong> <strong>and</strong> ocean temperatures for the earth<br />
averaged 0.56°C (1.01°F) above the long-term mean, making 2009 the fifth-warmest year since records on<br />
global l<strong>and</strong> <strong>and</strong> ocean temperatures started being kept back in 1880. 2009’s global temperature was similar<br />
to 2007 <strong>and</strong> 0.08°C (0.14°F) warmer than 2008. There were only four years that were warmer than 2009:<br />
1998, 2002, 2003 <strong>and</strong> 2005. The warmest year on record came in 2005, when the combined l<strong>and</strong> <strong>and</strong> ocean<br />
global temperatures reached 0.61°C (1.09°F) above average. The coolest global l<strong>and</strong> <strong>and</strong> ocean temperature<br />
was registered in 1909 with a global temperature of 0.38°C (0.68°F) below the long-term average. The last<br />
below-average temperature year for the globe was recorded in 1976, when global l<strong>and</strong> <strong>and</strong> ocean temperatures<br />
registered 0.12°C (0.22°F) below average.<br />
Figure 4: <strong>Global</strong> L<strong>and</strong> And Ocean Temperature Anomalies: 1900-2009<br />
1.0<br />
0.9<br />
0.8<br />
0.7<br />
0.6<br />
0.5<br />
0.4<br />
0.3<br />
0.2<br />
00.1 1<br />
0.0<br />
-0.1<br />
-0.2<br />
-0.3<br />
-0.4<br />
-0.5<br />
-0.6<br />
-0.7<br />
-0.8<br />
-0.9<br />
-1.0<br />
1900 1920 1940 1960 1980 2000<br />
Year<br />
Temperature Departure From Normal (°C)<br />
various ocean oscillations often influence the amount of warming or cooling that takes place in a given year.<br />
The El Niño/Southern Oscillation (ENSO) cycle is a warming or cooling of the waters across the central Pacific,<br />
leading to a drastic change in the orientation of the upper atmospheric storm track. Warming periods are<br />
noted as El Niño cycles, while cooling periods are known as La Niña cycles. 2009 started with a weak La Niña<br />
period that commenced in December 2008. La Niña conditions continued through April <strong>and</strong> ended by May.<br />
Neutral conditions quickly changed to a weak El Niño period that continued to gradually strengthen. By<br />
November, the El Niño had become a moderate to strong event.<br />
2009 was the fourth consecutive year with declining tropical system production across the world’s ocean<br />
basins (Atlantic, Pacific <strong>and</strong> Indian), with only 33 total hurricanes, typhoons <strong>and</strong> cyclones (sustained winds of<br />
74 mph (119 kph) or greater), 19 major (Category 3 or higher) storms <strong>and</strong> 12 l<strong>and</strong>falling hurricanes, typhoons<br />
7