2010 Comprehensive Statement on Postal Operations - USPS.com
2010 Comprehensive Statement on Postal Operations - USPS.com
2010 Comprehensive Statement on Postal Operations - USPS.com

Create successful ePaper yourself
Turn your PDF publications into a flip-book with our unique Google optimized e-Paper software.
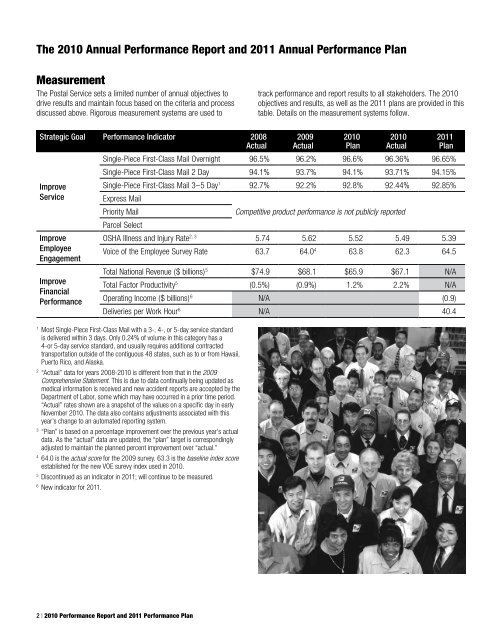
The <str<strong>on</strong>g>2010</str<strong>on</strong>g> Annual Performance Report and 2011 Annual Performance Plan<br />
Measurement<br />
The <strong>Postal</strong> Service sets a limited number of annual objectives to<br />
drive results and maintain focus based <strong>on</strong> the criteria and process<br />
discussed above. Rigorous measurement systems are used to<br />
Strategic Goal Performance Indicator 2008<br />
Actual<br />
Improve<br />
Service<br />
Improve<br />
Employee<br />
Engagement<br />
Improve<br />
Financial<br />
Performance<br />
2 | <str<strong>on</strong>g>2010</str<strong>on</strong>g> Performance Report and 2011 Performance Plan<br />
track performance and report results to all stakeholders. The <str<strong>on</strong>g>2010</str<strong>on</strong>g><br />
objectives and results, as well as the 2011 plans are provided in this<br />
table. Details <strong>on</strong> the measurement systems follow.<br />
2009<br />
Actual<br />
<str<strong>on</strong>g>2010</str<strong>on</strong>g><br />
Plan<br />
<str<strong>on</strong>g>2010</str<strong>on</strong>g><br />
Actual<br />
2011<br />
Plan<br />
Single-Piece First-Class Mail Overnight 96.5% 96.2% 96.6% 96.36% 96.65%<br />
Single-Piece First-Class Mail 2 Day 94.1% 93.7% 94.1% 93.71% 94.15%<br />
Single-Piece First-Class Mail 3–5 Day1 Express Mail<br />
92.7% 92.2% 92.8% 92.44% 92.85%<br />
Priority Mail<br />
Parcel Select<br />
Competitive product performance is not publicly reported<br />
OSHA Illness and Injury Rate2, 3 5.74 5.62 5.52 5.49 5.39<br />
Voice of the Employee Survey Rate 63.7 64.04 63.8 62.3 64.5<br />
Total Nati<strong>on</strong>al Revenue ($ billi<strong>on</strong>s) 5 $74.9 $68.1 $65.9 $67.1 N/A<br />
Total Factor Productivity5 (0.5%) (0.9%) 1.2% 2.2% N/A<br />
Operating In<strong>com</strong>e ($ billi<strong>on</strong>s) 6 N/A (0.9)<br />
Deliveries per Work Hour6 N/A 40.4<br />
1 Most Single-Piece First-Class Mail with a 3-, 4-, or 5-day service standard<br />
is delivered within 3 days. Only 0.24% of volume in this category has a<br />
4-or 5-day service standard, and usually requires additi<strong>on</strong>al c<strong>on</strong>tracted<br />
transportati<strong>on</strong> outside of the c<strong>on</strong>tiguous 48 states, such as to or from Hawaii,<br />
Puerto Rico, and Alaska.<br />
2 “Actual” data for years 2008-<str<strong>on</strong>g>2010</str<strong>on</strong>g> is different from that in the 2009<br />
<str<strong>on</strong>g>Comprehensive</str<strong>on</strong>g> <str<strong>on</strong>g>Statement</str<strong>on</strong>g>. This is due to data c<strong>on</strong>tinually being updated as<br />
medical informati<strong>on</strong> is received and new accident reports are accepted by the<br />
Department of Labor, some which may have occurred in a prior time period.<br />
“Actual” rates shown are a snapshot of the values <strong>on</strong> a specific day in early<br />
November <str<strong>on</strong>g>2010</str<strong>on</strong>g>. The data also c<strong>on</strong>tains adjustments associated with this<br />
year’s change to an automated reporting system.<br />
3 “Plan” is based <strong>on</strong> a percentage improvement over the previous year’s actual<br />
data. As the “actual” data are updated, the “plan” target is corresp<strong>on</strong>dingly<br />
adjusted to maintain the planned percent improvement over “actual.”<br />
4 64.0 is the actual score for the 2009 survey. 63.3 is the baseline index score<br />
established for the new VOE surevy index used in <str<strong>on</strong>g>2010</str<strong>on</strong>g>.<br />
5 Disc<strong>on</strong>tinued as an indicator in 2011; will c<strong>on</strong>tinue to be measured.<br />
6 New indicator for 2011.