INDUSTRIAL LAND IN A POST-INDUSTRIAL CITY District of ...
INDUSTRIAL LAND IN A POST-INDUSTRIAL CITY District of ...
INDUSTRIAL LAND IN A POST-INDUSTRIAL CITY District of ...

You also want an ePaper? Increase the reach of your titles
YUMPU automatically turns print PDFs into web optimized ePapers that Google loves.
<strong><strong>IN</strong>DUSTRIAL</strong> <strong>LAND</strong> <strong>IN</strong> A <strong>POST</strong>-<strong><strong>IN</strong>DUSTRIAL</strong> <strong>CITY</strong><br />
<strong>District</strong> <strong>of</strong> Columbia Industrial Land Use Study:<br />
A Detailed Investigation <strong>of</strong> Industrial Land in the <strong>District</strong> <strong>of</strong> Columbia and role <strong>of</strong><br />
Production, Distribution and Repair Industries in the <strong>District</strong> Economy<br />
Prepared for:<br />
<strong>District</strong> <strong>of</strong> Columbia Office <strong>of</strong> Planning<br />
Consultant Team:<br />
Phillips Preiss Shapiro Associates, Inc.<br />
Mt. Auburn Associates, Inc.<br />
Retail Compass LLC<br />
August 2006
<strong>District</strong> <strong>of</strong> Columbia Industrial Areas Study DC Office <strong>of</strong> Planning<br />
Prepared by Phillips Preiss Shapiro Associates, Inc.<br />
Table <strong>of</strong> Contents<br />
Executive Summary ...................................................................................................... 1<br />
Introduction and Objectives .................................................................................................... 1<br />
Study Methodology................................................................................................................. 2<br />
Summary <strong>of</strong> Major Findings.................................................................................................... 3<br />
Summary <strong>of</strong> Major Recommendations.................................................................................... 7<br />
1 Introduction........................................................................................................... 14<br />
1.1 Purpose and Scope ...................................................................................................14<br />
1.2 Methodology..............................................................................................................16<br />
1.3 Key Concepts ............................................................................................................18<br />
1.4 Structure <strong>of</strong> the Report ..............................................................................................19<br />
2 Rationale for the Study ........................................................................................ 22<br />
2.1 Importance <strong>of</strong> PDR to the <strong>District</strong> Economy...............................................................22<br />
2.2 Need for PDR Jobs....................................................................................................34<br />
2.3 Development Pressures ............................................................................................38<br />
2.4 Need for Appropriate Space for Public Functions ......................................................41<br />
2.5 Need to Accommodate Projected Employment Growth .............................................43<br />
2.6 Limited Supply <strong>of</strong> Industrial Land...............................................................................45<br />
3 Existing Conditions Analysis .............................................................................. 60<br />
3.1 Industrial Land and Public Policy ...............................................................................60<br />
3.2 The Market for Industrial Land and Buildings.............................................................65<br />
3.3 Sub-area Analysis .....................................................................................................74<br />
3.4 Overall Findings.........................................................................................................75<br />
3.5 Summary...................................................................................................................77<br />
4 Recommendations................................................................................................ 78<br />
4.1 A New Zoning Framework for PDR............................................................................80<br />
4.2 Areas Targeted for Industrial Retention .....................................................................87<br />
4.3 Areas Targeted for Retention and Intensification .......................................................93<br />
4.4 Areas Targeted for Strategic Public Sector Use.........................................................97<br />
4.5 Areas Targeted for Change <strong>of</strong> Use ..........................................................................101<br />
4.6 Government Facilities..............................................................................................105<br />
4.7 Recommendations for Future Land Use Decisions ..................................................110<br />
5 References .......................................................................................................... 113<br />
5.1 Interviews and Meetings ..........................................................................................113<br />
5.2 Documents and Reports ..........................................................................................114<br />
6 Appendices ......................................................................................................... 116<br />
6.1 Zoning Maps for Study areas...................................................................................116<br />
6.2 Sub Area Analyses and Illustrative Land Use Maps.................................................116<br />
- ii -
<strong>District</strong> <strong>of</strong> Columbia Industrial Areas Study DC Office <strong>of</strong> Planning<br />
Prepared by Phillips Preiss Shapiro Associates, Inc.<br />
6.3 Opportunities and Constraints Matrix.......................................................................154<br />
6.4 Scoring Matrix and Classification <strong>of</strong> “PDR Fitness”..................................................161<br />
6.5 Industrial Users Survey............................................................................................166<br />
6.6 Regional Industrial Space........................................................................................176<br />
- iii -
<strong>District</strong> <strong>of</strong> Columbia Industrial Areas Study DC Office <strong>of</strong> Planning<br />
Prepared by Phillips Preiss Shapiro Associates, Inc.<br />
Executive Summary<br />
<strong>IN</strong>TRODUCTION AND OBJECTIVES<br />
The economy and real estate market in the <strong>District</strong> <strong>of</strong> Columbia are undergoing rapid change.<br />
Starting in 1997 the <strong>of</strong>fice, residential, and more recently the retail development markets have<br />
been booming. This boom started by filling in the gaps in the downtown block pattern, and has<br />
since expanded outward to include new developments in the Anacostia Waterfront Initiative, the<br />
recently-opened New York Avenue MetroRail Station, and extensions <strong>of</strong> the downtown into the<br />
NOMA area. New residential and retail projects are springing up throughout DC, even in areas<br />
heret<strong>of</strong>ore considered <strong>of</strong>f the map for new development.<br />
In the midst <strong>of</strong> this boom, DC’s industrially-zoned areas—hugging rail corridors, tucked away in<br />
remote locations, and sprawling next to major automotive service corridors—had been largely<br />
forgotten. However, as many <strong>of</strong> the more easily developed and favorably located sites<br />
disappeared, commercial and residential developers have begun to turn their interest to<br />
industrial land, particular those sites which occupy strategic locations and <strong>of</strong>fer relatively<br />
straightforward property assemblages. Requests for the rezoning <strong>of</strong> industrial land to some<br />
other category, typically one permitting residential development, have been increasingly<br />
common.<br />
At the same time, several factors have conspired to increase the space needs <strong>of</strong> government<br />
and public entities. Some <strong>of</strong> this demand is growth related. Some relates to the need to relocate<br />
several key public functions related to DC operations, water and sewer service, and bus<br />
maintenance and storage away from the site <strong>of</strong> the new Washington Nationals stadium. Many <strong>of</strong><br />
these needs are quasi-industrial in nature, and will be hard to site: bus garages, helipads, and<br />
vehicle storage and maintenance yards, have unique site selection criteria for functionality and<br />
at the same time are uses that are less-than-welcome in established or emerging<br />
neighborhoods elsewhere in DC. Since DC government is bound by its own zoning, the need for<br />
industrially-zoned land for government functions goes beyond concerns over NIMBYism.<br />
Much <strong>of</strong> the land in question is already occupied by a diverse array <strong>of</strong> industrial and quasiindustrial<br />
users, grouped in this report under the descriptive title <strong>of</strong> Production, Distribution and<br />
Repair businesses (PDR). PDR businesses in DC are paying higher rents for less suitable<br />
space than many <strong>of</strong> their suburban counterparts, evidencing a need, and willingness to pay<br />
premiums, to be located in DC. Yet the role these industries play in DC economy is poorlyunderstood.<br />
The relatively lower real estate value generated by such users has made it easy to<br />
dismiss their relevance to a national and global capital primarily concerned with the business <strong>of</strong><br />
government and policy-making.<br />
Clearly, there are increasing demands to make policy decisions regarding DC’s inventory <strong>of</strong><br />
industrially-zoned lands, decisions which are currently being made on a site-by-site basis<br />
- 1 -
<strong>District</strong> <strong>of</strong> Columbia Industrial Areas Study DC Office <strong>of</strong> Planning<br />
Prepared by Phillips Preiss Shapiro Associates, Inc.<br />
without the benefit <strong>of</strong> a comprehensive strategy or the basic information needed for<br />
understanding the opportunity costs <strong>of</strong> rezoning industrial land and make knowledgeable policy<br />
choices. This report attempts to clarify the situation by addressing two purposes: (1) to provide<br />
the factual and analytical base for future land use decisions impacting industrial land and PDR<br />
land uses; and (2) to provide a set <strong>of</strong> recommendations for strategically managing DC’s scarce<br />
supply <strong>of</strong> land suitable for accommodating PDR users and certain municipal, utility, and<br />
governmental functions.<br />
STUDY METHODOLOGY<br />
The findings and recommendations contained in this report are founded on a detailed and<br />
comprehensive methodology examining DC’s industrial lands from a land use, economic, and<br />
market perspective. In the effort to analyze DC’s existing industrial land base, the Office <strong>of</strong><br />
Planning delineated “study areas”, which correspond roughly to areas surrounding CM or M<br />
zoning or containing a concentration <strong>of</strong> industrial businesses and/or industrial land. OP further<br />
divided these areas into analytical sub-areas. The accompanying Study Areas Map indicates<br />
each area and its OP-given name.<br />
The sub-areas provide the geographic organization for the land use analysis and for the specific<br />
recommendations. However, the objectives <strong>of</strong> this study required a methodology that went far<br />
beyond a typical land use study, incorporated the following tasks and investigations into a<br />
logical framework for analysis and decision-making.<br />
Field surveys and mapping <strong>of</strong> land use patterns and physical characteristics <strong>of</strong> each<br />
industrial area.<br />
An Opportunities and Constraints Analysis <strong>of</strong> each sub-area based on the field surveys<br />
and mapping.<br />
Scoring Matrix based on the above.<br />
Survey <strong>of</strong> existing industrial tenants.<br />
An analysis <strong>of</strong> the market <strong>of</strong> industrial buildings and sites in DC and the metro region.<br />
An economic analysis <strong>of</strong> the role that PDR business plays in DC economy.<br />
A round <strong>of</strong> meetings and interactions with a Technical Advisory Committee comprised <strong>of</strong><br />
representatives <strong>of</strong> DC agencies, the Federal Government, and public authorities.<br />
A review <strong>of</strong> case studies and best practices.<br />
Development <strong>of</strong> criteria to assist in evaluating requests for zone changes way from<br />
industrial designation.<br />
The work described above, while focused on the issue <strong>of</strong> industrial land, has not occurred in a<br />
vacuum, but has been undertaken concurrently with work on the economic development<br />
element <strong>of</strong> DC’s new Comprehensive Plan. The background studies for the Comprehensive<br />
- 2 -
<strong>District</strong> <strong>of</strong> Columbia Industrial Areas Study DC Office <strong>of</strong> Planning<br />
Prepared by Phillips Preiss Shapiro Associates, Inc.<br />
Plan, summarized as an economic development White Paper, were conducted in tandem with<br />
this industry study, and data and findings from each report have helped inform the other. This<br />
high level <strong>of</strong> coordination insures that the Comprehensive Plan and the Industrial Areas Study<br />
will be fully consistent with each other.<br />
SUMMARY OF MAJOR F<strong>IN</strong>D<strong>IN</strong>GS<br />
Importance <strong>of</strong> Industrial Land<br />
It is important to accommodate industrial land for at least two reasons. First, there is a need for<br />
appropriate space for municipal functions. PPSA estimated, based on the needs identified<br />
through the TAC process, that DC’s immediate public sector space needs equaled almost 70<br />
acres <strong>of</strong> land. This land will be needed to house those quasi-industrial functions such as waste<br />
hauling and transfer, street cleaning and plowing, road construction and repair, water and sewer<br />
construction and repair, and police, fire, and parking enforcement services that are essential to<br />
the business <strong>of</strong> city government.<br />
Second, PDR jobs are critical to a healthy DC economy and must be retained. As compared<br />
with other employment areas for those without college degrees, PDR uses provide higher<br />
quality jobs, with better wages and career paths, to workers without an advanced education.<br />
PPSA conservatively estimated that the private PDR sectors will need approximately 31 acres<br />
<strong>of</strong> developable land to accommodate the amount <strong>of</strong> projected future economic growth.<br />
Thus, in total, this study estimates that in the immediate term alone DC will require 100 acres <strong>of</strong><br />
industrial-type land in which to house its municipal functions and PDR jobs.<br />
Limited Supply <strong>of</strong> Industrial Land<br />
Unfortunately, the study also found that there is a limited supply <strong>of</strong> this type <strong>of</strong> land, and that<br />
much <strong>of</strong> the <strong>District</strong>’s industrial land is either undevelopable, has been rezoned, or is under<br />
significant development pressures.<br />
Including land that is zoned for non-PDR uses, the areas examined by this study total only<br />
2,390 acres, which represents just over five percent <strong>of</strong> DC’s total 43,850 acres <strong>of</strong> land area<br />
(including Federal land inside DC). But the actual amount <strong>of</strong> land on which industrial<br />
development is permitted as <strong>of</strong> right is even smaller: the existing zoning within these areas<br />
serves to reduce by 386 acres the actual supply <strong>of</strong> as-<strong>of</strong>-right industrial land. Within the 2,390<br />
acres <strong>of</strong> our study area, the industrial zones <strong>of</strong> C-M, M, and W Zones comprise a total <strong>of</strong> 2,026<br />
acres, and make up only about five percent <strong>of</strong> total DC land.<br />
The predominance <strong>of</strong> railroad tracks within the largest industrial areas limits the amount <strong>of</strong><br />
buildable land even further. Roads, streets, alleys, other right-<strong>of</strong>-ways reduce lot sizes and<br />
- 3 -
<strong>District</strong> <strong>of</strong> Columbia Industrial Areas Study DC Office <strong>of</strong> Planning<br />
Prepared by Phillips Preiss Shapiro Associates, Inc.<br />
building footprints elsewhere. New York Avenue/Bladensburg, for example, is the second<br />
largest sub-area, totaling 328 acres, but 22 percent <strong>of</strong> it, about 77 acres, is road or<br />
railroad/transportation right-<strong>of</strong>-way.<br />
Moreover, most <strong>of</strong> this limited amount <strong>of</strong> industrial land is already occupied, and therefore<br />
existing PDR businesses have limited room to expand in place and DC has diminished potential<br />
<strong>of</strong> attracting <strong>of</strong> new PDR businesses. By our calculations, only about 27 acres, or 1.2 percent, <strong>of</strong><br />
the land in industrial areas is vacant.<br />
Additionally, most <strong>of</strong> these sub-areas are greatly subdivided—only five sub-areas have average<br />
parcel sizes <strong>of</strong> more than one acre. Fifteen sub-areas have average parcel sizes <strong>of</strong> less than an<br />
acre, and eight <strong>of</strong> those sub-areas have average parcel sizes <strong>of</strong> less than 20,000 square feet,<br />
or, less than one-half <strong>of</strong> an acre.<br />
Finally, a total <strong>of</strong> 447 acres <strong>of</strong> PDR land are under direct pressure or have already been lost—<br />
94 acres <strong>of</strong> PDR land is under pressure from housing and related neighborhood development,<br />
111 acres area to be enveloped by large-scale initiatives such as the Anacostia Waterfront<br />
Initiative (AWI), and the Buzzard Point / Capitol Gateway Overlay <strong>District</strong> initiative resulted in<br />
the rezoning <strong>of</strong> 242 acres <strong>of</strong> PDR land.<br />
Therefore, the <strong>District</strong>’s supply <strong>of</strong> remaining industrial land is very limited and continues to<br />
shrink. While it is impossible to calculate the non-reducible core that must be preserved in<br />
perpetuity, it is clear that the <strong>District</strong> should exercise all caution in future land use decisions, for<br />
the evidence from this study suggests that the city may be approaching that lower bound.<br />
Industrial Land Use Policies<br />
Given the need for industrial land to accommodate existing PDR businesses and future growth,<br />
as well as public needs; and the desirability <strong>of</strong> capturing a greater share <strong>of</strong> PDR employment<br />
(both public and private) within the <strong>District</strong>; it is clear that a public policy response is required.<br />
Developable land <strong>of</strong> any type is scarce in Washington, DC, and industrial land even more so. As<br />
DC’s inventory <strong>of</strong> favorably located development sites is exhausted, the development<br />
community will inevitably hunt for opportunities in areas heret<strong>of</strong>ore considered unsuitable for<br />
residential, commercial, or mixed-use development. Further, industrial uses generate lower land<br />
rents than residential, <strong>of</strong>fice or retail uses, and therefore will always lose out to such uses when<br />
policy does not restrain the marketplace.<br />
The rationale for providing restraints on the ability to rezone land from industrial is related to the<br />
notion <strong>of</strong> scarcity. Considered in isolation, each individual development site could be subject to<br />
its own highest and best use analysis. Taken together, however, they represent a portfolio <strong>of</strong><br />
assets that <strong>District</strong> government could and should manage in a strategic manner specifically<br />
- 4 -
<strong>District</strong> <strong>of</strong> Columbia Industrial Areas Study DC Office <strong>of</strong> Planning<br />
Prepared by Phillips Preiss Shapiro Associates, Inc.<br />
because these assets are scarce. Unlike many suburban jurisdictions with ample space for<br />
accommodating future growth, each development decision made in DC carries with it an<br />
opportunity cost: the foreclosure <strong>of</strong> other development options. The portfolio perspective means<br />
that the <strong>District</strong> should view its inventory <strong>of</strong> developable sites as serving potentially different<br />
functions: addressing immediate needs and opportunities, hedges against future uncertainty, or<br />
resources held in reserve for anticipated future needs.<br />
DC’s current zoning policies do not adequately protect and foster the PDR sector or provide<br />
adequate space for local municipal functions (DC is subject to its own zoning). DC has two<br />
primary industrial zoning districts: C-M (Commercial-Light Manufacturing) and M<br />
(manufacturing). Both districts permit a wide variety <strong>of</strong> commercial uses (basically everything<br />
permitted in the C-1, C-2, C-3 and C-4 zones, which includes a wide variety <strong>of</strong> retail and service<br />
uses, including gasoline service stations) as well as industrial and production uses. Further, the<br />
bulk standards in these districts permit taller and more massive buildings than those generally<br />
preferred by PDR users, where low-scale and high coverage development is the norm.<br />
Industrial land today must therefore compete against retail and <strong>of</strong>fice uses. Only residential<br />
uses are prohibited.<br />
The appropriate public policy response could and should take two tracks. The first is the use <strong>of</strong><br />
zoning to provide appropriate standards and protections for PDR businesses where such<br />
continued use is appropriate. The second consists <strong>of</strong> policy response—industrial Business<br />
Improvement <strong>District</strong>s, contracting assistance, in-place industrial parks—intended to promote<br />
business development and growth in PDR sectors.<br />
Land Use Findings<br />
Out <strong>of</strong> the land use surveys, scoring exercise, and compilation <strong>of</strong> opportunities and constraints<br />
for each area, certain patterns began to emerge. For example, it was clear that some sub-areas<br />
faced imminent and growing redevelopment pressures from other land uses. Some areas<br />
contained a concentration <strong>of</strong> healthy PDR businesses, and some areas were relatively<br />
underutilized. Finally, there can be friction where industrial uses abut incompatible land uses<br />
such as new residential development. Map 3.1 in the full report illustrates these areas in distinct<br />
colors.<br />
Areas <strong>of</strong> pressure<br />
The <strong>District</strong>’s <strong>of</strong>fice development boom and housing market explosion has rapidly utilized many<br />
<strong>of</strong> the most desirable and easily accessible downtown development sites, and now real estate<br />
development forces are pressing heavily against industrial districts.<br />
Nowhere is this more evident than in those areas near Metro stops and with relatively easilydeveloped<br />
lots. North <strong>of</strong> Union Station towards Florida Avenue, including the market area and<br />
the New York Avenue Metro stop, and at each successive Red Line Metro stop—Rhode Island<br />
Avenue, CUA/Brookland, Fort Totten, and Takoma—real estate pressures are growing.<br />
- 5 -
<strong>District</strong> <strong>of</strong> Columbia Industrial Areas Study DC Office <strong>of</strong> Planning<br />
Prepared by Phillips Preiss Shapiro Associates, Inc.<br />
Rezoning requests trend towards these areas, and some larger initiatives including possible<br />
Planned Unit Developments in the NY/Florida Avenue Market area and along Eckington Place,<br />
as well as spin-<strong>of</strong>f from large initiatives such as NoMa and the H Street Corridor redevelopment<br />
are all increasing real estate values to the point where current PDR business area threatened.<br />
Map 3.2 illustrates known rezoning requests and major large initiatives. Areas <strong>of</strong> pressure are<br />
shown in light brown on Map 3.1.<br />
It makes sense that some <strong>of</strong> these areas be considered for land use change. In fact it is difficult<br />
to argue against well-planned transit oriented development in a relatively built-out city such as<br />
DC, where household and job gains are projected to continue relatively unabated over the<br />
coming years. However, several areas under development pressure, such as the NY/Florida<br />
Avenue Market area, are more appropriate for an evolution or intensification <strong>of</strong> the existing land<br />
use, rather than a land use change.<br />
Areas <strong>of</strong> Healthy PDR Fabric<br />
The sub-area existing conditions maps (found in the Appendix) reveal that some industrial<br />
zones contain a concentration <strong>of</strong> PDR businesses or municipal facilities. The businesses in<br />
these areas contribute to the DC economy directly by providing products and services, but also<br />
by supporting the core economic sectors and providing much needed well-paying jobs. The<br />
municipal facilities located in these areas provide necessary services for DC’s growing residents<br />
and businesses (Map 2.2 locates concentrations <strong>of</strong> municipal facilities).<br />
We describe these as areas <strong>of</strong> “healthy PDR fabric.” All <strong>of</strong> these areas also exhibit good<br />
opportunities for continued or intensified PDR use and scored well in our industrial area scoring<br />
exercise (see the Opportunities and Constraints analysis matrix and the scoring matrix in the<br />
Appendix).<br />
Areas <strong>of</strong> healthy PDR fabric are shown in blue on Map 3.1. These areas include much <strong>of</strong> CSX1<br />
- Lamond Riggs south <strong>of</strong> the Metro, significant portions <strong>of</strong> Fort Totten and Brookland, and large<br />
swaths <strong>of</strong> New York/Ivy City and New York/Bladensburg. Some <strong>of</strong> these areas deserve land use<br />
protection, and some should be considered for municipal services. None <strong>of</strong> these, save perhaps<br />
a narrow strip <strong>of</strong> land directly bordering New York Avenue, deserve consideration as land use<br />
change areas.<br />
Areas <strong>of</strong> Underutilization<br />
Some <strong>of</strong> DC’s industrial areas are underbuilt, have significant vacancies, or are otherwise<br />
underutilized—the existing conditions maps plainly reveal areas with few businesses and<br />
swaths <strong>of</strong> land used only for parking, junkyards, or railroad tracks. These areas are shown in<br />
olive green in Map 3.1.<br />
Vast areas <strong>of</strong> the CSX railroad yards are underutilized, as are large parcels including Fort<br />
Lincoln and portions <strong>of</strong> Bladensburg and Ivy City. Benning Road, 11th Street, SE, Water Street,<br />
- 6 -
<strong>District</strong> <strong>of</strong> Columbia Industrial Areas Study DC Office <strong>of</strong> Planning<br />
Prepared by Phillips Preiss Shapiro Associates, Inc.<br />
SE, DC Village, Anacostia Poplar Point, and Scattered Site 1 are underutilized and present<br />
excellent opportunities to intensify current uses and strategically locate government facilities.<br />
Some may also be areas where DC could consider undertaking redevelopment activities as part<br />
<strong>of</strong> a coordinated plan. Ivy City near the Hecht Building may be one such location where DC<br />
intervention could help jumpstart the upgrading and intensification <strong>of</strong> the area.<br />
Areas <strong>of</strong> friction<br />
Lastly, it is apparent in some areas that PDR businesses and incompatible land uses are<br />
located in very close proximity to each other. Nuisance complaints about noise, pollution, and<br />
visual blight relating to PDR businesses are likely most prevalent in these areas, and it is logical<br />
to assume that expansion or retention <strong>of</strong> PDR uses in these zones may be difficult. These areas<br />
<strong>of</strong> friction are shown in red on Map 3.1.<br />
These places more or less correspond to areas where PDR businesses and residential<br />
communities flow almost seamlessly with little or no buffer. Notably, areas <strong>of</strong> healthy PDR fabric<br />
in Lamond Riggs, Fort Totten, and Brookland all experience friction with the residential<br />
communities on their eastern edges. In many cases there is not even a street, much less an<br />
alley or fence line, dividing these two land uses. Most other areas <strong>of</strong> friction occur where the<br />
industrial land is underutilized. The protection and/or intensification <strong>of</strong> current PDR uses in<br />
these areas (e.g. Lamond Riggs) would require buffer considerations; on the other hand, land<br />
use changes may be more appropriate in some areas (e.g. CSX2-Kennilworth).<br />
SUMMARY OF MAJOR RECOMMENDATIONS<br />
The recommendations herein consider the need for and importance <strong>of</strong> appropriate industrial<br />
land in DC, the supply and demand for industrial land and buildings, and the overall findings<br />
resulting from the land use surveys and sub-area analyses described above. They are intended<br />
for two purposes: (1) guide zoning policy as it relates to industrially-zoned land; and (2) guide<br />
the formulation <strong>of</strong> strategies to maintain and enhance our base <strong>of</strong> PDR employment. Item one<br />
speaks directly to land use; item two has both land use and policy components.<br />
Simply put, this study revealed that DC’s existing zoning framework regarding industrially zoned<br />
land requires amendment and modernization. This study posits a new zoning framework for<br />
industrial land, which is then referenced in subsequent sections. This framework is in direct<br />
response to deficiencies identified in the existing zoning categories and regulations, and is<br />
designed to address the issues outlined in the previous sections <strong>of</strong> this report. The<br />
recommendations for different industrial sub-districts cannot be adequately implemented within<br />
the existing zoning framework. The new framework keeps the existing zone districts, with<br />
- 7 -
<strong>District</strong> <strong>of</strong> Columbia Industrial Areas Study DC Office <strong>of</strong> Planning<br />
Prepared by Phillips Preiss Shapiro Associates, Inc.<br />
modifications, but further recommends two new zoning districts to be added to the zoning<br />
ordinance and map. 1<br />
New Zoning Framework<br />
A new zoning framework is proposed to overcome the limitations <strong>of</strong> the current C-M and M<br />
districts, including the following:<br />
They do not prohibit retail or <strong>of</strong>fice uses from overtaking industrial areas and displacing<br />
PDR tenants.<br />
The bulk standards bear do not reflect the low-scale, high-coverage built environments<br />
generally found within these districts.<br />
The regulations are somewhat vague as to what precisely is permitted in the M district.<br />
The performance standards for industrial areas require modernization.<br />
The proposed new zoning framework for the DC’s industrial areas is as follows:<br />
C-M <strong>District</strong>s<br />
Only minor modifications are proposed to the C-M district regulations. The general intent <strong>of</strong> the<br />
district—to permit a variety <strong>of</strong> retail, <strong>of</strong>fice, and industrial/PDR uses—remains unchanged.<br />
However, the following revisions are proposed:<br />
Prohibit high-impact industries such as intermediate materials recycling and solid waste<br />
handling facilities, to minimize the possibility <strong>of</strong> land use conflicts.<br />
Prohibit certain community uses that detract from the commercial or PDR nature <strong>of</strong> the<br />
area and which present immediate conflicts with their PDR neighbors, specifically,<br />
charter schools and emergency shelters.<br />
Make retail uses above a certain size (for instance, 30,000 square feet) permitted only<br />
by special exception, to provide more control over their siting and location.<br />
Bulk standards in the C-M-1, C-M-2, and C-M-3 district can be left unchanged subject to further<br />
review. Continued C-M zoning is contemplated for areas where a mix <strong>of</strong> industry, <strong>of</strong>fice and<br />
retail development is appropriate, such as the New York Avenue corridor in the vicinity <strong>of</strong> the<br />
Hecht Building.<br />
1 A Municipal Use zone, per se, is not recommended, as it would likely be viewed as a taking <strong>of</strong> private<br />
property. However, a municipal use or public use designation on a land use map is recommended, as a<br />
statement <strong>of</strong> policy.<br />
- 8 -
<strong>District</strong> <strong>of</strong> Columbia Industrial Areas Study DC Office <strong>of</strong> Planning<br />
Prepared by Phillips Preiss Shapiro Associates, Inc.<br />
M <strong>District</strong><br />
The M district should be retooled to serve as an industry-only district. Heavy and intense<br />
industrial uses such as cement and asphalt batching would be specifically permitted, subject to<br />
strict performance and location standards (not within certain distances <strong>of</strong> residential districts, for<br />
example). Other categories <strong>of</strong> commercial use, including <strong>of</strong>fice and hotel, would be prohibited.<br />
The M district would find limited application in the few areas where such intense use is already<br />
found. An example is the area south <strong>of</strong> Fort Totten Metro, where cement and asphalt batching,<br />
as well as a municipal waste transfer station, are found.<br />
IP Industrial Park <strong>District</strong><br />
The IP district would be a new zone specifically geared towards healthy industrial areas that<br />
would benefit from more coordinated planning. It would differ from suburban industrial park<br />
zoning in that bulk and coverage regulations would be tailored for older industrial areas<br />
characterized by low height and high site coverage. It differs from the Chicago PMD model in<br />
that it does not overlay existing zoning, but instead creates a new designation with its own use<br />
and bulk restrictions. Like the M district, this new IP district would encourage industrial over<br />
other commercial uses. However, certain types <strong>of</strong> <strong>of</strong>fice and retail would be permitted, including:<br />
Retail accessory to a PDR use (such as a wholesaler with a small retail operation, or a<br />
manufacturer selling goods on site).<br />
Offices accessory to a PDR use.<br />
Eating places, which would help serve the worker population’s needs.<br />
Areas where IP zoning would be appropriate could include Chillum Place and the Florida<br />
Avenue Wholesale Market. The latter requires special consideration, and may in fact merit its<br />
own special-purpose overlay district.<br />
MXD Mixed-use <strong>District</strong><br />
The MXD permits residential, commercial and light PDR uses, for a truly mixed use approach.<br />
This district is intended for the following types <strong>of</strong> areas:<br />
Funky areas where live/work arrangements combining residential with craft trades or the<br />
visual and performing arts is appropriate.<br />
Areas that are surrounded by and/or will likely trend to residential uses, but where there<br />
do exist PDR businesses that should not be rendered non-conforming by a change <strong>of</strong><br />
zoning.<br />
Areas where the direction is unclear and therefore better left to the marketplace.<br />
The types <strong>of</strong> PDR uses contemplated for these new zones would be things such as self-storage,<br />
printing, craft occupations such as furniture making and cabinetry, and light fabrication. More<br />
than any other district, appropriate performance standards would be essential. And, mixed-use<br />
- 9 -
<strong>District</strong> <strong>of</strong> Columbia Industrial Areas Study DC Office <strong>of</strong> Planning<br />
Prepared by Phillips Preiss Shapiro Associates, Inc.<br />
zoning requires vigilant enforcement <strong>of</strong> regulations to ensure the various uses remain “good<br />
neighbors” to each other. Areas where MXD zoning would be appropriate would include<br />
Scattered Site 2, a healthy industrial enclave entirely surrounded by residential; and portions <strong>of</strong><br />
the Fort Totten area, where a mix <strong>of</strong> industry and residential is already the norm.<br />
This new zoning framework provides a flexible approach to manage change in DC’s industrial<br />
areas. The zoning generally avoids large-scale changes to minimize property owner concerns. It<br />
envisions that these districts would only be mapped in areas where the proscribed land uses<br />
predominate. The proposed MXD district actually provides greater property owner flexibility in<br />
contemplating use options. Finally, the proposed zoning provides greater protection for existing<br />
and future PDR users, which should help promote a more stable climate, and less speculation,<br />
in key industrial areas.<br />
Land Use Recommendations<br />
Based on this new zoning framework and our recommendations logic, DC’s industrial areas<br />
were divided into four categories based on the appropriate policy response:<br />
Areas for Retention and Reinforcement: Intended for areas that exhibit healthy PDR<br />
fabric, provide a significant concentration <strong>of</strong> support services and PDR jobs, and have<br />
good prospects for continuing to host viable PDR businesses into the future. The new IP<br />
and MXD zoning districts would be proposed for most <strong>of</strong> these areas, except for areas <strong>of</strong><br />
intense uses, which would be zoned M.<br />
Areas for Retention and Intensification: This category is for areas where PDR use<br />
exists and continues to be desirable, but where intensification is warranted due to a<br />
pattern <strong>of</strong> underutilization, and where non-PDR uses are an appropriate part <strong>of</strong> the<br />
overall land use mix. These areas are most appropriate for C-M zoning.<br />
Areas for Strategic Public Use: Certain industrial areas have been identified as<br />
appropriate areas to accommodate municipal/government/utility space needs. Other<br />
uses are not precluded, but these are potential priority areas for public acquisition and<br />
reuse. In most cases, zoning can remain the same as the current condition.<br />
Areas for Land Use Change: These are areas where a move away from PDR use is<br />
appropriate, due to a lack <strong>of</strong> viable PDR businesses, and the desirability <strong>of</strong> these sites<br />
for other uses. In most cases, residential development is contemplated. There are two<br />
sub-categories within this category: areas where a gradual replacement <strong>of</strong> PDR use with<br />
residential is envisioned (letting the market take its course); and areas where PDR<br />
should essentially be zoned away. Many <strong>of</strong> these areas are proposed for a new zoning<br />
district permitting both residential and light PDR uses such as storage and light<br />
fabrication.<br />
- 10 -
<strong>District</strong> <strong>of</strong> Columbia Industrial Areas Study DC Office <strong>of</strong> Planning<br />
Prepared by Phillips Preiss Shapiro Associates, Inc.<br />
Areas for Industrial Retention and Reinforcement<br />
The following specific recommendations for the areas targeted for industrial retention are keyed<br />
to Map 4.1. They are:<br />
Map IP zones for areas 1, 4 and, tentatively, 6.<br />
Map the retooled M zone in area 2.<br />
Map C-M zones in areas 3, 5 and 7.<br />
Adopt stringent rezoning criteria for all <strong>of</strong> these areas.<br />
Adopt strategies and guidelines for industrial parks and industrial business districts, and<br />
consider such a designation for the Chillum Place corridor.<br />
Work with the Department <strong>of</strong> Employment Services to institute a “Back Street”-like<br />
program for businesses in these areas, and provide support for job training and<br />
apprenticeship programs.<br />
Areas for Retention and Intensification<br />
The following specific recommendations for the areas targeted for evolution and intensification<br />
are keyed to Map 4.2. They are:<br />
Work with the Home Again Initiative to ensure that the envisioned residential uses mesh<br />
well with surrounding PDR uses—artist live/work housing is one example <strong>of</strong> a residential<br />
use that is appropriate.<br />
Make access and road improvements in Areas 1 and 2 after completing appropriate<br />
transportation and planning studies.<br />
Consider assembling land for private users in Area 2.<br />
Institute appropriate regulations to protect industrial/commercial uses in Area 4, but<br />
provide buffers between incompatible land uses.<br />
Initiate building renovation loan program.<br />
If planned destination retail development at Area 4 is not fruitful, consider development<br />
as an <strong>of</strong>fice park, and/or consider rezoning parcel directly south <strong>of</strong> Area 4 for PDR use.<br />
Consider taking a leadership role with regards to the reuse <strong>of</strong> the Hecht Building,<br />
potentially pursing a multi-tenant technology and media “incubator.”<br />
Areas for Strategic Public Sector Use<br />
The following specific recommendations for the areas targeted for strategic public sector use<br />
are keyed to Map 4.3. They are:<br />
- 11 -
<strong>District</strong> <strong>of</strong> Columbia Industrial Areas Study DC Office <strong>of</strong> Planning<br />
Prepared by Phillips Preiss Shapiro Associates, Inc.<br />
Retain current industrial zoning, but consider designations such as Municipal Use zones<br />
to land bank these areas and guarantee that the areas will be available in the long-term<br />
for needed public sector use. 2<br />
Target these Zones for technical innovations.<br />
Be proactive in acquiring land for public sector uses at Benning Road, 11th Street, SE,<br />
Water Street, SE, Scattered Site 1, and Anacostia Poplar Point.<br />
Improve road and access conditions after completing appropriate transportation and<br />
planning studies.<br />
Address any needed security/perimeter infrastructure that may be required.<br />
Consider Area 7 for municipal <strong>of</strong>fices or other destination, public sector use.<br />
Undertake modifications to free up additional property in DC Village for municipal<br />
purposes.<br />
Relocate the Emergency Family Shelter to a more humane location, potentially several<br />
scattered sites located in residential and mixed residential/commercial areas.<br />
Consider those areas indicated in purple as additional areas for public sector use, where<br />
industrial zoning may be appropriate to protect and retain the current users.<br />
Areas for Land Use Change<br />
The following specific recommendations for the areas targeted for land use change are keyed to<br />
Map 4.4. They are:<br />
Program Areas 1, 7 and 8 for residential and mixed-use TOD development.<br />
Encourage upgraded retail uses in area 10, and consider rezoning to a commercial land<br />
use classification.<br />
Encourage the redevelopment <strong>of</strong> Area 6 for either a more modern and attractive<br />
shopping center, or for residential use.<br />
In addition, all MXD areas should be studied to determine their needs for physical<br />
improvements, including land clearance and assemblage to encourage investment as<br />
well as road and circulation and access improvements. Overall, environmental issues<br />
and historic properties deserve consideration, and new developments in MXD areas<br />
should follow appropriate procedures in this regard. Additionally, DC should adopt a<br />
coherent and effective brownfield program to identify and remediate contaminated sites<br />
and inject them back into the property market.<br />
Vigilantly enforce zoning use regulations and performance standards to ensure mixeduse<br />
remain “good neighbors.”<br />
2 Again this is not a new zoning district. A Municipal Use zone, per se, is not recommended, but, a<br />
municipal use or public use designation on a land use map is recommended, as a statement <strong>of</strong> policy.<br />
- 12 -
<strong>District</strong> <strong>of</strong> Columbia Industrial Areas Study DC Office <strong>of</strong> Planning<br />
Prepared by Phillips Preiss Shapiro Associates, Inc.<br />
Government Facilities<br />
The public sector demand for industrial land is great, but large developments and the<br />
superheated regional land market are shrinking supply at the same time that increasing service<br />
requirements are raising immediate and long-term demand for land. As such a significant user<br />
<strong>of</strong> industrial land in DC, clearly government has the potential and responsibility to better manage<br />
its own industrial land resources.<br />
This report thus recommends that DC should:<br />
Strategically acquire land for municipal uses for current and future needs<br />
Implement a single-agency asset management structure to budget, operate, lease,<br />
acquire, dispose, and plan for all municipal property<br />
Improve efficiency <strong>of</strong> land use by co-locating government facilities<br />
Reduce land use demand through fleet reduction and technological innovations,<br />
including distributed generation.<br />
- 13 -
<strong>District</strong> <strong>of</strong> Columbia Industrial Areas Study DC Office <strong>of</strong> Planning<br />
Prepared by Phillips Preiss Shapiro Associates, Inc.<br />
1 Introduction<br />
1.1 PURPOSE AND SCOPE<br />
The economy and real estate market in the <strong>District</strong> <strong>of</strong> Columbia are undergoing rapid change.<br />
Since 1997, the <strong>District</strong> has seen impressive private sector job production, which has led to a<br />
boom in <strong>of</strong>fice building construction. This boom started by filling in the gaps in the downtown<br />
block pattern, and has since expanded outward to include new developments in Buzzard Point,<br />
the recently-opened New York Avenue Metro stop, and extensions <strong>of</strong> the downtown into the<br />
NOMA area. Likewise, a robust housing market has produced a torrent <strong>of</strong> new residential<br />
projects, most <strong>of</strong> them multifamily developments located in or near the downtown, at transitoriented<br />
sites near Metro stops, and in scattered infill locations in desirable and up-and-coming<br />
neighborhoods. Following on the heels <strong>of</strong> the <strong>of</strong>fice and residential markets, major retailers have<br />
rediscovered DC. Regional and national retail tenants, ranging from supermarkets to big boxes<br />
to boutiques, have gone from reluctant partners to eager participants in the <strong>District</strong>’s recent<br />
retail renaissance.<br />
In the midst <strong>of</strong> this boom, the <strong>District</strong>’s industrially-zoned areas—hugging rail corridors, tucked<br />
away in remote locations, and sprawling next to major automotive service corridors—have been<br />
largely forgotten. However, as many <strong>of</strong> the more easily developed and favorably located sites<br />
disappeared, commercial and residential developers have begun to turn their interest to<br />
industrial land, particular those sites which occupy strategic locations and <strong>of</strong>fer relatively<br />
straightforward property assemblages. Requests for the rezoning <strong>of</strong> industrial land to some<br />
other category, typically one permitting residential development, have been increasingly<br />
common.<br />
At the same time, several factors have conspired to increase the space needs <strong>of</strong> government<br />
and public entities. Simple growth—jobs and households—in the <strong>District</strong> increases demand for<br />
municipal services and utilities. Related is the growth in transit ridership and demand for better<br />
transit service, which translates into more bus garages, proposed light rail yards, and other<br />
related services. Further, the plan to build a new stadium for the Washington Nationals on a site<br />
in Buzzard Point has created the immediate need to relocate several key public functions<br />
related to <strong>District</strong> operations, water and sewer service, and bus maintenance and storage. Many<br />
<strong>of</strong> these needs are quasi-industrial in nature, and will be hard to site: bus garages, helipads,<br />
vehicle storage and maintenance, have unique site selection criteria for functionality and at the<br />
same time are uses that are less-than-welcome in established or emerging neighborhoods<br />
elsewhere in the <strong>District</strong>. Since <strong>District</strong> government is bound by its own zoning, the need for<br />
industrially-zoned land for government functions goes beyond concerns over NIMBYism.<br />
Much <strong>of</strong> the land in question is already occupied by a diverse array <strong>of</strong> industrial and quasiindustrial<br />
users, grouped in this report under the descriptive title <strong>of</strong> Production, Distribution and<br />
Repair businesses (PDR). As this report will describe in detail, PDR businesses in the <strong>District</strong><br />
- 14 -
<strong>District</strong> <strong>of</strong> Columbia Industrial Areas Study DC Office <strong>of</strong> Planning<br />
Prepared by Phillips Preiss Shapiro Associates, Inc.<br />
are paying higher rents for less suitable space than many <strong>of</strong> their suburban counterparts,<br />
evidencing a need, and willingness to pay premiums, to be located in the <strong>District</strong>. Yet the role<br />
these industries play in the <strong>District</strong> economy is poorly-understood. The relatively lower real<br />
estate value generated by such users has made it easy to dismiss their relevance to a national<br />
and global capital primarily concerned with the business <strong>of</strong> government and policy-making.<br />
Clearly, there are increasing demands to make policy decisions regarding the <strong>District</strong>’s<br />
inventory <strong>of</strong> industrially-zoned lands, decisions which are currently being made on a site-by-site<br />
basis without the benefit <strong>of</strong> a comprehensive strategy. Decision-making is further hampered by<br />
a lack <strong>of</strong> basic information necessary to make knowledgeable choices. Gaps in information—<br />
information necessary for understanding the opportunity costs <strong>of</strong> rezoning industrial land—that<br />
existed at the start <strong>of</strong> this study, included the following:<br />
The amount <strong>of</strong> industrially-zoned land, including how much is vacant, and how much is<br />
underutilized.<br />
The types <strong>of</strong> users occupying industrially zoned land in the district, and their geographic<br />
distribution.<br />
The role and importance <strong>of</strong> these users, and PDR businesses generally, in the <strong>District</strong>’s<br />
economy.<br />
The current state <strong>of</strong> the market for industrial land and buildings.<br />
On the municipal and government space needs side, the gaps in knowledge and data are even<br />
more pronounced, and some can not be fully addressed in this report. As part <strong>of</strong> the research<br />
undertaken, it was discovered that:<br />
Many <strong>District</strong> agencies are not able to produce a complete inventory <strong>of</strong> what properties<br />
they own or lease. Inventories put together for this report lack such key details such as<br />
the size and use <strong>of</strong> the property, the square footage <strong>of</strong> any improvements, and the<br />
property’s zoning.<br />
Property site identification is currently undertaken both by DC’s Office <strong>of</strong> Property<br />
Management (OPM) and individual agencies; sometimes, representatives <strong>of</strong> OPM and a<br />
specific agency are both looking for sites at the same time.<br />
There is inadequate coordination between agencies when developing plans for<br />
improving current operations and providing for future space needs. Opportunities for<br />
shared facilities and other synergies may therefore be lost.<br />
The purpose <strong>of</strong> this report is therefore tw<strong>of</strong>old: (1) to provide the factual and analytical base for<br />
future land use decisions impacting industrial land and PDR land uses; and (2) to provide a set<br />
<strong>of</strong> recommendations for strategically managing the <strong>District</strong>’s scarce supply <strong>of</strong> land suitable for<br />
accommodating PDR users and certain municipal, utility, and governmental functions.<br />
- 15 -
<strong>District</strong> <strong>of</strong> Columbia Industrial Areas Study DC Office <strong>of</strong> Planning<br />
Prepared by Phillips Preiss Shapiro Associates, Inc.<br />
1.2 METHODOLOGY<br />
The findings and recommendations contained in this report are founded on a detailed and<br />
comprehensive methodology examining the <strong>District</strong>’s industrial lands from a land use,<br />
economic, and market perspective. The study “areas” for this report refer to blocks <strong>of</strong> land<br />
delineated by the DC Office <strong>of</strong> Planning (OP) to correspond roughly areas surrounding CM or M<br />
zoning or containing a concentration <strong>of</strong> industrial businesses and/or industrial land. OP further<br />
divided these areas into analytical sub-areas. 3 The accompanying Study Areas Map indicates<br />
each area and its OP-given name.<br />
The sub-areas provide the geographic organization for the land use analysis and for the specific<br />
recommendations. However, the methodology for the report went far beyond land use studies to<br />
incorporate the following tasks and investigations:<br />
Field surveys and mapping. Each <strong>of</strong> the delineated sub-areas was surveyed to identify<br />
existing land uses, major tenants, and other physical planning issues such as access,<br />
building typology, and intensity. Land uses and tenants were then mapped onto base<br />
maps showing building footprints and paved areas. The Office <strong>of</strong> Planning’s existing land<br />
use layer provided the surrounding land use context. (The Study Areas Map illustrates<br />
the <strong>District</strong>’s industrially zoned areas and shows the sub-area names).<br />
Opportunities and Constraints Analysis. Based on the field surveys and mapping, an<br />
Opportunities and Constraints matrix was prepared to assess particular attributes <strong>of</strong><br />
each industrially-zoned sub area. The purpose <strong>of</strong> this analysis was to provide qualitative<br />
bases for differentiating areas appropriate for PDR retention from areas suitable for land<br />
use change, as well as to suggest specific strategies aimed addressing identified issues.<br />
Scoring Matrix. After being surveyed, each sub-area was scored on criteria including<br />
adjacent land uses, access and circulation, parcel size, and existing PDR users to<br />
determine its overall fitness as an industrial area. This scoring exercise was meant to<br />
provide a quantitative basis for our findings.<br />
Industrial Users Survey. A survey <strong>of</strong> industrial users was mailed to every address<br />
located in an industrial zone. Almost 2,000 were mailed out, and several hundred were<br />
returned—182 in usable condition. The surveys asked questions regarding the nature <strong>of</strong><br />
the respondents business, their reasons for locating and remaining in the <strong>District</strong>, the<br />
importance <strong>of</strong> a <strong>District</strong> location to their business, relationship to the <strong>District</strong>’s economy,<br />
and their future plans for expansion or relocation<br />
Market analysis. An investigation <strong>of</strong> the market for industrial land and buildings was<br />
undertaken. The analysis included a review <strong>of</strong> market summary reports issued by large<br />
commercial real estate brokerages active in the region, such as CoStar; as well as<br />
3 These sub-areas are predominately zoned C-M or M in the City’s zoning ordinance, but in many cases<br />
they include areas zoned for residential or commercial use. The accompanying zoning maps indicate the<br />
precise zoning designations within each sub-area comprising this study.<br />
- 16 -
<strong>District</strong> <strong>of</strong> Columbia Industrial Areas Study DC Office <strong>of</strong> Planning<br />
Prepared by Phillips Preiss Shapiro Associates, Inc.<br />
interviews with individual brokers and leasing agents active in DC and knowledgeable<br />
about local market conditions.<br />
Economic analysis. In order to understand the role that PDR business play in the<br />
<strong>District</strong> economy, an economic analysis was undertaken. Tasks included a sector<br />
employment analysis for PDR industries; interviews with businesses, economic<br />
development pr<strong>of</strong>essionals, and others; and an investigation <strong>of</strong> backward linkages from<br />
DC’s core sectors to PDR sectors. A key question has been the importance <strong>of</strong> certain<br />
PDR support services being located within the <strong>District</strong>, near to their customer base. The<br />
industrial users survey, the interviews, and secondary data sources such as the national<br />
input-output accounts, were used to inform these issues.<br />
Technical Advisory Committee (TAC). Municipal/government/utility facility and space<br />
needs merited a veritable “study within a study”. At the heart <strong>of</strong> this process was a<br />
Technical Advisory Committee comprised <strong>of</strong> representatives <strong>of</strong> <strong>District</strong> agencies, the<br />
Federal Government, and public authorities such as the Washington Metropolitan Area<br />
Transit Authority (WMATA) and Washington Area Sewer Authority (WASA). The purpose<br />
<strong>of</strong> the TAC has been to identify pressing needs; brainstorm solutions; and test<br />
recommendations for addressing the identified needs.<br />
Case studies and best practices. A number <strong>of</strong> relevant case studies from other cities,<br />
many identified by the Office <strong>of</strong> Planning, were reviewed as a part <strong>of</strong> this report.<br />
Summaries <strong>of</strong> these case studies appear in the relevant sections. The case studies<br />
included sample industrial land studies, industrial retention strategies, zoning strategies,<br />
and municipal facilities best practices.<br />
Potential zone change criteria. In response to a request from the Office <strong>of</strong> Planning, a<br />
preliminary set <strong>of</strong> criteria were developed to provide interim advice to the Zoning<br />
Commission regarding petitions for a change <strong>of</strong> zone affecting an industrial area.<br />
Originally conceived <strong>of</strong> as criteria for determining the appropriateness <strong>of</strong> a zone change,<br />
they later evolved into criteria for determining the appropriateness <strong>of</strong> considering a zone<br />
change. These preliminary criteria have been further refined and appear in the Chapter 4<br />
<strong>of</strong> this report.<br />
The report’s land use recommendations followed a clear logical path—they were not made<br />
arbitrarily or without great deliberation. The field work and mapping, TAC, users survey, and<br />
economic analysis helped determine the <strong>District</strong>’s future “heavy” land use needs. Then, the<br />
sub-area analyses helped us determine which areas were suitable for PDR use. Based on<br />
the specific site characteristics and market factors, we then determined whether suitable<br />
sites were better for public or private uses. Figure 1.1 shows how the technical and<br />
analytical analyses contributed to the recommendations.<br />
- 17 -
<strong>District</strong> <strong>of</strong> Columbia Industrial Areas Study DC Office <strong>of</strong> Planning<br />
Prepared by Phillips Preiss Shapiro Associates, Inc.<br />
Figure 1.1: Recommendations Logic Path<br />
The work described above, while focused on the issue <strong>of</strong> industrial land, has not occurred in a<br />
vacuum, but has been undertaken concurrently with work on the economic development<br />
element <strong>of</strong> DC’s new Comprehensive Plan. The background studies for the Comprehensive<br />
Plan, summarized as an economic development White Paper, were conducted in tandem with<br />
this industry study, and data and findings from each report have helped inform the other. This<br />
high level <strong>of</strong> coordination insures that the Comprehensive Plan and the Industrial Areas Study<br />
will be fully consistent with each other.<br />
1.3 KEY CONCEPTS<br />
Throughout this report, several key concepts are repeatedly referenced. These concepts are<br />
defined and discussed in this section.<br />
The first is the term PDR, standing for Production, Distribution and Repair. 4 This terminology<br />
is adopted from an industrial areas study for the City <strong>of</strong> San Francisco. The word “industry”<br />
4 See San Francisco Planning Department. 2002. Industrial Land in San Francisco: Understanding<br />
Production, Distribution, and Repair. San Francisco, CA. July.<br />
- 18 -
<strong>District</strong> <strong>of</strong> Columbia Industrial Areas Study DC Office <strong>of</strong> Planning<br />
Prepared by Phillips Preiss Shapiro Associates, Inc.<br />
brings to mind images <strong>of</strong> manufacturing plants, mills, and other heavy uses not reflective <strong>of</strong><br />
what goes on in DC’s industrial districts. The PDR term, while not perfect, better captures the<br />
types <strong>of</strong> “heavy services” that are found in the <strong>District</strong>s industrial areas: Production, i.e., the<br />
actual making <strong>of</strong> things, including construction-related industries; distribution, including<br />
warehousing and transportation; and repair, which includes the maintenance and repair <strong>of</strong><br />
vehicles, machinery and equipment, and buildings through the building trades.<br />
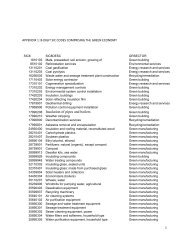
Based on employment data for the <strong>District</strong> <strong>of</strong> Columbia, specific industrial sectors, as<br />
represented by three-digit North American Industrial Classification System (NAICS) codes, have<br />
been developed for industries that are present in the <strong>District</strong>. This classification is shown in<br />
Table 1.1.<br />
The second key concept is economic linkages, also referred to as buyer-supplier relationships.<br />
This report is primarily concerned with backward linkages, which are features <strong>of</strong> the economy<br />
in which the major core industries—lawyers, consultants, computer systems designers, and the<br />
hospitality industries <strong>of</strong> lodging and dining—source services, materials, and other inputs from<br />
local and regional suppliers. Some <strong>of</strong> these supplying businesses can reap particular<br />
advantages from a location close to their customer base. These advantages include timeliness,<br />
a significant issue in a region with some <strong>of</strong> the nation’s most severe traffic congestion; lower<br />
transport costs, important when these make up a significant share <strong>of</strong> the cost <strong>of</strong> delivering the<br />
good or service; and simple proximity, which makes it easier for the purchaser to visit and<br />
communicate in a face-to-face manner with the supplier. For many buyer-supplier relationships,<br />
these advantages may be small and outweighed by the differential in land and space costs<br />
between the <strong>District</strong> and the suburbs. For others, however, they can be critical enough that not<br />
only the supplier, but also the buyer (in this case, the core industry) might suffer were the<br />
supplier to be unable to locate in an easily accessible location.<br />
1.4 STRUCTURE OF THE REPORT<br />
The remainder <strong>of</strong> this report is structured to provide the background information necessary for<br />
understanding the recommendations, and then to present the recommendations in a manner<br />
that is most useful for the primary audiences for this report, namely the Zoning Commission, the<br />
Office <strong>of</strong> Planning, and the agencies that participated in the TAC process, including the Office <strong>of</strong><br />
Property Management.<br />
Chapter Two summarizes much <strong>of</strong> the background research for the report by way <strong>of</strong> answering<br />
the fundamental question: Why should public policy be concerned with the fate <strong>of</strong> DC’s<br />
industrial lands? The answer comes in the form <strong>of</strong> an analysis <strong>of</strong> PDR uses and their<br />
importance to the local economy and as a source <strong>of</strong> jobs; the strategic value <strong>of</strong> industrial land in<br />
the face <strong>of</strong> increasingly scarce land resources; and the peculiar needs <strong>of</strong> particular government<br />
functions which are best satisfied on industrial land located within the <strong>District</strong>.<br />
- 19 -
<strong>District</strong> <strong>of</strong> Columbia Industrial Areas Study DC Office <strong>of</strong> Planning<br />
Prepared by Phillips Preiss Shapiro Associates, Inc.<br />
Table 1.1: PDR Industries in the <strong>District</strong> <strong>of</strong> Columbia<br />
Production<br />
NAICS 221 Utilities<br />
NAICS 236 Construction <strong>of</strong> buildings<br />
NAICS 237 Heavy and civil engineering construction<br />
NAICS 238 Specialty trade contractors<br />
NAICS 311 Food manufacturing<br />
NAICS 315 Apparel manufacturing<br />
NAICS 323 Printing and related support activities<br />
NAICS 324 Petroleum and coal products manufacturing<br />
NAICS 327 Nonmetallic mineral product manufacturing<br />
NAICS 332 Fabricated metal product manufacturing<br />
NAICS 333 Machinery manufacturing<br />
NAICS 334 Computer and electronic product manufacturing<br />
NAICS 336 Transportation equipment manufacturing<br />
NAICS 337 Furniture and related product manufacturing<br />
NAICS 339 Miscellaneous manufacturing<br />
NAICS 511 Publishing industries, except Internet<br />
NAICS 512 Motion picture and sound recording industries<br />
NAICS 515 Broadcasting, except Internet<br />
NAICS 517 Telecommunications<br />
Distribution<br />
NAICS 423 Merchant wholesalers, durable goods<br />
NAICS 424 Merchant wholesalers, nondurable goods<br />
NAICS 444 Building material and garden supply stores<br />
NAICS 481 Air transportation<br />
NAICS 483 Water transportation<br />
NAICS 484 Truck transportation<br />
NAICS 485 Transit and ground passenger transportation<br />
NAICS 488 Support activities for transportation<br />
NAICS 492 Couriers and messengers<br />
Maintenance & Repair<br />
NAICS 562 Waste management and remediation services<br />
NAICS 811 Repair and maintenance<br />
NAICS 812 Personal and laundry services<br />
Source: Phillips Preiss Shapiro Associates, Inc.<br />
U.S. Bureau <strong>of</strong> Labor Statistics, Covered Employment & Wages (CEW) Series<br />
Chapter Three presents an analysis <strong>of</strong> existing conditions in DC’s industrial zones, with a<br />
particular emphasis on land use and physical planning considerations, but also including an<br />
overview <strong>of</strong> current industrial real estate market conditions. This chapter references and<br />
summarizes a more exhaustive sub-area analysis prepared for an interim technical document.<br />
The major findings <strong>of</strong> that analysis are presented here, culminating in the classification <strong>of</strong> each<br />
sub-area according to the particular opportunities and constraints found in the sub-area.<br />
- 20 -
<strong>District</strong> <strong>of</strong> Columbia Industrial Areas Study DC Office <strong>of</strong> Planning<br />
Prepared by Phillips Preiss Shapiro Associates, Inc.<br />
Chapter Four presents the detailed recommendations <strong>of</strong> the report. It begins by proposing a<br />
new zoning framework for industrial land that more closely reflects the particular character <strong>of</strong><br />
different industrial sub-districts. It then presents detailed land use and policy recommendations<br />
aimed at four categories <strong>of</strong> industrial area: (1) areas meriting preservation for their existing use,<br />
including zoning protections, infrastructure investments, and industrial retention policies; (2)<br />
areas which should retain industrial use, but which would benefit from a change in the use<br />
pr<strong>of</strong>ile and an overall intensification, to fully activate these areas economically; (3) areas that<br />
should be strategically targeted and managed for their ability to satisfy critical public-sector<br />
needs; and (4) areas where a change <strong>of</strong> use, particularly to permit residential, mixed-use and<br />
TOD development, is warranted. The chapter closes with two sections specifically targeting<br />
<strong>District</strong> government policies and procedures, specifically ways to better manage and utilize the<br />
<strong>District</strong>s current and future real property inventory; and guidelines for land use decision-making<br />
when industrial lands are involved.<br />
References and appendices are provided in additional chapters at the end <strong>of</strong> this report.<br />
This report has been prepared at a critical time, when both the opportunities for positive change<br />
and the potential for missteps have seldom been more pronounced. It is hoped that this report<br />
can provide a new level <strong>of</strong> clarity and insight into one <strong>of</strong> the key areas that the <strong>District</strong> must<br />
consider as it moves forward with its new Comprehensive Plan.<br />
- 21 -
<strong>District</strong> <strong>of</strong> Columbia Industrial Areas Study DC Office <strong>of</strong> Planning<br />
Prepared by Phillips Preiss Shapiro Associates, Inc.<br />
2 Rationale for the Study<br />
Office and housing provide far better returns on investment than industrial development, and<br />
developers are ready to move with projects converting industrial areas over to commercial and<br />
residential use. Why should zoning, and <strong>District</strong> government policy, stand in the way? The<br />
answer, which lies at the core <strong>of</strong> this study, is multifactorial, but essentially reduces to the need<br />
to think strategically about existing and future needs. Considered in isolation, each individual<br />
development site could be subject to its own highest and best use analysis. Taken together,<br />
however, they represent a portfolio <strong>of</strong> assets that <strong>District</strong> government must manage in a<br />
strategic manner specifically because these assets are scarce. Unlike suburban jurisdictions<br />
with ample space for accommodating future growth, each development decision made in DC<br />
carries with it an opportunity cost: the foreclosure <strong>of</strong> other development options. The portfolio<br />
perspective means that the <strong>District</strong> should view its inventory <strong>of</strong> developable sites as serving<br />
potentially different functions: immediate opportunities, hedges against future uncertainty, or<br />
resources held in reserve for anticipated future needs.<br />
This chapter explores various aspects <strong>of</strong> the question posed above. The first two sections are<br />
economic in nature, and explore the role <strong>of</strong> PDR industries in the <strong>District</strong>’s economy, with a<br />
particular focus on linkages to core industries and impacts on the cost <strong>of</strong> business; as well as<br />
PDR businesses as a source <strong>of</strong> jobs, particularly jobs requiring less than a post-secondary<br />
education but still <strong>of</strong>fering possibilities for living wages and advancement. The remaining<br />
sections take up the theme <strong>of</strong> thinking strategically about industrial land as a needed, and<br />
irreplaceable, asset. First, the extent <strong>of</strong> the development pressures impacting industrial land are<br />
described and quantified, where appropriate. Next, the supply <strong>of</strong> industrial land, including an<br />
analysis <strong>of</strong> the amount that is vacant or underutilized, is detailed: this represents the supply side<br />
<strong>of</strong> the equation. Next, public and private sector demand is described and quantified. First, public<br />
sector needs identified through the TAC process are tabulated; next, private sector demand,<br />
based on PDR employment forecasts, is projected. The analysis shows both the scarcity <strong>of</strong><br />
industrial land, and its apparent inability to fulfill the demands placed upon it by both the public<br />
and private sectors. Balancing these demands against other planning considerations, and<br />
managing demand from the public sector side, is a major focus <strong>of</strong> the recommendations<br />
presented in Chapter Four.<br />
2.1 IMPORTANCE OF PDR TO THE DISTRICT ECONOMY<br />
2.1.1 SECTOR ANALYSIS<br />
Production, Distribution & Repair industries are not typically considered a fundamental part <strong>of</strong><br />
the <strong>District</strong>’s total economy. Indeed, their share <strong>of</strong> employment as individual sectors is swamped<br />
by the big core industries such as government, legal services, and pr<strong>of</strong>essional services. DC is,<br />
after all, an <strong>of</strong>fice economy, boasting one <strong>of</strong> the largest inventories <strong>of</strong> downtown <strong>of</strong>fice space in<br />
- 22 -
<strong>District</strong> <strong>of</strong> Columbia Industrial Areas Study DC Office <strong>of</strong> Planning<br />
Prepared by Phillips Preiss Shapiro Associates, Inc.<br />
the nation. However, when considered collectively, the importance <strong>of</strong> DC’s PDR industries is not<br />
as small as normally assumed. In fact, the sectors identified as PDR sectors (based on the<br />
nature <strong>of</strong> the industry and their presence in DC’s industrial zones) account for about 10 percent<br />
<strong>of</strong> total <strong>District</strong> employment, as shown in Table 2.1.<br />
Table 2.1: PDR Employment, <strong>District</strong> <strong>of</strong> Columbia, 2004<br />
Percent Percent<br />
Industry Employment <strong>of</strong> Total <strong>of</strong> PDR<br />
Total Employment<br />
PDR Employment<br />
429,176 100.0%<br />
NAICS 221 Utilities 2,487 0.6% 5.0%<br />
NAICS 236 Construction <strong>of</strong> buildings 4,512 1.1% 9.1%<br />
NAICS 237 Heavy and civil engineering construction 1,858 0.4% 3.7%<br />
NAICS 238 Specialty trade contractors 5,963 1.4% 12.0%<br />
NAICS 311 Food manufacturing 400 0.1% 0.8%<br />
NAICS 315 Apparel manufacturing 18 0.0% 0.0%<br />
NAICS 323 Printing and related support activities 868 0.2% 1.7%<br />
NAICS 324 Petroleum and coal products manufacturing 74 0.0% 0.1%<br />
NAICS 327 Nonmetallic mineral product manufacturing 109 0.0% 0.2%<br />
NAICS 332 Fabricated metal product manufacturing 80 0.0% 0.2%<br />
NAICS 333 Machinery manufacturing 33 0.0% 0.1%<br />
NAICS 334 Computer and electronic product manufacturing 263 0.1% 0.5%<br />
NAICS 336 Transportation equipment manufacturing 50 0.0% 0.1%<br />
NAICS 337 Furniture and related product manufacturing 131 0.0% 0.3%<br />
NAICS 339 Miscellaneous manufacturing 163 0.0% 0.3%<br />
NAICS 423 Merchant wholesalers, durable goods 2,135 0.5% 4.3%<br />
NAICS 424 Merchant wholesalers, nondurable goods 1,871 0.4% 3.8%<br />
NAICS 444 Building material and garden supply stores 760 0.2% 1.5%<br />
NAICS 481 Air transportation 154 0.0% 0.3%<br />
NAICS 483 Water transportation 153 0.0% 0.3%<br />
NAICS 484 Truck transportation 185 0.0% 0.4%<br />
NAICS 485 Transit and ground passenger transportation 1,058 0.2% 2.1%<br />
NAICS 488 Support activities for transportation 138 0.0% 0.3%<br />
NAICS 492 Couriers and messengers 668 0.2% 1.3%<br />
NAICS 511 Publishing industries, except Internet 9,180 2.1% 18.5%<br />
NAICS 512 Motion picture and sound recording industries 1,591 0.4% 3.2%<br />
NAICS 515 Broadcasting, except Internet 4,374 1.0% 8.8%<br />
NAICS 517 Telecommunications 3,232 0.8% 6.5%<br />
NAICS 562 Waste management and remediation services 336 0.1% 0.7%<br />
NAICS 811 Repair and maintenance 875 0.2% 1.8%<br />
NAICS 812 Personal and laundry services 5,915 1.4% 11.9%<br />
Total PDR Employment 49,634 11.6% 100.0%<br />
Source: U.S. Bureau <strong>of</strong> Labor Statistics, Covered Employment & Wages (CEW) Series<br />
- 23 -
<strong>District</strong> <strong>of</strong> Columbia Industrial Areas Study DC Office <strong>of</strong> Planning<br />
Prepared by Phillips Preiss Shapiro Associates, Inc.<br />
Within the PDR industries, the construction trades (NAICS 236, 237 and 238) account for onequarter<br />
(25 percent) <strong>of</strong> PDR employment. The next largest sector is publishing, followed by<br />
Personal and Laundry Services. This indicates that PDR employment in the <strong>District</strong> is largely<br />
driven by the ongoing boom in construction and rehabilitation; as well as industries that are<br />
related to the <strong>District</strong>’s media companies, and support services for the hospitality industries.<br />
Wholesalers, many <strong>of</strong> whom sell to DC-based customers in the hospitality, restaurant, and<br />
entertainment industries, account for about eight percent <strong>of</strong> <strong>District</strong> PDR employment.<br />
Table 2.2: Location Quotients, PDR Industries, <strong>District</strong> <strong>of</strong> Columbia, 2004<br />
Location Quotients<br />
Industry <strong>District</strong> to U.S. <strong>District</strong> to MSA<br />
Total Employment 1.00 1.00<br />
PDR Employment<br />
NAICS 221 Utilities 1.11 1.44<br />
NAICS 236 Construction <strong>of</strong> buildings 0.70 0.52<br />
NAICS 237 Heavy and civil engineering construction 0.52 0.48<br />
NAICS 238 Specialty trade contractors 0.34 0.27<br />
NAICS 311 Food manufacturing 0.07 0.40<br />
NAICS 315 Apparel manufacturing 0.02 0.17<br />
NAICS 323 Printing and related support activities 0.33 0.38<br />
NAICS 324 Petroleum and coal products manufacturing 0.17 0.71<br />
NAICS 327 Nonmetallic mineral product manufacturing 0.06 0.15<br />
NAICS 332 Fabricated metal product manufacturing 0.01 0.10<br />
NAICS 333 Machinery manufacturing 0.01 0.04<br />
NAICS 334 Computer and electronic product manufacturing 0.05 0.08<br />
NAICS 336 Transportation equipment manufacturing 0.01 0.09<br />
NAICS 337 Furniture and related product manufacturing 0.06 0.24<br />
NAICS 339 Miscellaneous manufacturing 0.06 0.38<br />
NAICS 423 Merchant wholesalers, durable goods 0.18 ND<br />
NAICS 424 Merchant wholesalers, nondurable goods 0.24 0.59<br />
NAICS 444 Building material and garden supply stores 0.16 0.18<br />
NAICS 481 Air transportation 0.08 0.05<br />
NAICS 483 Water transportation 0.70 ND<br />
NAICS 484 Truck transportation 0.03 0.09<br />
NAICS 485 Transit and ground passenger transportation 0.71 0.85<br />
NAICS 488 Support activities for transportation 0.07 0.11<br />
NAICS 492 Couriers and messengers 0.30 0.34<br />
NAICS 511 Publishing industries, except Internet 2.56 1.59<br />
NAICS 512 Motion picture and sound recording industries 1.06 1.47<br />
NAICS 515 Broadcasting, except Internet 3.42 2.40<br />
NAICS 517 Telecommunications 0.80 0.49<br />
NAICS 562 Waste management and remediation services 0.26 0.30<br />
NAICS 811 Repair and maintenance 0.18 0.21<br />
NAICS 812 Personal and laundry services 1.18 0.91<br />
Total PDR Employment 0.39 0.56<br />
(ND) Not disclosed<br />
Source: U.S. Bureau <strong>of</strong> Labor Statistics, Covered Employment & Wages (CEW) Series<br />
- 24 -
<strong>District</strong> <strong>of</strong> Columbia Industrial Areas Study DC Office <strong>of</strong> Planning<br />
Prepared by Phillips Preiss Shapiro Associates, Inc.<br />
However, PDR is in general less prevalent in the <strong>District</strong> than is the national norm. Table 2.2<br />
provides Location Quotients for DC’s PDR sectors, using both the national economy and the<br />
Metropolitan Region’s economy as a point <strong>of</strong> comparison. The location quotient is the ratio <strong>of</strong><br />
local employment share to employment share in the reference region economy. Quotients<br />
greater than one indicate specialization; those smaller than one indicate that the industry<br />
accounts for a smaller amount <strong>of</strong> total employment than in the reference region. This analysis<br />
shows that DC only has PDR specializations in media-related companies and Personal and<br />
Laundry services. For this latter industry, the <strong>District</strong> has less <strong>of</strong> a concentration than the region,<br />
supporting findings from interviews that such support services not needing rapid turn-around<br />
times are tending to choose suburban locations for reasons <strong>of</strong> cost and quality and availability <strong>of</strong><br />
space.<br />
In spite <strong>of</strong> assumptions regarding the decline <strong>of</strong> industry, overall PDR employment in the <strong>District</strong><br />
has been steady over the past several years, with declines in some sectors (manufacturing)<br />
being <strong>of</strong>fset by growth in other sectors (construction and warehousing). Interviews suggest that<br />
steady PDR employment is a result <strong>of</strong> the growing stability <strong>of</strong> the <strong>District</strong>’s political environment,<br />
which stemmed the outflow <strong>of</strong> businesses and made the city a more viable option for<br />
businesses considering relocation. The following table provides an overview <strong>of</strong> employment<br />
trends for the past five years by major industry sector. It shows PDR employment increasing<br />
very modestly over this time period, with an overall growth rate slower than the <strong>District</strong> economy<br />
has a whole.<br />
Table 2.3: Employment Change in PDR Industries, <strong>District</strong> <strong>of</strong> Columbia, 1999 – 2004<br />
Employment (000s) Employment Change<br />
Annual %<br />
Absolute Growth<br />
NAICS Industry 1999 2004 (000s) Rate<br />
-- Total Employment 627.4 672.4 45.0 1.40%<br />
31-33 Manufacturing 3.8 2.5 -1.3 -8.03%<br />
23 Construction 9.6 12.3 2.7 5.08%<br />
42 Wholesale Trade 4.3 4.5 0.2 0.91%<br />
22 Utilities 2.5 ND -- --<br />
48-49 Transportation & Warehousing 5.1 3.4 -1.7 -7.79%<br />
51 Information 23.7 23.8 0.1 0.08%<br />
5617 Services to Buildings and Dwellings 12.1 12.4 0.3 0.49%<br />
Total change, PDR Industries 0.3<br />
Source: Prepared by the Department <strong>of</strong> Employment Services Office <strong>of</strong><br />
Labor Market Research and Information<br />
Consistent with findings that most PDR users looking for space in DC’s industrial zones are<br />
looking for small blocks <strong>of</strong> space, an overview <strong>of</strong> PDR sectors by establishment size confirms<br />
- 25 -
<strong>District</strong> <strong>of</strong> Columbia Industrial Areas Study DC Office <strong>of</strong> Planning<br />
Prepared by Phillips Preiss Shapiro Associates, Inc.<br />
that small companies dominate the PDR landscape, with small firms <strong>of</strong> 19 or fewer employees<br />
accounting for 80 percent <strong>of</strong> all PDR establishments.<br />
Percent <strong>of</strong> Establishments<br />
60.00%<br />
50.00%<br />
40.00%<br />
30.00%<br />
20.00%<br />
10.00%<br />
0.00%<br />
Chart 2.1: PDR Establishments by Size, 2003<br />
1-4 5-9 10-19 20-49 50-99 100-<br />
249<br />
Establishment Size<br />
- 26 -<br />
250-<br />
499<br />
500-<br />
999<br />
1000+<br />
Source: U.S. Census Bureau, 2003 County Business Patterns, <strong>District</strong> <strong>of</strong> Columbia<br />
2.1.2 BACKWARD L<strong>IN</strong>KAGES WITH CORE <strong>IN</strong>DUSTRIES<br />
DC’s core industries, such as pr<strong>of</strong>essional services and hospitality, purchase inputs from many<br />
other linked industries, including PDR industries. To address these linkages quantitatively, it is<br />
necessary to know in detail the purchasing patterns <strong>of</strong> core industries as they relate to goods<br />
and services demanded <strong>of</strong> other industries. While no local data set is available, the Bureau <strong>of</strong><br />
Economic Analysis does compile such accounting for the nation as a whole. Known as “Input-<br />
Output” accounts, these I-O tables track what impact an increase in output from a specific<br />
industry has on an array <strong>of</strong> other industries, in terms <strong>of</strong> output, earnings and employment. The<br />
BEA further adjusts these national accounts for specific regions, through a methodology that<br />
uses location quotients, to create regional I-O models. This model is known by the acronym<br />
RIMS, which stands for Regional Input-output Modeling System.
<strong>District</strong> <strong>of</strong> Columbia Industrial Areas Study DC Office <strong>of</strong> Planning<br />
Prepared by Phillips Preiss Shapiro Associates, Inc.<br />
RIMS tables were obtained for the Washington, DC PMSA. The tables provide a matrix<br />
disaggregating the output, earnings and employment impacts that occur across a range <strong>of</strong><br />
industry groups from a change in output in one particular industry. Impacts can be estimated for<br />
20 industry groups. Four <strong>of</strong> these—construction, manufacturing, wholesale trade, and<br />
transportation and warehousing—have been grouped together as PDR industries. In truth, other<br />
PDR industries are aggregated within other groups, but there is no way to separate them out<br />
using the RIMS model. The analysis here should therefore be understood as capturing much,<br />
but not all, potential PDR multiplier impacts.<br />
Table 2.4 shows the PDR-specific employment multipliers for non-PDR, aggregate RIMS<br />
industries. These multipliers represent the sum <strong>of</strong> the individual multipliers for the four PDR<br />
aggregate RIMS industries, and show the employment increase resulting from an addition $1<br />
million in output from the each row industry in the table. They are sorted in descending order.<br />
The table shows that some <strong>of</strong> the “core” industries in the <strong>District</strong> that are most strongly linked<br />
with regional PDR industries include educational services, social assistance, and hospitals.<br />
Pr<strong>of</strong>essional, scientific and technical services; as well as accommodation, are somewhat less<br />
strongly linked.<br />
While Table 2.4 is useful for comparing different industries in terms <strong>of</strong> the strength <strong>of</strong> their links<br />
with PDR industries, the multipliers in isolation do not speak to resulting magnitude <strong>of</strong> impacts.<br />
Output for most <strong>of</strong> these industries in the <strong>District</strong> alone is measured in the hundreds <strong>of</strong> billions<br />
or trillions <strong>of</strong> dollars, not millions; therefore even these modest multipliers can result in big<br />
impacts. To get a better understanding, a case study approach using one core industry—<br />
pr<strong>of</strong>essional, scientific and technical services—has been undertaken to better understand the<br />
magnitude <strong>of</strong> the linkages and the implications for DC’s industrial areas.<br />
Looking first at the existing condition, the Pr<strong>of</strong>essional, Scientific and Technical Services<br />
industry (which includes lawyers and various consultants) had annual gross sales (or output) <strong>of</strong><br />
nearly $18 trillion in the <strong>District</strong> as <strong>of</strong> the 2002 Economic Census. The regional PDR job impact<br />
<strong>of</strong> this industry can be estimated using the RIMS multipliers, as shown in Table 2.5. The table<br />
indicates that DC’s Pr<strong>of</strong>essional, Scientific and Technical Services directly support over 14,000<br />
PDR jobs throughout the region. The number <strong>of</strong> these jobs actually located within the <strong>District</strong> is<br />
unknown. By way <strong>of</strong> comparison, in 2002, the year to which this analysis is benchmarked, total<br />
PDR employment in the <strong>District</strong> in these four industry aggregations was about 31,000.<br />
- 27 -
<strong>District</strong> <strong>of</strong> Columbia Industrial Areas Study DC Office <strong>of</strong> Planning<br />
Prepared by Phillips Preiss Shapiro Associates, Inc.<br />
Table 2.4: PDR Multipliers for Non-PDR Industries, Jobs Created per $1 million in<br />
Additional Output by Industry, Washington PMSA<br />
RIMS Industry Multiplier*<br />
59. Other services* 1.17<br />
51. Educational services 0.98<br />
37. Publishing including s<strong>of</strong>tware 0.95<br />
54. Social assistance 0.93<br />
53. Hospitals and nursing and residential care facilities 0.91<br />
40. Information and data processing services 0.89<br />
55. Performing arts, museums, and related activities 0.81<br />
58. Food services and drinking places 0.81<br />
52. Ambulatory health care services 0.81<br />
42. Securities, commodity contracts, investments 0.81<br />
28. Retail trade 0.80<br />
48. Management <strong>of</strong> companies and enterprises 0.79<br />
56. Amusements, gambling, and recreation 0.78<br />
47. Pr<strong>of</strong>essional, scientific, and technical services 0.77<br />
57. Accommodation 0.77<br />
60. Households 0.73<br />
49. Administrative and support services 0.71<br />
44. Funds, trusts, and other financial vehicles 0.67<br />
41. Federal Reserve banks, credit intermediation and related services 0.61<br />
43. Insurance carriers and related activities 0.48<br />
46. Rental and leasing services and lessors <strong>of</strong> intangible assets 0.43<br />
45. Real estate 0.40<br />
* Includes government enterprises<br />
Source: Bureau <strong>of</strong> Economic Analysis, Regional Input-output Multiplier System<br />
Phillips Preiss Shapiro Associates, Inc.<br />
- 28 -
<strong>District</strong> <strong>of</strong> Columbia Industrial Areas Study DC Office <strong>of</strong> Planning<br />
Prepared by Phillips Preiss Shapiro Associates, Inc.<br />
Table 2.5: Regional PDR Employment Impacts from Existing Output in the Pr<strong>of</strong>essional,<br />
Scientific and Technical Services Industry in the <strong>District</strong> <strong>of</strong> Columbia<br />
- 29 -<br />
Multiplier<br />
PDR Job<br />
Impact Percent<br />
3. Utilities* 0.0295 530 3.7%<br />
4. Construction 0.0647 1,162 8.1%<br />
5. Manufacturing 0.1518 2,727 19.0%<br />
6. Wholesale trade 0.1428 2,566 17.9%<br />
8. Transportation and warehousing* 0.4088 7,345 51.3%<br />
Total 14,331 100.0%<br />
* Includes government enterprises<br />
Source: Bureau <strong>of</strong> Economic Analysis, Regional Input-output Multiplier System<br />
Phillips Preiss Shapiro Associates, Inc.<br />
The Pr<strong>of</strong>essional, Scientific and Technical Services industry is projected to grow significantly<br />
within the region and the <strong>District</strong> in the near future. Employment projections prepared by the<br />
Department <strong>of</strong> Employment indicate a 21 percent increase in employment between 2002 and<br />
2012. Assuming that sales increase linearly with employment (a reasonable assumption, as<br />
worker productivity in pr<strong>of</strong>essional services does not tend to change significantly over time),<br />
sales (i.e. output) within this industry will increase by about $3.8 trillion over the same time<br />
period. The following table details the regional PDR increase <strong>of</strong> this growth.<br />
Table 2.6: Regional PDR Employment Impacts from Projected Growth in the Pr<strong>of</strong>essional,<br />
Scientific and Technical Services Industry in the <strong>District</strong> <strong>of</strong> Columbia<br />
Multiplier<br />
PDR Job<br />
Impact Percent<br />
3. Utilities* 0.0295 111 3.7%<br />
4. Construction 0.0647 244 8.1%<br />
5. Manufacturing 0.1518 573 19.0%<br />
6. Wholesale trade 0.1428 539 17.9%<br />
8. Transportation and warehousing* 0.4088 1,542 51.3%<br />
Total 3,009 100.0%<br />
Source: Bureau <strong>of</strong> Economic Analysis, Regional Input-output Multiplier System<br />
Phillips Preiss Shapiro Associates, Inc.
<strong>District</strong> <strong>of</strong> Columbia Industrial Areas Study DC Office <strong>of</strong> Planning<br />
Prepared by Phillips Preiss Shapiro Associates, Inc.<br />
PDR impacts are but one portion <strong>of</strong> the total impacts <strong>of</strong> this growth. The following table shows<br />
the full regional multiplier impact on all industries (including the Pr<strong>of</strong>essional, Scientific and<br />
Technical Services industry), PDR industries, and non-PDR industries outside <strong>of</strong> the<br />
Pr<strong>of</strong>essional, Scientific and Technical Services industry. The table illustrates that a little less<br />
than half <strong>of</strong> the regional employment impacts associated with growth in the Pr<strong>of</strong>essional,<br />
Scientific and Technical Services industry occur outside <strong>of</strong> the industry itself. Of these jobs,<br />
about 90 percent are non-PDR jobs, while 10 percent are PDR jobs. The implication is that<br />
when the Pr<strong>of</strong>essional, Scientific and Technical Services industry expands, 48 percent <strong>of</strong> the<br />
direct and indirect employment impacts are due to backwards linkages to other industries and<br />
other indirect effects, and 10 percent <strong>of</strong> those impacts are felt within the four PDR industry<br />
groups.<br />
Table 2.7: Total, Non-PDR, and PDR Employment Impacts from Projected Growth in the<br />
Pr<strong>of</strong>essional, Scientific and Technical Services Industry in the <strong>District</strong> <strong>of</strong> Columbia<br />
- 30 -<br />
Jobs Percent<br />
Total new jobs 61,116 100.0%<br />
New jobs within the industry 32,087 52.5%<br />
New jobs outside the industry 29,029 47.5%<br />
New non-PDR jobs outside the industry 26,020 89.6%<br />
Total new PDR jobs 3,009 10.4%<br />
Source: Bureau <strong>of</strong> Economic Analysis, Regional Input-output Multiplier System<br />
Phillips Preiss Shapiro Associates, Inc.<br />
In summary, demand for PDR goods and services increases regionally as growth occurs in the<br />
core industries. Just the projected growth in one industry in the <strong>District</strong> will result in over 3,000<br />
new PDR jobs regionally. This does not even count continued growth in these industries due to<br />
other factors such as population growth, growth in other economic sectors, and ‘export’ trade<br />
with customers outside <strong>of</strong> the region. The challenge for DC will be to capture those segments <strong>of</strong><br />
this growth that can reasonable find space to succeed within the <strong>District</strong>.<br />
2.1.3 IMPORTANCE OF A DC LOCATION<br />
The above analysis shows that PDR businesses collectively contribute significantly to<br />
employment in the <strong>District</strong>; that as a whole they can be expected to exhibit modest growth; and<br />
that they are linked with the <strong>District</strong>’s core industries. However, these facts do not reveal the<br />
true flavor <strong>of</strong> these linkages, and the importance <strong>of</strong> a DC location for key PDR users. Most PDR<br />
users are located in the <strong>District</strong> because <strong>of</strong> a particular relationship with local industries which<br />
form their customer base. Proximity provides them with a competitive advantage, whether its<br />
short delivery times, ease <strong>of</strong> face-to-face interaction, etc.
<strong>District</strong> <strong>of</strong> Columbia Industrial Areas Study DC Office <strong>of</strong> Planning<br />
Prepared by Phillips Preiss Shapiro Associates, Inc.<br />
To better understand these factors, a survey <strong>of</strong> industrial users was undertaken for this study. A<br />
full summary <strong>of</strong> the survey results is included as an appendix. Respondents were directly asked<br />
about their relationship with DC customers and the factors that favor a DC location. The<br />
highlights were as follows:<br />
When asked, three-quarters <strong>of</strong> respondents agreed that their access and proximity to<br />
DC customers is a significant advantage, while only 4 percent disagreed.<br />
A majority <strong>of</strong> 86 percent still want to be operating in the <strong>District</strong> five years from now.<br />
A majority <strong>of</strong> 65 percent achieve half or more <strong>of</strong> their sales from DC customers. For only<br />
14 percent does this share fall below 25 percent.<br />
Nearly 60 percent agreed that their location in DC is an advantage from the standpoint <strong>of</strong><br />
their customers.<br />
Of businesses planning to stay in DC, 38 percent plan to do so due to proximity to their<br />
customers.<br />
Of businesses planning to depart, only 4 percent are doing so because the move will<br />
bring them closer to their customers. Much more important factors for businesses<br />
contemplating a move are the cost <strong>of</strong> land (19 percent) and taxes (20 percent).<br />
Proximity to their customer base in all cases outweighed accessibility to their workforce<br />
for survey respondents.<br />
Clearly, these results further underline the linkage between DC’s PDR businesses and the<br />
purchasing sectors <strong>of</strong> the DC economy. Likely, these relationships are a two-way street: PDR<br />
suppliers benefit from the competitive advantage <strong>of</strong> a DC location, while buyers benefit from<br />
reduced turnaround, lower costs, and/or other advantages that decrease the cost and hassle <strong>of</strong><br />
conducting a business in the <strong>District</strong>.<br />
2.1.4 <strong>IN</strong>TERVIEWS<br />
The data presented above provide an overview <strong>of</strong> trends within PDR industries. For a more<br />
detailed view <strong>of</strong> what particular industries most desire space within the <strong>District</strong>, industrial real<br />
estate brokers and economic development <strong>of</strong>ficials were interviewed. These interviews revealed<br />
that the strongest demand for industrial space today comes from the following types <strong>of</strong> PDR<br />
users:<br />
Food and beverage services: In addition to traditional alcoholic beverage distributors<br />
(required by law to be in the <strong>District</strong>), newer specialty spirit distributors are seeking<br />
space in the <strong>District</strong>. Another source <strong>of</strong> demand are distributors to smaller grocery<br />
stores, hotels, and restaurants, and distributors <strong>of</strong> specialty (e.g., ethnic) foods. This<br />
latter market is particular strong, but also particularly hard to capture, as it is difficult to<br />
meet their requirements. Some are looking for larger sites, 40,000 to 50,000 square<br />
feet; many are looking for space with cold storage, all at a competitive cost. Interviews<br />
- 31 -
<strong>District</strong> <strong>of</strong> Columbia Industrial Areas Study DC Office <strong>of</strong> Planning<br />
Prepared by Phillips Preiss Shapiro Associates, Inc.<br />
with the hospitality industry suggest the food distributors most likely to be in the city are<br />
those distributing the most perishable products—produce, meat, seafood, baked goods.<br />
While the bulk <strong>of</strong> food products delivered to the hospitality industry are provided by<br />
distributors such as US Foods or Sysco (both located outside the <strong>District</strong>), businesses<br />
dealing in products that require frequent delivery are more likely to be located very close<br />
to their customers.<br />
Transportation: This includes all manner <strong>of</strong> auto-related uses, including used auto<br />
dealers; auto/motorcycle service/repair; tow truck companies; limousine companies (fleet<br />
parking); and truck, bus, and auto fleet storage. Since auto repair involves leaving a<br />
prime means <strong>of</strong> transportation at a location for some time, these uses preferentially like<br />
to locate close to places where people live or work, and where alternative transportation<br />
(buses, taxis) is available.<br />
Construction/building services: Demand is typically from small contractors looking for<br />
space for building supplies or staging yards. However, it has been reported that<br />
contractors needing to store heavy equipment on site are <strong>of</strong>ten reluctant to locate in DC<br />
due to the fear <strong>of</strong> vandalism or theft. This underlines the need for greater security in<br />
many <strong>of</strong> DC’s industrial zones.<br />
Telecommunications: The combination <strong>of</strong> the national government, news media, and<br />
large <strong>of</strong>fice economy makes DC a hub for advanced telecommunications. DC’s industrial<br />
zones house satellite dish farms, telco hotels, as well as more mundane<br />
tecommunications equipment storage. Verizon is a notable presence in DC’s industrial<br />
zones.<br />
Waste management services: These services want to be in the <strong>District</strong> to cut down on<br />
transport costs and times. They include trash hauling (truck storage); and transfer<br />
stations. These are high-impact uses, and there is obviously little additional space for<br />
such users outside <strong>of</strong> where they are already found. Attempts to capture more <strong>of</strong> this<br />
sector would undoubtedly meet with NIMBY objections.<br />
Light manufacturing: Some businesses have expressed an interest in locating in the<br />
<strong>District</strong>, looking to the city for free or low cost PDR space for their operations in<br />
exchange for significant job creation. Interviews revealed such interest from a<br />
corrugated cardboard assembly operation and an industrial laundry seeking to serve the<br />
<strong>District</strong>’s hospitality industry.<br />
Among the sectors identified above, the two that appear to be most promising from the<br />
standpoint <strong>of</strong> attracting desirable and employment-generating PDR users are the warehousing,<br />
wholesaling and distribution <strong>of</strong> specialty foods for the hotel and restaurant industries; and<br />
contractors in the building trades. The former is well represented in certain areas such as the<br />
Florida Avenue Wholesale Market; and many hotels and restaurants want the quick delivery <strong>of</strong><br />
perishables that can be provided with a DC location. While the provision <strong>of</strong> perishable wholesale<br />
goods to the hospitality industry is likely to continue, expansion <strong>of</strong> this market will be limited.<br />
Interviews suggest that many hotels’ purchasing decisions are constrained by centralized<br />
purchasing agreements made by their national management companies.<br />
- 32 -
<strong>District</strong> <strong>of</strong> Columbia Industrial Areas Study DC Office <strong>of</strong> Planning<br />
Prepared by Phillips Preiss Shapiro Associates, Inc.<br />
The other area <strong>of</strong> opportunity, the building trades, is scattered throughout DC’s industrial<br />
districts. A greater capture rate could likely be achieved through policies which emphasize<br />
security for businesses with open-air storage, such as in place industrial parks with shared<br />
security and perimeter fencing. In addition, any measure to assure that building trades<br />
businesses fully tap the government construction market will benefit the PDR districts. Most<br />
major construction contracts are awarded to prime contractors who then seek local contractors.<br />
Additional forums to match local building trades contractors with these primes would be<br />
beneficial.<br />
Despite the massive presence <strong>of</strong> the Federal government, this appears to be a limited market<br />
for the <strong>District</strong>’s PDR businesses. In most cases, businesses achieve no advantage in serving<br />
this market by locating in the <strong>District</strong>. Interviews suggest that a very small number <strong>of</strong> contracts<br />
specify a geographic distance from which a good or supply can be sourced. This has happened<br />
in the case <strong>of</strong> security related services and pest control but it is considered rare. The notable<br />
exception is construction in which the prime contractor needs to have a local presence;<br />
however, a local presence can be defined as a corporate <strong>of</strong>fice for the general contractor and<br />
does not necessarily translate into demand for space in the <strong>District</strong>’s industrial areas. In<br />
general, the Federal government has an intentionally national view in its sourcing and no<br />
preference is given to local vendors. Location or proximity can not be considered in evaluation<br />
<strong>of</strong> proposals; vendors are selected on the basis <strong>of</strong> technical and managerial merit, past<br />
performance, and price.<br />
The greatest opportunities for PDR businesses to access the Federal market depend on either<br />
getting certified as an 8(A) business or working on behalf <strong>of</strong> a prime contractor. Approximately<br />
1,600 <strong>of</strong> the 8,000 8(A) businesses nationally are located in the <strong>District</strong>. While most <strong>of</strong> these<br />
businesses are IT-related, there are a couple hundred construction and building trades firms.<br />
While ample assistance is available to help businesses get certified as 8(A) contractors,<br />
interviews with the SBA suggest another barrier to securing government contracts: time and<br />
resources. Anecdotal information suggests that companies hoping to secure such contracts<br />
need to be able to devote a full time person to marketing to the government, a commitment that<br />
many <strong>District</strong> businesses may be unwilling to make. Finding work with primes has been made<br />
easier through the SBA’s introduction <strong>of</strong> Sub-Net, an electronic database <strong>of</strong> subcontracting<br />
opportunities, which should assist PDR businesses link to general contractors doing business<br />
with the Federal government.<br />
The <strong>District</strong> itself represents a significant market for PDR businesses. Particularly with the<br />
passage <strong>of</strong> legislation in July, implemented this past fall, which states that any procurement<br />
under $100,000 must be filled by an SBE on the DC Supply Schedule, opportunities for smaller<br />
<strong>District</strong> PDR businesses are abundant. City procurement <strong>of</strong>ficials estimate that 80 percent <strong>of</strong><br />
the city’s transactions are for under $100,000. Further study should be given to what support<br />
PDR businesses need to become part <strong>of</strong> the DC Supply Schedule.<br />
- 33 -
<strong>District</strong> <strong>of</strong> Columbia Industrial Areas Study DC Office <strong>of</strong> Planning<br />
Prepared by Phillips Preiss Shapiro Associates, Inc.<br />
2.1.5 CONCLUSIONS<br />
These findings collectively paint an interesting picture. PDR sectors in DC are underrepresented<br />
as a share <strong>of</strong> <strong>District</strong> employment, a fact which should come as no surprise. Yet, these sectors<br />
play an important role in supporting other larger sectors in the economy. Contractors support<br />
the local construction and rehabilitation boom that is transforming downtown and<br />
neighborhoods; and specialty food wholesalers play an important role in supplying the<br />
hospitality industry and ethnic markets and restaurants. Media companies whose operations<br />
involve an industrial-component (studios, satellite dish farms, etc.) also find a home in DC’s<br />
industrial zones. Linkages between PDR businesses and purchasing sectors are strong.<br />
Providing support for these sectors to continue operations in the <strong>District</strong> is therefore a legitimate<br />
public policy goal.<br />
2.2 NEED FOR PDR JOBS<br />
The <strong>District</strong> <strong>of</strong> Columbia has no shortage <strong>of</strong> jobs—total employment exceeds the resident labor<br />
force by more than a factor <strong>of</strong> two! Yet, the <strong>District</strong> continues to be beset by high unemployment<br />
rates exceeding those <strong>of</strong> the region by a significant margin. As an example, the 2004<br />
unemployment rate in the <strong>District</strong> was 8.2 percent, compared with 3.7 percent for the<br />
Metropolitan Statistical Area (MSA). Further, the 2004 unemployment rate was at a seven-year<br />
high, coming <strong>of</strong>f a five year period in which the average unemployment rate grew every year,<br />
even as total employment in the district also grew (see Chart 2.2). Intuitively, there is a<br />
mismatch between the types <strong>of</strong> new jobs being created in the <strong>District</strong>, and the skill sets <strong>of</strong> many<br />
<strong>of</strong> DC’s unemployed, and underemployed, residents.<br />
This mismatch can be seen in the most recent occupational projections prepared by the<br />
Department <strong>of</strong> Employment Services. These projections, summarized by major occupational<br />
group, are shown in Table 2.8. They cover the period <strong>of</strong> 2002 to 2012, and are based upon<br />
employment projections by industry converted into occupational projections through the use <strong>of</strong><br />
the Occupational Staffing Matrix published by the Bureau <strong>of</strong> Labor Statistics.<br />
The table shows that the base majority <strong>of</strong> the job growth projected for the <strong>District</strong> will occur in<br />
skilled, white-collar occupations. A full 65 percent <strong>of</strong> the growth will be for management<br />
occupations and pr<strong>of</strong>essional services (attorneys, consultants, etc.). The major source <strong>of</strong> entrylevel<br />
jobs will be in services and sales, which together account for 25 percent <strong>of</strong> new jobs.<br />
However, these occupations tend to pay wages at or below the accepted living wage threshold<br />
for DC, as shown in a subsequent table. PDR-related occupations are highlighted in bold text.<br />
These occupations are projected to account for less than 5 percent <strong>of</strong> future job growth. By far<br />
the biggest gains will be in construction-related jobs, due to the local and regional boom in<br />
residential and commercial construction.<br />
- 34 -
<strong>District</strong> <strong>of</strong> Columbia Industrial Areas Study DC Office <strong>of</strong> Planning<br />
Prepared by Phillips Preiss Shapiro Associates, Inc.<br />
Chart 2.2: Total Employment and Unemployment, <strong>District</strong> <strong>of</strong> Columbia, 2000 – 2004<br />
Employment (000s)<br />
675<br />
670<br />
665<br />
660<br />
655<br />
650<br />
645<br />
640<br />
635<br />
2000 2001 2002 2003 2004<br />
Year<br />
Source: Bureau <strong>of</strong> Labor Statistics<br />
- 35 -<br />
9<br />
8<br />
7<br />
6<br />
5<br />
4<br />
3<br />
2<br />
1<br />
0<br />
Unemployment Rate (%)<br />
Total Employment<br />
Unemployment Rate<br />
Table 2.8: Occupational Projections for the <strong>District</strong> <strong>of</strong> Columbia by Major Occupational<br />
Category, 2002 – 2012<br />
Percent <strong>of</strong> New Jobs<br />
Occupational Group<br />
New<br />
Jobs Percent Cumulative<br />
Total, All Occupations 67,758 100.0%<br />
Management, Business and Financial Occupations 18,480 27.3% 27.3%<br />
Pr<strong>of</strong>essional & Related Services 25,840 38.1% 65.4%<br />
Service Occupations 13,711 20.2% 85.6%<br />
Sales and Related Occupations 3,155 4.7% 90.3%<br />
Office and Administrative Support Occupations 3,399 5.0% 95.3%<br />
Farming, Fishing and Forestry Occupations 14 0.0% 95.3%<br />
Construction and Extraction Occupations 1,994 2.9% 98.3%<br />
Installation, Maintenance, and Repair Occupations 615 0.9% 99.2%<br />
Production Occupations 336 0.5% 99.7%<br />
Transportation and Material Moving Occupations 213 0.3% 100.0%<br />
Source: <strong>District</strong> <strong>of</strong> Columbia Department <strong>of</strong> Employment Services (2005): <strong>District</strong> <strong>of</strong> Columbia<br />
Employment Projections by Industry and Occupation, 2002 – 2012.
<strong>District</strong> <strong>of</strong> Columbia Industrial Areas Study DC Office <strong>of</strong> Planning<br />
Prepared by Phillips Preiss Shapiro Associates, Inc.<br />
Table 2.9: Annual Wages by Occupational Group, <strong>District</strong> <strong>of</strong> Columbia<br />
SOC Occupational Title<br />
- 36 -<br />
10 th Percentile<br />
Annual Wage<br />
Median<br />
Annual<br />
Wage<br />
90 th<br />
Percentile<br />
Annual Wage<br />
00-0000 All Occupations $18,940 $44,440 $107,280<br />
Management, Business & Financial Occupations<br />
11-0000 Management occupations $41,590 $87,590 $144,180<br />
13-0000 Business & financial operations occupations $37,090 $65,280 $106,570<br />
Pr<strong>of</strong>essional & Related Occupations<br />
15-0000 Computer and mathematical occupations $39,180 $68,960 $104,020<br />
17-0000 Architecture and engineering occupations $37,460 $69,890 $111,080<br />
19-0000 Life, physical and social science occupations $36,840 $75,410 $118,810<br />
21-0000 Community and social services occupations $20,950 $36,320 $60,070<br />
23-0000 Legal occupations $34,080 $97,450 $145,600<br />
25-0000 Education, training, and library occupations $21,710 $44,910 $88,330<br />
27-0000 Arts, design, entertainment, sports & media occupations $29,340 $52,850 $88,440<br />
29-0000 Healthcare practitioners & technical occupations $32,270 $52,250 $105,750<br />
Service Occupations<br />
31-0000 Healthcare support occupations $17,510 $25,240 $38,000<br />
33-0000 Protective service occupations $15,120 $35,700 $78,000<br />
35-0000 Food preparation and serving related occupations $13,860 $17,990 $28,860<br />
37-0000 Building and grounds cleaning and maintenance occupations $15,280 $22,300 $29,110<br />
39-0000 Personal care and service occupations $14,630 $21,050 $40,330<br />
Sales and Related Occupations<br />
41-0000 Sales and related occupations $15,710 $26,650 $68,200<br />
Office and Administrative Support Occupations<br />
43-0000 Office and administrative support occupations $21,840 $35,760 $70,020<br />
Construction Occupations<br />
47-0000 Construction and extraction occupations $23,810 $41,040 $62,310<br />
Installation, Maintenance & Repair Occupations<br />
49-0000 Installation, maintenance, and repair occupations $22,970 $40,990 $61,160<br />
Production Occupations<br />
51-0000 Production occupations $15,650 $35,450 $65,340<br />
Transportation & Materials Moving Occupations<br />
53-0000 Transportation and material moving occupations $15,090 $24,730 $43,850<br />
Source: <strong>District</strong> <strong>of</strong> Columbia Department <strong>of</strong> Employment Services (2005): <strong>District</strong> <strong>of</strong> Columbia<br />
Employment Projections by Industry and Occupation, 2002 – 2012.<br />
Table 2.9 shows wage rates for a spectrum <strong>of</strong> occupations. As a useful benchmark, the <strong>District</strong><br />
Council is currently considering a “living wage” ordinance that would set this wage at $11.50 per<br />
hour; this corresponds to an annual income <strong>of</strong> about $23,000. The tables show that three <strong>of</strong> the<br />
PDR occupational categories—construction; installation, maintenance and repair; and<br />
production—have pay scales and exceed this threshold by a significant degree. By contrast,<br />
most service occupations, save those in the security services, are at or below this threshold;
<strong>District</strong> <strong>of</strong> Columbia Industrial Areas Study DC Office <strong>of</strong> Planning<br />
Prepared by Phillips Preiss Shapiro Associates, Inc.<br />
and the average sales occupation is just a little above. The spread in wages in sales<br />
occupations is further broader than most other occupations, as this category encompasses<br />
sales managers as well as clerks and cashiers. As shown by the 10 th percentile wage, entrylevel<br />
sales positions can pay less than $16,000 a year. The 10 th percentile wage for construction<br />
and installation, maintenance and repair occupations is significantly higher. Thus, leaving aside<br />
the important fact that PDR jobs are also generally associated with good benefits and union<br />
representation (something <strong>of</strong>ten lacking in sales and service jobs), PDR jobs provide a level <strong>of</strong><br />
compensation that the <strong>District</strong> should make every effort to retain and expand for its working<br />
families.<br />
Table 2.10: Employment Growth by Education and Training Category<br />
Education & Training Category 2002 2012 Growth<br />
- 37 -<br />
Percent<br />
<strong>of</strong> New<br />
Jobs<br />
Cumulative<br />
Percentage<br />
1 First pr<strong>of</strong>essional degree 52,734 54,800 2,066 3.06% 3.06%<br />
2 Doctoral degree 6,646 8,057 1,411 2.09% 5.14%<br />
3 Master’s degree 32,016 35,220 3,204 4.74% 9.88%<br />
4 BA degree, plus work experience 88,015 99,967 11,952 17.68% 27.56%<br />
5 Bachelor’s degree 136,631 154,930 18,299 27.07% 54.63%<br />
6 Associate degree 29,481 33,471 3,990 5.90% 60.54%<br />
7 Postsecondary vocational training 25,698 28,282 2,584 3.82% 64.36%<br />
8 Work experience in a related occupation 51,487 54,575 3,088 4.57% 68.93%<br />
9 Long-term on-the-job training 30,543 32,975 2,432 3.60% 72.52%<br />
10 Moderate-term on-the-job training 81,494 85,137 3,643 5.39% 77.91%<br />
11 Short-term on-the-job training 189,321 204,252 14,931 22.09% 100.00%<br />
Total 724,066 791,666 67,600 100.00%<br />
Source: <strong>District</strong> <strong>of</strong> Columbia Department <strong>of</strong> Employment Services (2005): <strong>District</strong> <strong>of</strong> Columbia<br />
Employment Projections by Industry and Occupation, 2002 – 2012.<br />
Finally, Table 2.10 shows projected employment growth by the necessary level <strong>of</strong> education and<br />
training necessary for the position. At the lowest end <strong>of</strong> the entry-level job spectrum are those<br />
positions, such as cashiers, that call for only short on-the-job training. Such occupations are<br />
expected to make up over a fifth <strong>of</strong> all new jobs between 2002 and 2012. At the other end <strong>of</strong> the<br />
spectrum are jobs requiring a bachelor’s degree or better—these make up over half <strong>of</strong> new jobs.<br />
PDR jobs such as construction, maintenance and repair typically require technical skills<br />
acquired either through vocational training or medium and long-term on-the-job training.<br />
Collectively, these mid-range occupations in the skills spectrum are projected to account for<br />
about 17 percent <strong>of</strong> new jobs, or 11,700 jobs in total. This is fewer than half <strong>of</strong> the jobs needed
<strong>District</strong> <strong>of</strong> Columbia Industrial Areas Study DC Office <strong>of</strong> Planning<br />
Prepared by Phillips Preiss Shapiro Associates, Inc.<br />
to move the <strong>District</strong>’s 24,000 unemployed residents into productive employment, even if 100<br />
percent <strong>of</strong> these jobs were to be filled by DC residents, not to mention providing opportunities to<br />
underemployed residents. In fact, according to the Industrial Users Survey undertaken for this<br />
report, about 40 percent <strong>of</strong> PDR jobs are held by DC residents.<br />
Under the best <strong>of</strong> circumstances, PDR industries will only account for a fraction <strong>of</strong> DC’s future<br />
job growth. Yet, increasing that fraction could have a significant impact on the range and type <strong>of</strong><br />
job opportunities available to DC residents, particularly jobs which <strong>of</strong>fer career ladders and living<br />
wages. “Growing and Inclusive City” is the organizing theme <strong>of</strong> the <strong>District</strong>’s new<br />
Comprehensive Plan. Economic inclusiveness requires access to meaningful job opportunities<br />
for all <strong>of</strong> DC’s residents, even those without advanced education. PDR jobs can provide these<br />
types <strong>of</strong> opportunities. A strong base <strong>of</strong> PDR employment should be an important part <strong>of</strong> an<br />
array <strong>of</strong> strategies addressing chronic unemployment in the <strong>District</strong>.<br />
2.3 DEVELOPMENT PRESSURES<br />
2.3.1 DISCUSSION OF DEVELOPMENT PRESSURES<br />
Developable land <strong>of</strong> any type is scarce in Washington, DC, and industrial land even more so. As<br />
the <strong>District</strong>’s inventory <strong>of</strong> favorably located development sites is exhausted, the development<br />
community will inevitably hunt for opportunities in areas heret<strong>of</strong>ore considered unsuitable for<br />
residential, commercial, or mixed-use development. Such forces are already at work in DC, as<br />
development pressures are increasingly manifest in formerly bypassed neighborhoods and<br />
other less than prime locations, including the areas zoned for industrial (PDR) use.<br />
In general, real estate pressures in the <strong>District</strong> are extremely high—supply is very limited and<br />
demand has never been greater. In the resultant high-stakes bidding contest, those willing to<br />
pay the most win the land. PDR businesses are at a great competitive disadvantage in a<br />
superheated market because they have limited ability to afford ever-increasing rents. Moreover,<br />
PDR users are unable to compete head-on with traditional “high value” uses such as <strong>of</strong>fice,<br />
retail, and residential, thus putting them at the end <strong>of</strong> the pecking order in the competition for<br />
scarce land. Typical industrial rents in the <strong>District</strong>’s industrial areas, at $5 to $15 per square<br />
foot, compare unfavorably with residential rents <strong>of</strong> $25 to $30, retail rents <strong>of</strong> $25 to $30, and<br />
<strong>of</strong>fice rents <strong>of</strong> $30 to $40 per square foot. In addition, given escalating land prices, typical PDR<br />
businesses cannot compete at all when land is developed for for-sale products such as<br />
condominiums, which <strong>of</strong>ten sell for $550 per square foot compared to an average industrial<br />
sales price rate <strong>of</strong> $100 per square foot. 5 Moreover, most PDR users prefer one or two story<br />
buildings, while <strong>of</strong>fice and residential buildings can be developed in a multistory format,<br />
increasing returns (hence land values) even further. To make planning more difficult, the typical<br />
5 The CoStar Industrial Report, Third Quarter 2005, Washington, DC Industrial Market. The CoStar<br />
Group, 2005.<br />
- 38 -
<strong>District</strong> <strong>of</strong> Columbia Industrial Areas Study DC Office <strong>of</strong> Planning<br />
Prepared by Phillips Preiss Shapiro Associates, Inc.<br />
winning uses, including housing, commercial development, high tech sectors, and municipal<br />
services, are all significant and important in their own right.<br />
Development plans and proposals, mostly in the form <strong>of</strong> housing and related neighborhood<br />
commercial development, as well as from large-scale mixed-use initiatives such as the<br />
Anacostia Waterfront Initiative (AWI), exert significant pressures on all <strong>of</strong> the industrial lands<br />
examined in this study. The AWI itself would reclaim vast stretches <strong>of</strong> the Anacostia Waterfront<br />
for much-needed parks and open space, including now-industrial areas such as 11th Street, SE<br />
(about 74 acres), Water Street, SE (about 37 acres), and portions <strong>of</strong> Benning Road and<br />
Anacostia Poplar Point. Map 2.1 illustrates areas in which large initiative like AWI and specific<br />
proposals such as those noted below will affect industrial areas.<br />
One <strong>of</strong> the most significant proposals to affect the <strong>District</strong>’s industrial areas was the Buzzard<br />
Point / Capitol Gateway initiative, in which a 242-acre industrial area was rezoned from its M<br />
and CM-2 designations to mixed use zones which promote residential and commercial redevelopment.<br />
6 The recent Council decision to locate the new stadium for the Washington<br />
Nationals has greatly increased the pace <strong>of</strong> redevelopment in the area. Of most immediate<br />
issue is that the industrial businesses within the 19-acre footprint <strong>of</strong> the proposed stadium must<br />
be relocated, including a 55,000 square foot waste transfer facility and an 88,000 square foot<br />
asphalt plant. Numerous municipal facilities including a 67,000 square foot WMATA bus lot,<br />
several DPW facilities totaling nearly 47,000 square feet, an 80-100,000 square foot Parks and<br />
Recreation warehouse are also being forced to relocate. While the Capital Gateway Overlay<br />
<strong>District</strong> allows for “continuation <strong>of</strong> existing industrial uses, which are important economic assets<br />
to the city, during the extended period projected for redevelopment,” development plans clearly<br />
do not welcome industrial uses in the Buzzard Point area. 7 Moreover, as developers continue to<br />
assemble land and break ground for adjacent projects, industrial uses are quickly being pushed<br />
out <strong>of</strong> Buzzard Point.<br />
Other known development proposals or initiatives that would necessitate rezoning <strong>of</strong> industrial<br />
land include:<br />
a townhouse development near the Fort Totten Metro (Sub-area: Fort Totten)<br />
a development at Rhode Island Avenue and Reed Street, NE, near the Metro (Sub-area:<br />
CSX 1)<br />
a large residential development <strong>of</strong> about 700 units on Eckington Place near Q Street, NE<br />
(Sub-area: New York Ave/Florida)<br />
6 Because it is no longer industrially-zoned, the Buzzard Point area has been removed from the scope <strong>of</strong> this study,<br />
except ins<strong>of</strong>ar as the study must account for the space needs <strong>of</strong> displaced industrial uses.<br />
7 See <strong>District</strong> <strong>of</strong> Columbia Zoning Commission. 2005. Zoning Commission Case No. 05-10, Capitol Gateway Overlay<br />
<strong>District</strong> Amendments. Attachment 1. Chapter 16, Section 1600.2 (c). November 21.<br />
- 39 -
<strong>District</strong> <strong>of</strong> Columbia Industrial Areas Study DC Office <strong>of</strong> Planning<br />
Prepared by Phillips Preiss Shapiro Associates, Inc.<br />
a redevelopment <strong>of</strong> the Capital City/New York/Florida market to include a mix <strong>of</strong><br />
residential, commercial, hotel, and entertainment space, displacing the market area<br />
north <strong>of</strong> Neal Street (Sub-area: New York Ave/Florida)<br />
A proposed development <strong>of</strong> 3,5000 residential units and 150,000 square feet <strong>of</strong> retail<br />
space for the 16-acre triangular site south <strong>of</strong> New York Avenue, bordered by<br />
Bladensburg Road and Montana Avenue (Sub-area: New York Avenue/Bladensburg)<br />
a 120-unit residential development along New York Avenue, south <strong>of</strong> the railroad tracks,<br />
east <strong>of</strong> Bladensburg (Sub-area: New York Avenue/Bladensburg)<br />
a hotel development parallel to Shannon Place, approximately between V and U Streets,<br />
SE (Sub-area: CSX2 – Anacostia/Fairlawn)<br />
a proposed stadium for the DC United soccer team, and associated mixed-use<br />
development, in Poplar Point (Sub-area: Anacostia Poplar Point)<br />
a proposed Senior’s housing development on what is currently a church parking lot on<br />
Bladensburg Road NE (Sub-area: Bladensburg/Ft. Lincoln)<br />
Table 2.11 shows the amount <strong>of</strong> industrially zoned land that has actually seen a change <strong>of</strong> use<br />
or has been targeted for a change <strong>of</strong> use.<br />
Table 2.11: Actual or Proposed Land Use Changes in Industrial Areas<br />
Name Comments Area (acres)<br />
Ft. Totten site Known proposal/rezoning request 13.8<br />
Rhode Island/Reed St Known proposal/rezoning request 5.3<br />
Eckington Pl. site Known proposal/rezoning request 4.8<br />
NY/Florida Market area Known proposal/rezoning request 36.7<br />
NY-Bladensburg triangular site Known proposal/rezoning request 23.0<br />
NY-Bladensburg, NY Ave site Known proposal/rezoning request 5.5<br />
Anacostia hotel proposal Known proposal/rezoning request 4.6<br />
Subtotal 93.7<br />
Barney Circle Anacostia Waterfron Initative 37.0<br />
Maritime Plaza Anacostia Waterfron Initative 74.0<br />
Buzzard Point Recent rezoning, entire area 242.0<br />
- 40 -<br />
TOTAL 446.7<br />
Thus, the status <strong>of</strong> approximately 94 acres <strong>of</strong> land is now in question due to rezoning requests,<br />
an additional 111 acres may be taken due to AWI, and 242 acres has already been lost in<br />
Buzzard Point.
<strong>District</strong> <strong>of</strong> Columbia Industrial Areas Study DC Office <strong>of</strong> Planning<br />
Prepared by Phillips Preiss Shapiro Associates, Inc.<br />
2.3.2 IRREVERSIBILITY OF ZON<strong>IN</strong>G AND <strong>LAND</strong> USE DECISIONS<br />
In general, housing and commercial development are important to any city’s tax base and ability<br />
to compete in the national and global marketplace. In the <strong>District</strong>, public policy and the private<br />
market have collectively favored these types <strong>of</strong> developments and increased real estate<br />
pressures on industrial land, 8 even though industrial areas play just as important a role in<br />
strengthening and diversifying the <strong>District</strong>. Once industrial land is developed for a non-industrial<br />
use, the return <strong>of</strong> industrial use to the redeveloped property is extremely unlikely. In short, once<br />
industrial land is lost, it is typically lost for good. Moreover, the introduction <strong>of</strong> non-industrial<br />
uses into an industrial area changes the land use context, increasing the likelihood <strong>of</strong> nuisance<br />
complaints, land use and traffic conflicts, and additional rezoning requests.<br />
Similar issues affect the <strong>District</strong>’s municipal space needs. Many municipal and public uses—<br />
vehicle storage and repair, salt storage, bus maintenance and storage, etc.—are industrial or<br />
quasi-industrial in nature. These uses would be difficult to site in a residential or commercial<br />
district due to property owner opposition and potential land use conflicts. Since government<br />
functions are subject to the same zoning requirements and NIMBY pressures as private<br />
enterprise, they are <strong>of</strong>ten driven to the same sites as private PDR users.<br />
For these reasons, <strong>District</strong> government has historically proceeded cautiously with respect to<br />
rezoning its industrial lands for other uses. It must continue to do so. Recognizing that the<br />
decision to rezone an industrial area for non-industrial uses is practically irreversible, this study<br />
urges the <strong>District</strong> to undertake only limited and strategic rezonings and to initiate zoning to<br />
insulate and protect remaining industrial areas from the private property market.<br />
2.4 NEED FOR APPROPRIATE SPACE FOR PUBLIC FUNCTIONS<br />
Municipalities require dedicated, secure areas in which to conduct the business <strong>of</strong> government.<br />
This includes those quasi-industrial functions such as waste hauling and transfer, street<br />
cleaning and plowing, road construction and repair, water and sewer construction and repair,<br />
and police, fire, and parking enforcement services. Cities also need areas to house equipment<br />
and supplies as well as places to store and repair the light and heavy vehicles which service all<br />
corners <strong>of</strong> the city.<br />
Whenever possible, these types <strong>of</strong> quasi-industrial areas must be located within the city’s<br />
jurisdiction, for at least three reasons. First, cities can rarely compete in the suburban land<br />
market, so that finding and purchasing appropriately-zoned land in an outlying jurisdiction is<br />
difficult if not impossible. Second, many government services are important employers <strong>of</strong> city<br />
residents. Government jobs, especially quasi-industrial skilled positions, are well-paying, have<br />
8 For example, ad-hoc rezoning requests remove land from industrial use, and the <strong>District</strong>’s Comprehensive Plan<br />
proposed land use policy map targets some industrial areas for land use change, infill, and/or residential<br />
development.<br />
- 41 -
<strong>District</strong> <strong>of</strong> Columbia Industrial Areas Study DC Office <strong>of</strong> Planning<br />
Prepared by Phillips Preiss Shapiro Associates, Inc.<br />
good security and benefits, and are good areas to learn new skills and trades. Third, most, if not<br />
all, <strong>of</strong> these government functions must be located strategically so that service areas are never<br />
too far away. Response times, travel distances, or turn-around times can be critical in some<br />
situations. Additionally, when government services are inefficient, both constituents and the<br />
bottom line suffer. It can be a significant waste <strong>of</strong> time and money, for example, for a tow truck<br />
and driver, or snowplow, or street sweeper, to be stuck in downtown traffic when a more<br />
strategically located staging area could have been reached sooner.<br />
In this regard, the <strong>District</strong> is <strong>of</strong> course no different than any other city. If anything, given the very<br />
precarious nature <strong>of</strong> the <strong>District</strong>’s fiscal imbalance, well-paying employment <strong>of</strong> city residents and<br />
the optimal location <strong>of</strong> public facilities and efficient use <strong>of</strong> that land is all the more important here<br />
in the nation’s capitol. However, it is becoming more and more difficult to achieve optimal<br />
locations within the <strong>District</strong>, and the demand for city services, due to growth in jobs and<br />
households, continues to increase.<br />
Map 2.2 shows where public facilities are concentrated in industrial areas. Many <strong>of</strong> these needs<br />
are quasi-industrial in nature, and are hard to site. It is generally difficult to site a “locally<br />
unwanted land use” due to pollution, noise, odors and resulting NIMBY (“not in my backyard”)<br />
concerns, but because <strong>District</strong> government is bound by its own zoning, the task <strong>of</strong> locating<br />
appropriate land in a city in which there is already limited supply becomes monumental.<br />
To better understand the space needs <strong>of</strong> the <strong>District</strong> government, a Technical Advisory<br />
Committee comprised <strong>of</strong> representatives <strong>of</strong> <strong>District</strong> agencies, the Federal Government, and<br />
public authorities such as the Washington Metropolitan Area Transit Authority (WMATA) and<br />
Washington Area Sewer Authority (WASA) was convened. The purpose <strong>of</strong> the TAC was to<br />
identify pressing needs; brainstorm solutions; and test recommendations for addressing the<br />
identified needs. From the TAC process, it is estimated that immediate public sector space<br />
needs amount to about 70 acres (see Table 2.12).<br />
TAC participants also reported on short and medium-term space needs. Only some could give<br />
reasonable estimates, which amount to 65 acres for two agencies alone (25 or more acres for<br />
WMATA and 40 acres for the Architect <strong>of</strong> the Capitol). Many agencies related their mediumterm<br />
relocation or consolidation plans, including:<br />
WMATA (Washington Metropolitan Area Transportation Authority)<br />
Replacement for 133-bus Western Garage, 8.5 acres<br />
New 150 – 200 bus garage to accommodate system expansion, 8.5 – 11.3 acres<br />
Two light rail yards at Anacostia Station and northern terminus, 3 – 5 acres each<br />
Department <strong>of</strong> Public Works<br />
Scattered impoundment “staging” areas, strategically located in the <strong>District</strong>, allowing<br />
DPW to avoid rush hour downtown traffic as they tow vehicles.<br />
- 42 -
<strong>District</strong> <strong>of</strong> Columbia Industrial Areas Study DC Office <strong>of</strong> Planning<br />
Prepared by Phillips Preiss Shapiro Associates, Inc.<br />
DPW is currently planning a consolidation <strong>of</strong> functions at West Virginia Avenue, which<br />
may free up space elsewhere<br />
Architect <strong>of</strong> the Capitol<br />
While not a <strong>District</strong> agency, its support to the federal government is critical. 20 acres are<br />
needed for support services, including contractor staging and secure storage.<br />
Department <strong>of</strong> Transportation<br />
Reducing footprint at 1403 W Street (street & bridge maintenance storage facility), but<br />
targeting a large headquarters facility in the Anacostia Gateway project.<br />
1338 G Street NE (City Street Sign Shop) & 2000 14th Street NW (Administrative<br />
Planning & Traffic Operations) will be relocating to Anacostia Gateway<br />
New materials testing facility at 4901 Shepard Parkway<br />
Vacating 350 & 400 McMillan Drive<br />
Table 2.12: Immediate Public Sector Space Needs<br />
Agency Need Building SF FAR Land Area<br />
DCPD Evidence warehouse 200,000 1 4.59<br />
DC Parks & Rec Warehouse/workspace Undetermined NA NA<br />
DDOT Urban forestry -- -- 2<br />
DPW Parking near Ward 3 -- -- 5<br />
DPW Displacement -- -- 12.8<br />
Architect <strong>of</strong> the Capitol Various -- -- 10<br />
WASA Storm sewer maint. fac. -- -- 10<br />
WASA Fleet operations -- -- 4<br />
WASA Pumping, access -- -- 4<br />
WMATA Bus garage, 120 buses -- -- 11.1<br />
DCRA Storage for 20 vehicles -- -- 0.25<br />
NPS Heliports (2) -- -- 0.5<br />
FEMS Fleet maintenance -- -- 2.5<br />
Total land area 66.74<br />
Source: Technical Advisory Committee<br />
The implications <strong>of</strong> these immediate and future space needs are enormous. The existing limited<br />
supply <strong>of</strong> appropriate industrial land should be protected. If <strong>District</strong>, WMATA, or other services<br />
had to move outside <strong>of</strong> the <strong>District</strong>, their response times, efficiency, and cost <strong>of</strong> operation would<br />
surely increase. Existing agency plans (DDOT, DPW) will create new co-location opportunities,<br />
however. This should alleviate some <strong>of</strong> the pressure for industrial land, freeing up space for<br />
other municipal agencies or, hopefully, new or expanding PDR businesses.<br />
2.5 NEED TO ACCOMMODATE PROJECTED EMPLOYMENT GROWTH<br />
In addition to public space needs, additional industrial space would be needed to accommodate<br />
the projected growth in employment in PDR sectors. As described above, the growth in the<br />
- 43 -
<strong>District</strong> <strong>of</strong> Columbia Industrial Areas Study DC Office <strong>of</strong> Planning<br />
Prepared by Phillips Preiss Shapiro Associates, Inc.<br />
<strong>District</strong>’s PDR sectors is driven largely by growth in its core industries, and if the <strong>District</strong>’s<br />
economy is to continue to strengthen, it should be assumed that demand for the PDR users that<br />
service those core sectors will strengthen as well. A rough estimate <strong>of</strong> how much space would<br />
be needed can be made through the use <strong>of</strong> standard square foot multipliers that are based on<br />
the average floor space per employee for prototypical uses such as warehousing. The results <strong>of</strong><br />
such a projection are shown below in Table 2.13.<br />
Based on this projection, DC would need to absorb about 1.6 million square feet <strong>of</strong> industrial<br />
space to accommodate this projected growth. Some <strong>of</strong> this space would be absorbed in existing<br />
vacant buildings, but much would require new construction. An accounting <strong>of</strong> how much land<br />
this would require is given in Table 2.14.<br />
Table 2.13: Projected Private Sector Space Needs, 2002 – 2012<br />
Occupation Jobs Space type SF/Employee Square Feet<br />
Construction and Extraction<br />
Occupations (Part)* 199 Industrial 500 99,700<br />
Installation, Maintenance, and<br />
Repair Occupations 615 Industrial 500 307,500<br />
Production Occupations 336 Industrial 500 168,000<br />
Transportation and Material<br />
Moving Occupations 213 Warehousing 5,000 1,065,000<br />
Total 1,640,200<br />
* It is projected that only 10 percent <strong>of</strong> construction employment will be at fixed locations, i.e., 90<br />
percent will be located at job sites, and therefore will not translate into industrial space.<br />
Source: Phillips Preiss Shapiro Associates, Inc.<br />
<strong>District</strong> <strong>of</strong> Columbia Department <strong>of</strong> Employment Services (2005): <strong>District</strong> <strong>of</strong> Columbia Employment<br />
Projections by Industry and Occupation, 2002 – 2012.<br />
Table 2.14: Projected Net Absorption and Private Industrial Land Needs<br />
Total space need (SF) 1,600,000<br />
Less recent construction 25,000<br />
Less vacant warehouse space 550,000<br />
Net space need (SF) 1,025,000<br />
Floor Area Ratio 0.75<br />
Land area (acres) 31<br />
Source: Phillips Preiss Shapiro Associates, Inc.<br />
Therefore, in addition to the public sector needs described above, the private sector<br />
conservatively will need approximately 31 acres <strong>of</strong> developable land to accommodate the<br />
amount <strong>of</strong> projected future growth. In total, public and private space needs will require up to 100<br />
or more acres <strong>of</strong> developable industrial land just to meet short term public and medium term<br />
- 44 -
<strong>District</strong> <strong>of</strong> Columbia Industrial Areas Study DC Office <strong>of</strong> Planning<br />
Prepared by Phillips Preiss Shapiro Associates, Inc.<br />
private, identified space needs. As the following section will show, this figure exceeds<br />
immediately available supply by a significant margin.<br />
Not all <strong>of</strong> the space needed by private industry will be traditional warehousing space. Although a<br />
precise prediction <strong>of</strong> the types <strong>of</strong> space needed is not possible, one clue is to look at the<br />
existing space needs <strong>of</strong> PDR businesses. Businesses surveyed as part <strong>of</strong> the Industrial Users<br />
Survey were asked about their current use <strong>of</strong> space. The results are summarized below in Table<br />
2.15. The table illustrates the diversity <strong>of</strong> space requirements for these businesses, and<br />
therefore the need for flexible planning and zoning to accommodate these needs.<br />
Type <strong>of</strong> Space<br />
Table 2.15: Existing Uses <strong>of</strong> Space<br />
Proportion <strong>of</strong><br />
space in<br />
respondent’s<br />
buildings<br />
Industrial 22.5% 24.0%<br />
Flex/R&D 2.0% 2.2%<br />
Warehouse 37.4% 43.7%<br />
Showroom 4.1% 1.0%<br />
Office 19.1% 14.7%<br />
Manufacturing 8.2% 14.4%<br />
Totals 93.4% 100.0%<br />
- 45 -<br />
Estimated<br />
proportion <strong>of</strong><br />
space adjusted<br />
by building size<br />
Source: Industrial Users Survey, Office <strong>of</strong> Planning, Phillips Preiss Shapiro Associates, Inc.<br />
2.6 LIMITED SUPPLY OF <strong><strong>IN</strong>DUSTRIAL</strong> <strong>LAND</strong><br />
2.6.1 CHARACTERISTICS<br />
Industrially-zoned lands are the only areas where the <strong>District</strong>’s zoning allows PDR activities.<br />
Ideally, these areas contain the certain types <strong>of</strong> land and buildings that PDR sectors such as<br />
light manufacturing, processing, fabricating, or repair establishments, wholesale or storage<br />
facilities, repair garages, construction and building services, industrial uses for roadway and<br />
transportation, carting and hauling, and warehouse storage facilities require.<br />
PDR uses require access to excellent transportation infrastructure, including road, rail, and<br />
water transport, both to receive supplies and distribute goods. Roads built to handle heavily<br />
loaded trucks and capable <strong>of</strong> accommodating wide turning radii are almost universally required.<br />
Moreover, these sites must be accessible 24 hours per day, in order to access customers and<br />
receive shipments from suppliers. Good transportation helps ensure reliable supply, reduce time<br />
to market and thus reduce costs and maintains competitive businesses. Asphalt and concrete
<strong>District</strong> <strong>of</strong> Columbia Industrial Areas Study DC Office <strong>of</strong> Planning<br />
Prepared by Phillips Preiss Shapiro Associates, Inc.<br />
suppliers, for example, must be within close proximity <strong>of</strong> building sites, generally 30 minutes and<br />
no more than 60 minutes for asphalt (asphalt must be in place and worked within 90 minutes). 9<br />
PDR uses may also require special utility infrastructure, such as minimum 6-inch water lines<br />
and 440-volt power.<br />
Parcel and building size is also critical. A majority <strong>of</strong> PDR uses require parcels large enough to<br />
accommodate truck staging and maneuvering, employee parking, and materials storage. Large<br />
and open building floorplates are critical for shipping and warehousing businesses, many <strong>of</strong><br />
whom prefer larger loading bays and higher ceilings that ever before.<br />
In addition to accessibility and special infrastructure, PDR businesses seek areas where they<br />
can operate without negative external effects on neighboring properties, particularly residences<br />
and schools. Constant truck traffic, noise, dust, odors, hazardous materials, and outdoor<br />
storage areas increase the likelihood <strong>of</strong> nuisance complaints, land use and traffic conflicts, and<br />
additional rezoning requests. Any combination <strong>of</strong> these factors can hinder their operations and<br />
force them to move in response to such complaints.<br />
A lack <strong>of</strong> any <strong>of</strong> these characteristics would most likely increase the cost <strong>of</strong> doing business for<br />
these firms and possibly necessitate a change in business location.<br />
2.6.2 SUPPLY OF <strong><strong>IN</strong>DUSTRIAL</strong> <strong>LAND</strong><br />
Considering the factors above, one can imagine that there are few places in a dense global city<br />
such as Washington, DC that PDR businesses can operate efficiently. Indeed, the <strong>District</strong> has a<br />
constrained supply <strong>of</strong> industrially-zoned land.<br />
The Study Areas Map shows how the <strong>District</strong>’s industrially-zoned land is concentrated in a few<br />
specific areas, primarily concentrated along several historic rail corridors:<br />
The B&O branches in Northeast<br />
o one route running approximately north from Union Station through Fort Totten to<br />
Takoma at the Maryland border (today this is an active CSX freight and Metro<br />
corridor);<br />
o another route branching <strong>of</strong>f and running approximately east paralleling New York<br />
Avenue to the Maryland border (today this is a CSX freight and Amtrak corridor);<br />
o a final route which branches <strong>of</strong>f the New York corridor to roughly parallel<br />
Bladensburg Road northeast into Maryland (today is this a CSX freight corridor);<br />
9 Though normal asphalt is time-dependent, “hot mix asphalt” is maintained at working temperature during<br />
transport. However, hot mix is <strong>of</strong>ten not feasible, as it is almost double the cost <strong>of</strong> normal asphalt.<br />
- 46 -
<strong>District</strong> <strong>of</strong> Columbia Industrial Areas Study DC Office <strong>of</strong> Planning<br />
Prepared by Phillips Preiss Shapiro Associates, Inc.<br />
A B&O route along the eastern shore <strong>of</strong> the Anacostia River, paralleling Minnesota<br />
Avenue for much <strong>of</strong> its route (today this is both a CSX freight and Metro corridor, and<br />
may host a portion <strong>of</strong> a proposed light rail line);<br />
The Baltimore and Potomac Railroad line, which runs through the Southeast and<br />
spurred the development <strong>of</strong> industrial land in the Buzzard Point and Navy Yard areas,<br />
and continues east through 11th Street, SE and Water Street, SE before crossing the<br />
Anacostia and joining the B&O near Minnesota Avenue and E Street, SE (today this is a<br />
CSX freight corridor, and may host a portion <strong>of</strong> a proposed light rail line).<br />
Residential areas appear just beyond these railroad-hugging industrial lands; today’s land use<br />
mix is still reflective <strong>of</strong> this close proximity <strong>of</strong> industrial and residential uses. The area <strong>of</strong><br />
Buzzard Point just east <strong>of</strong> South Capitol Street and west <strong>of</strong> the Navy Yard is one <strong>of</strong> the few<br />
areas that saw industrial development exclusively in the 1900s, though even that began as an<br />
area <strong>of</strong> mixed residential and industrial uses. Machine works, lumberyards, warehouses, and<br />
wholesale food stores dominated this area, and many <strong>of</strong> those buildings remain standing<br />
today. 10<br />
Table 2.16 below shows the total amount <strong>of</strong> industrial land in the <strong>District</strong> by sub-area. Including<br />
land that is zoned for non-PDR uses, the areas examined by this study total only 2,390 acres,<br />
which represents just over five percent <strong>of</strong> the <strong>District</strong>’s total 43,850 acres <strong>of</strong> land area (including<br />
Federal land inside the <strong>District</strong>). The combined total <strong>of</strong> DC Village and Blue Plains represents<br />
the largest area, although only the eastern half, DC Village, is practically available for industrial<br />
development (Blue Plains is a secure limited-access area containing the <strong>District</strong>’s wastewater<br />
treatment plant). The next largest areas are concentrated along the CSX rail corridors and New<br />
York Avenue area.<br />
10 For more information on the industrial history <strong>of</strong> the <strong>District</strong> and architecturally significant industrial buildings, see<br />
Traceries. 1992. DC Warehouse Survey Phase II Final Report. Prepared for the DC Historic Preservation Division.<br />
Washington, DC. July.<br />
- 47 -
<strong>District</strong> <strong>of</strong> Columbia Industrial Areas Study DC Office <strong>of</strong> Planning<br />
Prepared by Phillips Preiss Shapiro Associates, Inc.<br />
Table 2.16: Total Land in Study Areas<br />
Industrial Sub-Area Name Area (sq. ft.) Area (acres) Percent<br />
Anacostia Poplar Point 2,613,191.70 59.99 2.51%<br />
Barney Circle 1,611,922.14 37.00 1.55%<br />
Benning Road 4,349,973.77 99.86 4.18%<br />
Bladensburg/Fort Lincoln 1,434,427.76 32.93 1.38%<br />
CSX1 7,292,689.71 167.42 7.00%<br />
CSX1 - Brookland 2,410,402.65 55.34 2.31%<br />
CSX1 - Fort Totten 4,311,220.68 98.97 4.14%<br />
CSX1 - Lamond Riggs 5,481,600.75 125.84 5.26%<br />
CSX1 NY/NOMA 3,324,665.54 76.32 3.19%<br />
CSX2 - Anacostia/Fairlawn 1,027,331.94 23.58 0.99%<br />
CSX2 - Anacostia/Fairlawn 2,277,047.91 52.27 2.19%<br />
CSX2 - Kennilworth 6,884,158.83 158.04 6.61%<br />
DC Village/Blue Plains 16,789,896.54 385.44 16.13%<br />
Fort Lincoln Urban Renewal 4,002,333.08 91.88 3.84%<br />
Maritime Plaza 3,219,500.77 73.91 3.09%<br />
New York Avenue/Bladensburg 15,163,065.09 348.10 14.56%<br />
New York Avenue/Florida 8,569,489.60 196.73 8.23%<br />
New York Avenue/Ivy City 10,861,042.03 249.34 10.43%<br />
Scattered Site 1 487,513.02 11.19 0.47%<br />
Scattered Site 2 456,683.99 10.48 0.44%<br />
Scattered Site 3 819,444.16 18.81 0.79%<br />
Scattered Site 4 52,156.61 1.20 0.05%<br />
Scattered Site 5 122,402.75 2.81 0.12%<br />
Scattered Site 6 560,003.23 12.86 0.54%<br />
TOTAL <strong><strong>IN</strong>DUSTRIAL</strong> <strong>LAND</strong> 104,122,164.27 2,390.32 100.00%<br />
Source: Office <strong>of</strong> Planning, 2005<br />
But the actual amount <strong>of</strong> land on which industrial development is permitted as <strong>of</strong> right is even<br />
smaller. Table 2.17 shows that the existing zoning within these areas serves to reduce by 386<br />
acres the actual supply <strong>of</strong> as-<strong>of</strong>-right industrial land. Within the 2,390 acres <strong>of</strong> our study area,<br />
the industrial C-M, M, and W Zones comprise a total <strong>of</strong> 2,026 acres, and make up only about<br />
five percent <strong>of</strong> total <strong>District</strong> land. 11 Compared to other major American cities, this percentage is<br />
a very small—San Francisco’s industrial lands comprise 14 percent <strong>of</strong> its total land area, and<br />
even that is considered small by Bay-area analysts.<br />
11 W Zones also permit industrial uses as-<strong>of</strong>-right, but are not prevalent in the <strong>District</strong>. In this study, they<br />
appear only in Anacostia Poplar Point and total only 22 acres.<br />
- 48 -
<strong>District</strong> <strong>of</strong> Columbia Industrial Areas Study DC Office <strong>of</strong> Planning<br />
Prepared by Phillips Preiss Shapiro Associates, Inc.<br />
Table 2.17: Zoning in Sub-Areas<br />
Name Zone Area (sq.ft) Area (acres)<br />
Anacostia Poplar Point C-2-A 3,734.20 0.09<br />
Anacostia Poplar Point C-M-1 1,135,566.53 26.07<br />
Anacostia Poplar Point GOV 419,867.84 9.64<br />
Anacostia Poplar Point R-5-A 86,819.11 1.99<br />
Anacostia Poplar Point W-3 967,201.90 22.20<br />
2,613,189.57 59.99<br />
Water Street, SE C-M-1 1,611,922.14 37.00<br />
Benning Road C-M-1 2,940,072.60 67.49<br />
Benning Road M 1,409,901.17 32.37<br />
4,349,973.77 99.86<br />
Bladensburg/Fort Lincoln C-M-1 962,873.98 22.10<br />
Bladensburg/Fort Lincoln GOV 81,991.48 1.88<br />
Bladensburg/Fort Lincoln R-1-B 389,562.31 8.94<br />
1,434,427.76 32.93<br />
CSX1 C-2-C 243,843.11 5.60<br />
CSX1 C-3-A 129,191.43 2.97<br />
CSX1 C-M-1 533,886.94 12.26<br />
CSX1 C-M-2 2,424,258.57 55.65<br />
CSX1 M 3,742,943.80 85.93<br />
CSX1 R-2 141,342.68 3.24<br />
CSX1 R-5-A 42,097.59 0.97<br />
CSX1 R-5-D 35,128.10 0.81<br />
7,292,692.22 167.42<br />
CSX1 - Brookland C-M-1 2,410,402.65 55.34<br />
CSX1 - Fort Totten C-M-1<br />
FT/C-3-<br />
31,565.26 0.72<br />
CSX1 - Fort Totten<br />
A<br />
FT/C-<br />
691,227.62 15.87<br />
CSX1 - Fort Totten<br />
M-1 886,558.68 20.35<br />
CSX1 - Fort Totten FT/M 1,689,999.26 38.80<br />
CSX1 - Fort Totten GOV 343,218.03 7.88<br />
CSX1 - Fort Totten R-2 191,455.20 4.40<br />
CSX1 - Fort Totten R-5-A 477,196.42 10.95<br />
4,311,220.48 98.97<br />
CSX1 - Lamond Riggs C-1 207,000.40 4.75<br />
CSX1 - Lamond Riggs C-2-A 727,478.86 16.70<br />
CSX1 - Lamond Riggs C-M-1 3,763,482.73 86.40<br />
CSX1 - Lamond Riggs GOV 46,101.83 1.06<br />
- 49 -
<strong>District</strong> <strong>of</strong> Columbia Industrial Areas Study DC Office <strong>of</strong> Planning<br />
Prepared by Phillips Preiss Shapiro Associates, Inc.<br />
CSX1 - Lamond Riggs R-1-B 299,925.59 6.89<br />
CSX1 - Lamond Riggs R-2 65,218.53 1.50<br />
CSX1 - Lamond Riggs R-5-A 372,398.99 8.55<br />
5,481,606.93 125.84<br />
CSX1 NY/NOMA C-2-B 41,742.44 0.96<br />
CSX1 NY/NOMA C-3-C 409,856.96 9.41<br />
CSX1 NY/NOMA C-M-1 494,892.29 11.36<br />
CSX1 NY/NOMA C-M-3 2,310,964.13 53.05<br />
CSX1 NY/NOMA R-4 67,216.87 1.54<br />
3,324,672.69 76.32<br />
CSX2 - Anacostia/Fairlawn C-2-A 164,378.99 3.77<br />
CSX2 - Anacostia/Fairlawn C-M-1 798,079.34 18.32<br />
CSX2 - Anacostia/Fairlawn GOV 1,614,188.24 37.06<br />
CSX2 - Anacostia/Fairlawn R-2 82,514.14 1.89<br />
CSX2 - Anacostia/Fairlawn R-3 90,097.48 2.07<br />
CSX2 - Anacostia/Fairlawn R-5-A 555,116.37 12.74<br />
3,304,374.55 75.86<br />
CSX2 - Kennilworth C-3-A 695,247.00 15.96<br />
CSX2 - Kennilworth C-M-1 5,701,470.90 130.89<br />
CSX2 - Kennilworth GOV 184,956.27 4.25<br />
CSX2 - Kennilworth R-3 108,416.98 2.49<br />
CSX2 - Kennilworth R-5-A 194,062.53 4.46<br />
6,884,153.68 158.04<br />
DC Village/Blue Plains C-M-1 8,777,504.65 201.50<br />
DC Village/Blue Plains C-M-3 8,012,391.89 183.94<br />
16,789,896.54 385.44<br />
Fort Lincoln Urban Renewal C-2-B 2,225,010.65 51.08<br />
Fort Lincoln Urban Renewal GOV 119,124.19 2.73<br />
Fort Lincoln Urban Renewal R-5-D 964,383.52 22.14<br />
Fort Lincoln Urban Renewal SP-2 693,810.71 15.93<br />
4,002,329.07 91.88<br />
11th Street, SE C-M-1 1,601,917.38 36.77<br />
11th Street, SE C-M-2 421,478.00 9.68<br />
11th Street, SE M 1,196,106.17 27.46<br />
3,219,501.54 73.91<br />
New York Avenue/Bladensburg C-2-A 4,334.79 0.10<br />
New York Avenue/Bladensburg C-M-1 8,215,877.22 188.61<br />
New York Avenue/Bladensburg C-M-2<br />
LO/C-<br />
3,240,159.35 74.38<br />
New York Avenue/Bladensburg M-1 554,750.39 12.74<br />
New York Avenue/Bladensburg M 2,884,184.10 66.21<br />
New York Avenue/Bladensburg R-1-B 263,758.85 6.06<br />
15,163,064.71 348.10<br />
- 50 -
<strong>District</strong> <strong>of</strong> Columbia Industrial Areas Study DC Office <strong>of</strong> Planning<br />
Prepared by Phillips Preiss Shapiro Associates, Inc.<br />
New York Avenue/Florida C-M-1 2,289,626.36 52.56<br />
New York Avenue/Florida C-M-2 779,091.81 17.89<br />
New York Avenue/Florida GOV 918,178.27 21.08<br />
New York Avenue/Florida M 4,582,597.92 105.20<br />
8,569,494.36 196.73<br />
New York Avenue/Ivy City C-M-1 2,442,309.65 56.07<br />
New York Avenue/Ivy City C-M-2 1,255,390.09 28.82<br />
New York Avenue/Ivy City GOV<br />
LO/C-<br />
301,453.52 6.92<br />
New York Avenue/Ivy City<br />
M-1 260,987.86 5.99<br />
New York Avenue/Ivy City M 5,435,595.59 124.78<br />
New York Avenue/Ivy City R-4 1,165,301.61 26.75<br />
10,861,038.32 249.34<br />
Scattered Site 1 C-M-1 487,513.02 11.19<br />
Scattered Site 2 C-M-1 456,683.99 10.48<br />
Scattered Site 3 C-M-2 123,495.99 2.84<br />
Scattered Site 3 C-M-3 695,948.17 15.98<br />
Scattered Site 4 C-M-1 52,156.61 1.20<br />
Scattered Site 5 C-M-1 122,402.75 2.81<br />
Scattered Site 6 C-M-1 560,003.23 12.86<br />
2,498,203.77 57.35<br />
Source: DC Office <strong>of</strong> Planning, 2005<br />
- 51 -<br />
Total Area: 2,390.32<br />
Total zoned C-M or M: 2,004.06<br />
The predominance <strong>of</strong> CSX rail lines within the largest industrial areas limits the amount <strong>of</strong><br />
buildable land even further. Roads, streets, alleys, other right-<strong>of</strong>-ways reduce lot sizes and<br />
building footprints elsewhere. New York Avenue/Bladensburg, for example, is the second<br />
largest sub-area, totaling 328 acres, but 22 percent <strong>of</strong> it, about 77 acres, is park, road, or<br />
railroad/transportation right-<strong>of</strong>-way. Table 2.18 shows the land coverage <strong>of</strong> industrial sub-areas.
<strong>District</strong> <strong>of</strong> Columbia Industrial Areas Study DC Office <strong>of</strong> Planning<br />
Prepared by Phillips Preiss Shapiro Associates, Inc.<br />
Land Use<br />
Anacostia/<br />
Poplar Point<br />
Water<br />
Street,<br />
SE<br />
Table 2.18: Land Coverage <strong>of</strong> Industrial Sub-Areas<br />
Benning<br />
Road<br />
- 52 -<br />
Bladensburg/Fort<br />
Lincoln<br />
Buzzard<br />
Point<br />
CSX1<br />
CSX<br />
Anacostia/<br />
Fairlawn<br />
CSX1/<br />
Brookland<br />
CSX1/Fort<br />
Totten<br />
CSX2/<br />
Kenilworth<br />
Undetermined 1.015 0.307 0.300 0.112 0.163<br />
Percent 1.76% 0.00% 0.00% 0.93% 0.12% 0.07% 0.00% 0.00% 0.00% 0.10%<br />
Alleys 0.009 0.093 0.215 1.912 1.684 0.739 0.623 0.518 1.059<br />
Percent 0.00% 0.02% 0.09% 0.65% 0.79% 1.01% 0.97% 1.13% 0.52% 0.67%<br />
Commercial 8.024 2.720 6.077 54.143 43.629 3.131 5.655 7.170 9.566<br />
Percent 13.91% 0.00% 2.72% 18.46% 22.39% 26.07% 4.13% 10.22% 7.25% 6.06%<br />
Federal Public 4.780 12.876<br />
Percent 0.00% 0.00% 0.00% 0.00% 1.98% 7.69% 0.00% 0.00% 0.00% 0.00%<br />
High Density Residential 0.312<br />
Percent 0.00% 0.00% 0.00% 0.00% 0.00% 0.19% 0.00% 0.00% 0.00% 0.00%<br />
Industrial 2.779 4.951 41.143 34.898 3.392 14.834 40.596 8.480<br />
Percent 4.82% 0.00% 0.00% 15.04% 17.01% 20.85% 4.47% 26.82% 41.04% 5.37%<br />
Lake 0.036<br />
Percent 0.00% 0.00% 0.04% 0.00% 0.00% 0.00% 0.00% 0.00% 0.00% 0.00%<br />
Low Density Residential 0.000 2.074 0.063 0.000 1.892 0.264<br />
Percent 0.00% 0.00% 0.00% 6.30% 0.03% 0.00% 2.49% 0.00% 0.00% 0.17%<br />
Low-Medium Density<br />
Residential 0.273 2.151 2.468 1.995 0.370 0.013<br />
Percent 0.00% 0.00% 0.00% 0.83% 0.89% 1.47% 2.63% 0.67% 0.00% 0.01%<br />
Local Public 0.226 0.282 15.991 0.324 1.548 8.733<br />
Percent 0.39% 0.00% 0.28% 0.00% 6.61% 0.19% 0.00% 2.80% 8.83% 0.00%<br />
Medium Density<br />
Residential 0.004 0.366 0.087 1.994 0.313<br />
Percent 0.00% 0.00% 0.00% 0.00% 0.00% 0.22% 0.11% 0.00% 2.02% 0.20%<br />
Median 1.664 0.843 0.216 0.101 0.154 0.106 0.031 0.021 0.242 1.364<br />
Mixed Use<br />
Percent 2.88% 2.28% 0.22% 0.31% 0.06% 0.06% 0.04% 0.04% 0.24% 0.86%<br />
Percent 0.00% 0.00% 0.00% 0.00% 0.00% 0.00% 0.00% 0.00% 0.00% 0.00%<br />
Office 1.049 0.322 10.253 0.795 0.098 0.635<br />
Percent 1.82% 0.00% 0.00% 0.98% 4.24% 0.00% 1.05% 0.00% 0.10% 0.40%
<strong>District</strong> <strong>of</strong> Columbia Industrial Areas Study DC Office <strong>of</strong> Planning<br />
Prepared by Phillips Preiss Shapiro Associates, Inc.<br />
Parking 1.918 1.883<br />
Percent 0.00% 0.00% 0.00% 0.00% 0.79% 0.00% 0.00% 3.40% 0.00% 0.00%<br />
Public, Quasi-Public,<br />
Institutional 3.613 0.946 0.684 3.258<br />
Percent 0.00% 0.00% 0.00% 0.00% 1.49% 0.57% 0.00% 1.24% 3.29% 0.00%<br />
Parks and Open Spaces 0.394 29.904 7.441 1.127 5.275 0.926 0.083 8.074 1.191<br />
Percent 0.68% 80.84% 7.45% 3.42% 2.18% 0.00% 1.22% 0.15% 8.16% 0.75%<br />
River 0.006 1.111 0.378<br />
Percent 0.00% 0.02% 0.00% 0.00% 0.46% 0.00% 0.00% 0.00% 0.00% 0.24%<br />
Roads 15.558 4.057 6.353 3.937 46.431 13.131 17.005 5.423 6.731 26.054<br />
Percent 26.98% 10.97% 6.36% 11.96% 19.20% 7.85% 22.43% 9.81% 6.80% 16.49%<br />
Institutional 2.563 2.573 11.688 0.976 0.000 2.226<br />
Percent 4.44% 0.00% 0.00% 7.82% 4.83% 0.58% 0.00% 0.00% 0.00% 1.41%<br />
Transport,<br />
Communication, Utilities 8.407 80.357 10.025 6.023 42.738 36.506 20.021 18.078 100.904<br />
Percent 14.58% 0.00% 80.50% 30.46% 2.49% 25.54% 48.15% 36.20% 18.27% 63.87%<br />
Transportation Right <strong>of</strong><br />
Way 15.996 2.171 2.323 0.934 34.907 12.779 9.327 4.167 3.437 5.370<br />
Percent 27.74% 5.87% 2.33% 2.84% 14.43% 7.64% 12.30% 7.53% 3.47% 3.40%<br />
Sub Total 57.67 36.99 99.82 32.92 241.86 167.35 75.83 55.31 98.93 157.98<br />
- 53 -
<strong>District</strong> <strong>of</strong> Columbia Industrial Areas Study DC Office <strong>of</strong> Planning<br />
Prepared by Phillips Preiss Shapiro Associates, Inc.<br />
(Table 2.18, continued)<br />
Land Use<br />
CSX1/<br />
Lamond<br />
Riggs<br />
CSX1/NoMA<br />
DC<br />
Village/Blue<br />
Plains<br />
- 54 -<br />
Fort<br />
Lincoln/Urban<br />
Renewal<br />
11th<br />
Street, SE<br />
NY Ave/<br />
Bladensburg<br />
NY Ave/<br />
Florida<br />
NY Ave/<br />
Ivy City<br />
Scattered<br />
Sites<br />
Undetermined 0.335 0.116 0.001 0.002 2.351<br />
Total (all<br />
sites)<br />
Percent 0.00% 0.44% 0.00% 0.13% 0.00% 0.00% 0.00% 0.00% 0.00% 0.09%<br />
Alleys 0.773 0.972 0.804 1.335 2.052 0.466 13.253<br />
Percent 0.61% 1.27% 0.00% 0.00% 0.00% 0.23% 0.68% 0.82% 0.81% 0.50%<br />
Commercial 5.324 10.574 0.012 44.708 6.783 73.605 18.353 23.316 4.282 327.074<br />
Percent 4.23% 13.86% 0.00% 48.68% 9.18% 21.15% 9.33% 9.36% 7.47% 12.44%<br />
Federal Public 1.410 116.286 0.400 23.092 18.260 2.920 180.024<br />
Percent 1.12% 0.00% 30.18% 0.00% 0.54% 6.64% 9.29% 1.17% 0.00% 6.85%<br />
High Density Residential 0.312<br />
Percent 0.00% 0.00% 0.00% 0.00% 0.00% 0.00% 0.00% 0.00% 0.00% 0.01%<br />
Industrial 14.167 7.896 17.718 0.836 122.366 31.228 34.289 10.774 390.349<br />
Percent 11.27% 10.35% 0.00% 19.29% 1.13% 35.17% 15.88% 13.76% 18.79% 14.85%<br />
Lake 0.059 0.095<br />
Percent 0.00% 0.00% 0.00% 0.06% 0.00% 0.00% 0.00% 0.00% 0.00% 0.00%<br />
Low Density Residential 0.629 3.443 1.721 10.085<br />
Percent 0.50% 0.00% 0.00% 0.00% 0.00% 0.99% 0.00% 0.69% 0.00% 0.38%<br />
Low-Medium Density<br />
Residential 1.843 0.763 1.086 0.004 7.437 0.592 18.995<br />
Percent 1.47% 1.00% 0.00% 0.00% 0.00% 0.31% 0.00% 2.98% 1.03% 0.72%<br />
Local Public 0.001 181.052 2.653 0.000 6.638 5.345 222.794<br />
Percent 0.00% 0.00% 46.99% 0.00% 0.00% 0.76% 0.00% 2.66% 9.32% 8.48%<br />
Medium Density<br />
Residential 2.630 0.025 0.025 4.689 10.133<br />
Percent 2.09% 0.03% 0.00% 0.00% 0.00% 0.01% 0.00% 1.88% 0.00% 0.39%<br />
Median 0.255 0.279 0.316 0.490 10.305 1.415 0.250 0.927 0.209 19.188<br />
Percent 0.20% 0.37% 0.08% 0.53% 13.95% 0.41% 0.13% 0.37% 0.36% 0.73%<br />
Mixed Use 0.896 8.419 9.314<br />
Percent 0.71% 11.03% 0.00% 0.00% 0.00% 0.00% 0.00% 0.00% 0.00% 0.35%<br />
Office 0.966 0.406 0.173 0.381 6.981 22.061<br />
Percent 0.77% 0.53% 0.00% 0.00% 0.23% 0.00% 0.19% 0.00% 12.18% 0.84%
<strong>District</strong> <strong>of</strong> Columbia Industrial Areas Study DC Office <strong>of</strong> Planning<br />
Prepared by Phillips Preiss Shapiro Associates, Inc.<br />
Parking 5.465 9.265<br />
Percent 0.00% 0.00% 0.00% 0.00% 7.40% 0.00% 0.00% 0.00% 0.00% 0.35%<br />
Public, Quasi-Public,<br />
Institutional 0.157 1.260 3.909 0.981 14.808<br />
Percent 0.13% 0.00% 0.00% 0.00% 0.00% 0.36% 0.00% 1.57% 1.71% 0.56%<br />
Parks and Open Spaces 0.477 0.189 5.167 19.386 15.149 10.672 0.024 0.072 105.552<br />
Percent 0.38% 0.25% 1.34% 21.11% 20.51% 3.07% 0.00% 0.01% 0.13% 4.02%<br />
River 0.121 0.003 0.383 2.002<br />
Percent 0.00% 0.00% 0.03% 0.00% 0.00% 0.11% 0.00% 0.00% 0.00% 0.08%<br />
Roads 13.661 23.115 6.571 20.432 41.046 24.318 26.437 9.718 309.979<br />
Percent 10.86% 0.00% 6.00% 7.16% 27.66% 11.80% 12.37% 10.61% 16.95% 11.79%<br />
Institutional 1.579 6.962 0.426 2.913 2.945 2.140 11.701 48.692<br />
Percent 1.26% 9.13% 0.00% 0.00% 0.58% 0.84% 1.50% 0.86% 20.41% 1.85%<br />
Transport,<br />
Communication, Utilities 76.335 31.238 52.667 3.805 38.059 85.483 115.268 725.914<br />
Percent 60.71% 40.95% 13.67% 0.00% 5.15% 10.94% 43.47% 46.25% 0.00% 27.61%<br />
Transportation Right <strong>of</strong><br />
Way 4.635 8.230 6.532 2.786 10.101 25.123 14.087 17.462 6.205 186.571<br />
Percent 3.69% 10.79% 1.70% 3.03% 13.67% 7.22% 7.16% 7.01% 10.82% 7.10%<br />
Sub Total 125.74 76.29 385.27 91.83 73.88 347.95 196.65 249.23 57.33<br />
- 55 -<br />
Source: Office <strong>of</strong> Planning, 2005<br />
2,628.81
<strong>District</strong> <strong>of</strong> Columbia Industrial Areas Study DC Office <strong>of</strong> Planning<br />
Prepared by Phillips Preiss Shapiro Associates, Inc.<br />
Moreover, most <strong>of</strong> this limited amount <strong>of</strong> industrial land is already occupied, and therefore<br />
existing PDR businesses have limited room to expand in place and the <strong>District</strong> has little<br />
potential <strong>of</strong> attracting <strong>of</strong> new PDR businesses. By our calculations, only about 27 acres, or 1.2<br />
percent, <strong>of</strong> the land in industrial areas is vacant (this calculation does not include the 3.7 acres<br />
<strong>of</strong> vacant land that is zoned for residential use). 12<br />
Table 2.19: Vacant Parcels, by Zoning and Sub-Area<br />
Name Zone<br />
Vacant<br />
properties<br />
- 56 -<br />
Area (sq.ft) Area (acres) Percent that<br />
is Vacant<br />
Anacostia Poplar Point C-2-A 0 0.00 0.00 0.00%<br />
Anacostia Poplar Point C-M-1 0 0.00 0.00 0.00%<br />
Anacostia Poplar Point GOV 6 83,290.00 1.91 19.84%<br />
Anacostia Poplar Point W-3 19 196,027.00 4.50 20.27%<br />
25 279,317.00 6.41 11.06%<br />
Water Street, SE C-M-1 0 0.00 0.00 0.00%<br />
Benning Road C-M-1 0 0.00 0.00 0.00%<br />
Benning Road M 0 0.00 0.00 0.00%<br />
0 0.00 0.00 0.00%<br />
Bladensburg/Fort Lincoln C-M-1 1 1,061.00 0.02 0.11%<br />
Bladensburg/Fort Lincoln GOV 0 0.00 0.00 0.00%<br />
1 1,061.00 0.02 0.10%<br />
CSX1 C-2-C 0 0.00 0.00 0.00%<br />
CSX1 C-3-A 0 0.00 0.00 0.00%<br />
CSX1 C-M-1 0 0.00 0.00 0.00%<br />
CSX1 C-M-2 1 2,130.00 0.05 0.09%<br />
CSX1 M 0 0.00 0.00 0.00%<br />
1 2,130.00 0.05 0.03%<br />
CSX1 - Brookland C-M-1 3 89,822.00 2.06 3.73%<br />
CSX1 - Fort Totten C-M-1<br />
FT/C-3-<br />
2 8,388.00 0.19 26.57%<br />
CSX1 - Fort Totten<br />
A<br />
FT/C-<br />
4 23,509.00 0.54 3.40%<br />
CSX1 - Fort Totten<br />
M-1 0 0.00 0.00 0.00%<br />
CSX1 - Fort Totten FTM 0 0.00 0.00 0.00%<br />
CSX1 - Fort Totten GOV 0 0.00 0.00 0.00%<br />
12 In an analysis <strong>of</strong> the <strong>District</strong>’s land capacity, HNTB Associates calculated that only 25.2 acres in C-M and M zones<br />
were vacant. See HNTB 2005. Land Capacity in the <strong>District</strong> <strong>of</strong> Columbia. Memo to the Comp Plan Task Force.<br />
February 24, 2005.
<strong>District</strong> <strong>of</strong> Columbia Industrial Areas Study DC Office <strong>of</strong> Planning<br />
Prepared by Phillips Preiss Shapiro Associates, Inc.<br />
- 57 -<br />
6 31,897.00 0.73 0.88%<br />
CSX1 - Lamond Riggs C-1 0 0.00 0.00 0.00%<br />
CSX1 - Lamond Riggs C-2-A 6 42,634.00 0.98 5.86%<br />
CSX1 - Lamond Riggs C-M-1 1 3,174.00 0.07 0.08%<br />
CSX1 - Lamond Riggs GOV 0 0.00 0.00 0.00%<br />
7 45,808.00 1.05 0.97%<br />
CSX1 NY/NOMA C-2-B 3 5,352.00 0.12 12.82%<br />
CSX1 NY/NOMA C-3-C 0 0.00 0.00 0.00%<br />
CSX1 NY/NOMA C-M-1 3 24,684.00 0.57 4.99%<br />
CSX1 NY/NOMA C-M-3 24 86,345.00 1.98 3.74%<br />
30 116,381.00 2.67 3.57%<br />
CSX2 - Anacostia/Fairlawn C-2-A 1 20,779.00 0.48 12.64%<br />
CSX2 - Anacostia/Fairlawn C-M-1 5 53,510.00 1.23 6.70%<br />
CSX2 - Anacostia/Fairlawn GOV 1 22,554.00 0.52 1.40%<br />
7 96,843.00 2.22 3.76%<br />
CSX2 - Kennilworth C-3-A 3 5,362.00 0.12 0.77%<br />
CSX2 - Kennilworth C-M-1 5 13,509.00 0.31 0.24%<br />
CSX2 - Kennilworth GOV 0 0.00 0.00 0.00%<br />
8 18,871.00 0.43 0.29%<br />
DC Village/Blue Plains C-M-1 0 0.00 0.00 0.00%<br />
DC Village/Blue Plains C-M-3 0 0.00 0.00 0.00%<br />
0 0.00 0.00 0.00%<br />
Fort Lincoln Urban Renewal C-2-B 0 0.00 0.00 0.00%<br />
Fort Lincoln Urban Renewal GOV 0 0.00 0.00 0.00%<br />
Fort Lincoln Urban Renewal SP-2 0 0.00 0.00 0.00%<br />
0 0.00 0.00 0.00%<br />
11th Street, SE C-M-1 3 1,614.00 0.04 0.10%<br />
11th Street, SE C-M-2 0 0.00 0.00 0.00%<br />
11th Street, SE M 0 0.00 0.00 0.00%<br />
3 1,614.00 0.04 0.05%<br />
New York Avenue/Bladensburg C-2-A 0.00 0.00%<br />
New York Avenue/Bladensburg C-M-1 1 96,202.00 2.21 1.17%<br />
New York Avenue/Bladensburg C-M-2<br />
LO/C-<br />
1 23,204.00 0.53 0.72%<br />
New York Avenue/Bladensburg M-1 3 29,619.00 0.68 5.34%<br />
New York Avenue/Bladensburg M 0 0.00 0.00 0.00%<br />
5 149,025.00 3.42 1.00%<br />
New York Avenue/Florida C-M-1 1 13,668.00 0.31 0.60%<br />
New York Avenue/Florida C-M-2 0 0.00 0.00 0.00%<br />
New York Avenue/Florida GOV 0 0.00 0.00 0.00%<br />
New York Avenue/Florida M 1 187,930.00 4.31 4.10%
<strong>District</strong> <strong>of</strong> Columbia Industrial Areas Study DC Office <strong>of</strong> Planning<br />
Prepared by Phillips Preiss Shapiro Associates, Inc.<br />
- 58 -<br />
2 201,598.00 4.63 2.35%<br />
New York Avenue/Ivy City C-M-1 1 145,898.00 3.35 5.97%<br />
New York Avenue/Ivy City C-M-2 0 0.00 0.00 0.00%<br />
New York Avenue/Ivy City GOV<br />
LO/C-<br />
0 0.00 0.00 0.00%<br />
New York Avenue/Ivy City M-1 0 0.00 0.00 0.00%<br />
New York Avenue/Ivy City M 0 0.00 0.00 0.00%<br />
1 145,898.00 3.35 1.50%<br />
Scattered Site 1 C-M-1 0 0.00 0.00 0.00%<br />
Scattered Site 2 C-M-1 0 0.00 0.00 0.00%<br />
Scattered Site 3 C-M-2 0 0.00 0.00 0.00%<br />
Scattered Site 3 C-M-3 4 7,201.00 0.17 1.03%<br />
Scattered Site 4 C-M-1 0 0.00 0.00 0.00%<br />
Scattered Site 5 C-M-1 0 0.00 0.00 0.00%<br />
Scattered Site 6 C-M-1 0 0.00 0.00 0.00%<br />
4 7,201.00 0.17 0.29%<br />
Source: Office <strong>of</strong> Planning, 2005<br />
TOTAL 27.26 1.21%<br />
Finally, most <strong>of</strong> these sub-areas are greatly subdivided—only five sub-areas have average<br />
parcel sizes <strong>of</strong> more than one acre. Fifteen sub-areas have average parcel sizes <strong>of</strong> less than an<br />
acre, and eight <strong>of</strong> those sub-areas have average parcel sizes <strong>of</strong> less than 20,000 square feet,<br />
or, less than one-half <strong>of</strong> an acre.<br />
The <strong>District</strong>’s supply <strong>of</strong> industrial land is at a critical juncture. The mere 2,000 acres <strong>of</strong> actual<br />
zoned industrial land is consumed in large part by railroad yards and rights-<strong>of</strong>-way, there is high<br />
demand for the small, segmented parcels, and there is a very low vacancy rate. Also, as<br />
discussed in Section 2.3, many <strong>of</strong> the most desirable areas are under increased redevelopment<br />
pressure from private entrepreneurs and large-scale public initiatives. It appears, then, that the<br />
supply <strong>of</strong> industrial land that remains in the <strong>District</strong> is very limited and continues to shrink. What<br />
now remains is a core that should be conserved wherever practical. Chapter Four <strong>of</strong> this report<br />
discusses our recommendations for which industrial areas deserve the most protection, which<br />
areas should undergo some land use evolution or intensification, and which areas are<br />
appropriate for other land uses.
<strong>District</strong> <strong>of</strong> Columbia Industrial Areas Study DC Office <strong>of</strong> Planning<br />
Prepared by Phillips Preiss Shapiro Associates, Inc.<br />
Size (sq.ft.)<br />
100,000<br />
90,000<br />
80,000<br />
70,000<br />
60,000<br />
50,000<br />
40,000<br />
30,000<br />
20,000<br />
10,000<br />
0<br />
Chart 2.16: Average Parcel Size by Sub-Area<br />
- 59 -<br />
Sub-area Name<br />
NOTE: Excludes outliers: Benning Road (average 622.588), DC Village/Blue Plains (average 1,483,532),<br />
Fort Lincoln (no data), Scattered Site 6 (1 lot, average 274,761).<br />
Source: Office <strong>of</strong> Planning, 2005
<strong>District</strong> <strong>of</strong> Columbia Industrial Areas Study DC Office <strong>of</strong> Planning<br />
Prepared by Phillips Preiss Shapiro Associates, Inc.<br />
3 Existing Conditions Analysis<br />
3.1 <strong><strong>IN</strong>DUSTRIAL</strong> <strong>LAND</strong> AND PUBLIC POLICY<br />
3.1.1 COMPREHENSIVE PLAN POLICIES<br />
The <strong>District</strong> has a Comprehensive Plan that guides land use and zoning in the <strong>District</strong>. It was<br />
adopted in 1985 and updated in 1999, and is currently under a major revision process, which<br />
began in 2003 and is scheduled to conclude in mid-2006 with its adoption. The <strong>District</strong>’s Office<br />
<strong>of</strong> Zoning and Zoning Commission is directed to consult the Comprehensive Plan to ensure that<br />
zoning and zoning amendments are consistent with the Comprehensive Plan.<br />
The existing Comprehensive Plan’s Land Use Element sets the following objective for<br />
“production and technical employment areas:”<br />
The objectives for production and technical employment areas are to encourage<br />
the growth <strong>of</strong> centers <strong>of</strong> high technology, research and development, and to<br />
provide for essential support services and nonpolluting production activities.<br />
The Plan’s Generalized Land Use Map designates most <strong>of</strong> DC’s industrial land for “production<br />
and technical employment,” or PTE. The Plan describes this land use category as follows:<br />
“Restructured industrial land use intended to encourage growth industries and industries<br />
with a high ratio <strong>of</strong> employees to land area occupied, such as <strong>of</strong>fice support systems,<br />
communications, printing and publishing, wholesaling, transportation services, food<br />
services and tourism support services; warehousing; and other commercial activities that<br />
generally do not occur to a substantial degree in other commercial areas.”<br />
As is clear from this description, the Comprehensive Plan envisions these areas not as<br />
traditional industrial districts, which generally have a low ratio <strong>of</strong> employment to land area, but<br />
rather as areas to locate all manner <strong>of</strong> production, distribution and repair activities (hence the<br />
PDR moniker used throughout this report). The Comprehensive Plan also identifies the crucial<br />
support role that these districts can play, by accommodating essential uses that are not typically<br />
found in <strong>of</strong>fice and retail areas.<br />
The Land Use Element prescribes that industrial areas shall be designated in:<br />
Areas where buffering can protect adjacent residential areas from adverse impacts or<br />
where no residential areas are present<br />
Areas adjacent to railroads and major highways<br />
Certain areas where there is sufficient land to meet the needs <strong>of</strong> production and<br />
technical employment users, and<br />
- 60 -
<strong>District</strong> <strong>of</strong> Columbia Industrial Areas Study DC Office <strong>of</strong> Planning<br />
Prepared by Phillips Preiss Shapiro Associates, Inc.<br />
Certain areas where there are viable industrial uses in operation.<br />
Thus the Comprehensive Plan seeks to guide industrial land uses into certain areas, and also<br />
seeks to provide spatial separation <strong>of</strong> industry with incompatible land uses such as housing.<br />
3.1.2 DISTRICT POLICIES REGARD<strong>IN</strong>G <strong><strong>IN</strong>DUSTRIAL</strong> <strong>LAND</strong> USE<br />
The <strong>District</strong> recognizes that current viable land uses that provide services, jobs, and fiscal<br />
benefits are essential to the <strong>District</strong>’s economy. In the Comprehensive Plan Land Use Element,<br />
<strong>District</strong> policies state that it will make efforts, through appropriate zoning and related means:<br />
To ensure that these uses are maintained and that sufficient land is reserved<br />
for production and technical employment uses;<br />
Restructure industrial areas which are not needed for essential non-PTE type<br />
industrial uses, but which are suited to continued industrial development, into<br />
production and technical employment centers;<br />
Stimulate the growth <strong>of</strong> industries providing a high ration <strong>of</strong> employees to<br />
land areas;<br />
Discourage underutilization <strong>of</strong> industrial land for nonproductive purposes;<br />
Strengthen the economy and job base <strong>of</strong> the <strong>District</strong> by designating selected<br />
areas as production and technical employment centers for research and<br />
development, high technology, manufacture and assembly, wholesaling, and<br />
service production activities, through modifications to the <strong>District</strong>’s industrial<br />
land use controls in some areas <strong>of</strong> the <strong>District</strong>, along with concentrated public<br />
efforts to retain existing businesses and to attract new ones;<br />
Determine the status, trends, and future needs for industrial land in the<br />
<strong>District</strong> and the value <strong>of</strong> both traditional uses and production and technical<br />
employment uses to the <strong>District</strong> in terms <strong>of</strong> essential services and jobs for<br />
residents and in terms <strong>of</strong> fiscal benefits to the <strong>District</strong>; and,<br />
Develop appropriate measures to mitigate or eliminate the adverse impacts<br />
caused by industrial uses.<br />
3.1.3 EXIST<strong>IN</strong>G ZON<strong>IN</strong>G<br />
The zoning for these areas both does and does not reflect this vision. DC has two primary<br />
industrial zoning districts: C-M (Commercial-Light Manufacturing) and M (manufacturing). 13<br />
These districts permit a wide variety <strong>of</strong> commercial uses (basically everything permitted in the<br />
C-1, C-2, C-3 and C-4 zones, which includes a wide variety <strong>of</strong> retail and services, including<br />
13 Again, W zones also permit certain light industrial uses as a matter <strong>of</strong> right, but given that they also permit<br />
residential uses, and their relative scarcity within our study area, PPSA does not consider W zones as purely<br />
industrial zones for this discussion.<br />
- 61 -
<strong>District</strong> <strong>of</strong> Columbia Industrial Areas Study DC Office <strong>of</strong> Planning<br />
Prepared by Phillips Preiss Shapiro Associates, Inc.<br />
gasoline service stations) as well as industrial and production uses. A full list <strong>of</strong> uses is provided<br />
in Tables 3.1 and 3.2. The M zone is a heavier industrial district that provides for industrial uses<br />
not expressly prohibited. However, both districts permit, either as-<strong>of</strong>-right or via special<br />
exception, high-impact uses such as incinerators and solid waste and recycling facilities. All<br />
industrial uses are subject to specific performance standards.<br />
The three types <strong>of</strong> C-M district—C-M-1, C-M-2, and C-M-3—differ in terms <strong>of</strong> the building bulk<br />
permitted. All three permit buildings considerable bulkier than most buildings found in the<br />
industrial zones, where tall multi-story buildings are the exception. The height and floor area<br />
standards are summarized in Table 3.3. Even the lowest intensity district permits building bulk<br />
<strong>of</strong> three times the lot area (FAR = 3.0) and three stories/40 feet. The allowed intensities go up<br />
from there, to a maximum <strong>of</strong> 90 feet and 6.0 FAR. Likely only the Hecht building on New York<br />
Avenue approaches these densities.<br />
The C-M and M districts are part <strong>of</strong> an ordinance which follows a “pyramid” structure common to<br />
older zoning ordinances, whereby each less restrictive district incorporates the all the uses<br />
permitted in the more restrictive districts. This is seen in the C-M and M zones, which, in<br />
addition to PDR uses, permit neighborhood commercial, community commercial, major<br />
business, and central business district uses. Critically, there is nothing in the current ordinance<br />
that prohibits the development <strong>of</strong> retail and <strong>of</strong>fice complexes in the industrial zones. Only new<br />
residential development is prohibited. To date, retail and commercial pressures have not had a<br />
major impact on industrial lands outside <strong>of</strong> a few developments (such as the Home Depot).<br />
However, given the current real estate development climate in DC, pressures are likely to<br />
escalate even more in the near future. Revisiting this pyramid structure to consider zoning that<br />
will better protect existing PDR users is warranted.<br />
- 62 -
<strong>District</strong> <strong>of</strong> Columbia Industrial Areas Study DC Office <strong>of</strong> Planning<br />
Prepared by Phillips Preiss Shapiro Associates, Inc.<br />
Table 3.1: Permitted Uses in the C-M Zones<br />
Uses permitted as <strong>of</strong> right:<br />
Commercial uses up to the C-4 district<br />
Pre-existing residential uses<br />
Hotel or inn<br />
Carting, express, moving or haling terminal or yard<br />
Commercial athletic field<br />
Experimental research or testing laboratory<br />
Incinerator<br />
Motorcycle sales and repair<br />
Laundry or dry-cleaning<br />
Public utility pumping station<br />
Repair garage<br />
Wholesale or storage establishment, including open storage, but no<br />
junk yards<br />
Any light manufacturing, processing, fabricating or repair<br />
establishment<br />
Temporary detention or correctional institution on leased property for<br />
a period not to exceed three years<br />
Electronic Equipment Facilities (EEF) (i.e. data switches, telco hubs,<br />
data centers, etc.) subject to limitations on location<br />
Special exception uses:<br />
Massage parlors<br />
Intermediate materials recycling facilities<br />
Solid waster handling facility<br />
An EEF not permitted as <strong>of</strong> right<br />
Concrete or Asphalt plant<br />
Source: <strong>District</strong> <strong>of</strong> Columbia Zoning Ordinance<br />
- 63 -
<strong>District</strong> <strong>of</strong> Columbia Industrial Areas Study DC Office <strong>of</strong> Planning<br />
Prepared by Phillips Preiss Shapiro Associates, Inc.<br />
Table 3.2: Uses Permitted in the M Zone<br />
Uses permitted as-<strong>of</strong>-right:<br />
Permitted uses in the C-M zones<br />
Intermediate materials recycling facilities, subject to conditions<br />
Uses not expressly prohibited<br />
Special exception uses the M zone:<br />
Massage parlors<br />
Solid waste handling facilities<br />
An EEF not permitted as <strong>of</strong> right<br />
Concrete or Asphalt plant<br />
Prohibited uses:<br />
Abattoir or slaughter house<br />
Acetylene gas manufacture<br />
Ammunition and explosive manufacture or storage<br />
Animal rendering<br />
Arsenal<br />
Bituminous products refining or manufacture, other than an asphalt<br />
plant<br />
Bone products manufacture<br />
Calcium carbide manufacture<br />
Curing, tanning or storage <strong>of</strong> hides<br />
Fertilizer manufacture<br />
Rock quarry <strong>of</strong> the excavation <strong>of</strong> rock for commercial purpose<br />
Rubber products manufacture or treatment<br />
Steel furnace, blast furnace, bloom furnace, coke even, or rolling mill<br />
Any other use with objectionable characteristics similar to those listed<br />
in this subsection.<br />
Source: <strong>District</strong> <strong>of</strong> Columbia Zoning Ordinance<br />
- 64 -
<strong>District</strong> <strong>of</strong> Columbia Industrial Areas Study DC Office <strong>of</strong> Planning<br />
Prepared by Phillips Preiss Shapiro Associates, Inc.<br />
Table 3.3: Bulk Standards in the C-M and M Zones<br />
Zone Height (feet) Height (stories) FAR<br />
C-M-1 40 3 3.0<br />
C-M-2 60 N/A 4.0<br />
C-M-3 90 N/A 6.0<br />
M 90 N/A 6.0<br />
Source: <strong>District</strong> <strong>of</strong> Columbia Zoning Ordinance<br />
The zoning maps contained in the Appendix show the zoning for each industrial sub-area.<br />
3.2 THE MARKET FOR <strong><strong>IN</strong>DUSTRIAL</strong> <strong>LAND</strong> AND BUILD<strong>IN</strong>GS<br />
Industrial land markets are unlike other types <strong>of</strong> real estate markets. Tenants tend to choose<br />
their space and site location based on purely functional criteria: access to transportation<br />
resources, layout, the number <strong>of</strong> loading docks, ceiling clearances, floor loads, etc. Variables<br />
that drive other real estate decisions, such as image or a prestigious address, play little role for<br />
industrial real estate. Further, unlike <strong>of</strong>fice rents, which can vary wildly based on the type,<br />
location and quality <strong>of</strong> buildings, industrial rents tend to fall into a narrower range. Finally, no<br />
matter high-value the location, industrial rents and land values tend to significantly lag other<br />
types <strong>of</strong> real estate on a per square foot basis, meaning that industrial development must be<br />
developed at lower cost, and on lower cost land, than other types <strong>of</strong> uses.<br />
The DC market and the suburban market differ significantly in terms <strong>of</strong> prevailing rents and the<br />
type and quality <strong>of</strong> product on <strong>of</strong>fer—ironically, the <strong>District</strong> typically <strong>of</strong>fers a lower quality product<br />
at a higher price than suburban competition, meaning that most users in the <strong>District</strong> must have a<br />
compelling reason for a DC location. Within DC, both private and public users looking to buy or<br />
lease industrial space will be facing an increasingly tight market. Strong demand, buoyed by the<br />
real estate boom and a strong economy, has coupled with a lack <strong>of</strong> new construction to create a<br />
constrained market. While the DC market has, on paper, a reasonable vacancy rate, most <strong>of</strong><br />
this vacant space is <strong>of</strong> poor quality and/or unsuitable for most users. When it comes to quality<br />
space, the vacancy rate in the <strong>District</strong> remains quite low.<br />
The following section provides an overview and summary <strong>of</strong> current conditions in the market for<br />
industrial buildings in DC and the region, with references to national norms included where such<br />
comparisons are useful. The analysis relies primarily on market reports from major brokerages,<br />
as well as interviews with brokers active in DC’s industrial areas. Note that while the former<br />
track market statistics for all industrial buildings regardless <strong>of</strong> whether they are located in an<br />
industrial zoning district, the latter concentrated specifically on DC’s industrially-zoned land and<br />
buildings.<br />
- 65 -
<strong>District</strong> <strong>of</strong> Columbia Industrial Areas Study DC Office <strong>of</strong> Planning<br />
Prepared by Phillips Preiss Shapiro Associates, Inc.<br />
3.2.1 NATIONAL AND REGIONAL CONTEXT: WASH<strong>IN</strong>GTON, D.C. METRO AREA<br />
<strong><strong>IN</strong>DUSTRIAL</strong> MARKET<br />
National Perspective<br />
Across the country, industrial markets have been in a state <strong>of</strong> flux over the past four years.<br />
Construction <strong>of</strong> new industrial space throughout the 1990s outpaced demand resulting in<br />
double-digit vacancy rates in nearly every submarket. Slowed construction and a continuing<br />
strong economy have contributed to the stabilization <strong>of</strong> the United States industrial real estate<br />
market with the <strong>District</strong> <strong>of</strong> Columbia and the Washington, D.C. Metro area reflecting these<br />
national trends 14 .<br />
At the end <strong>of</strong> the second quarter <strong>of</strong> 2005, the national vacancy rate for industrial space was 8.6<br />
percent, over a full percentage point lower than second quarter reporting <strong>of</strong> last year, indicating<br />
a tightening market. 15<br />
Market indicators for industrial space are commonly separated into two categories: Warehouse<br />
and Flex-Industrial. Research and Development (R&D) space is included in the Flex category,<br />
as are modern industrial/<strong>of</strong>fice hybrids. The national average asking rent for Warehouse space<br />
had increased from $4.26 a year ago to $4.41 per square foot for second quarter 2005. Flex<br />
space had declined 30 cents from its asking rent a year ago to $9.11 per square foot. The<br />
strongest market for Warehouse and Flex space in terms <strong>of</strong> rents was San Diego, with the<br />
Washington, D.C. Metro Area ranking as the second strongest in both categories. 16 Asking rents<br />
for warehouse/distribution and flex space in San Diego average $8.16 and $14.88, respectively,<br />
compared with $7.78 and $12.37 in the DC Metro Area.<br />
Regional Perspective<br />
The amount <strong>of</strong> existing industrial inventory for the Washington, D.C. Metro Area is estimated to<br />
total a little over 177 million square feet. Approximately 42 percent <strong>of</strong> this inventory is occupied<br />
as Flex space. The remaining 58 percent is leased to Warehouse users. 17<br />
Throughout the region, approximately 2,089,500 square feet <strong>of</strong> industrial space is under<br />
construction, representing a 1.7 percent growth in floor space. Over 25 percent <strong>of</strong> this total is<br />
14 The “region” discussed in the <strong>of</strong>fice market reports quoted here is roughly the same as the MSA;<br />
however these proprietary reports do not adopt the precise geography used by the Census Bureau.<br />
15 Industrial Market Trends: North America, Second Quarter 2005. Grubb & Ellis Research, 2005.<br />
16 Industrial Market Trends: North America, Second Quarter 2005.<br />
17 The CoStar Industrial Report, Third Quarter 2005, Washington, DC Industrial Market. The CoStar<br />
Group, 2005.<br />
- 66 -
<strong>District</strong> <strong>of</strong> Columbia Industrial Areas Study DC Office <strong>of</strong> Planning<br />
Prepared by Phillips Preiss Shapiro Associates, Inc.<br />
pre-leased. No new industrial construction is being undertaken or planned for the <strong>District</strong> <strong>of</strong><br />
Columbia. 18<br />
For the year-to-date 2005, the I-270 corridor is the strongest performing submarket in the Flex<br />
category with a vacancy rate <strong>of</strong> 10.4 percent, net absorption <strong>of</strong> 304,408 square feet, and an<br />
asking rent rate <strong>of</strong> $17.12 per square foot. Bethesda/Silver Spring, Frederick County and<br />
Springfield/Newington are also exceeding regional averages in this category.<br />
Springfield/Newington posts the strongest numbers in the Warehouse category. Year-to-date<br />
absorption for this submarket totaled 152,562 square feet with a 3.9 percent vacancy rate and<br />
$8.96 average asking rent per square foot. 19 Fairfax, Arlington/Alexandria, and Woodbridge also<br />
record low vacancy rates and high asking rents in the Warehouse category.<br />
Overall, as <strong>of</strong> the third quarter <strong>of</strong> 2005, the <strong>District</strong> <strong>of</strong> Columbia submarket is an average<br />
performer in the Flex category, but one <strong>of</strong> the strongest areas in the Warehouse category,<br />
consistent with economic findings that support services, contracting and distribution are some <strong>of</strong><br />
the most in-demand uses for DC’s industrial buildings.<br />
Table 3.4: Comparative Industrial Market Statistics, Third Quarter, 2005<br />
Category Metro DC Region <strong>District</strong> <strong>of</strong> Columbia<br />
Existing Inventory<br />
Number <strong>of</strong> Buildings 4,147 378<br />
Total RBA (SF) 177,072,368 13,041,064<br />
Vacancy<br />
Direct SF 16,738,744 1,475,654<br />
Total SF 17,731,850 1,475,654<br />
% Vacant 10.0% 11.3%<br />
YTD Net Absorption (SF) 1,506,460 311,083<br />
YTD Deliveries (SF) 2,348,658 -<br />
Under Construction SF 2,089,485 -<br />
Quoted Rental Rates/SF $10.24 $14.30<br />
Average Building Size (SF) 42,699 34,500<br />
Source: The CoStar Group (2005):<br />
The CoStar Industrial Report, Third Quarter 2005, Washington, DC Industrial Market.<br />
18 The CoStar Industrial Report, Third Quarter 2005, Washington, DC Industrial Market. The CoStar<br />
Group, 2005.<br />
19 The CoStar Industrial Report.<br />
- 67 -
<strong>District</strong> <strong>of</strong> Columbia Industrial Areas Study DC Office <strong>of</strong> Planning<br />
Prepared by Phillips Preiss Shapiro Associates, Inc.<br />
3.2.2 THE DISTRICT OF COLUMBIA SUBMARKET: AN OVERVIEW OF THE EXIST<strong>IN</strong>G<br />
<strong>IN</strong>VENTORY<br />
Current Inventory <strong>of</strong> Space<br />
According to databases maintained by CoStar, a private provider <strong>of</strong> commercial real estate<br />
information and data, the existing industrial inventory within the <strong>District</strong> <strong>of</strong> Columbia totals<br />
13,041,064 square feet <strong>of</strong> space located in 378 buildings. Approximately 16 percent or<br />
2,034,689 square feet is occupied as Flex space, whereas the remaining 84 percent or<br />
11,006,375 square feet is Warehouse space. 20 Since the first quarter <strong>of</strong> 2001, the inventory <strong>of</strong><br />
industrial space has decreased 252,300 square feet.<br />
The Third Quarter 2005 CoStar Industrial Report records an average size <strong>of</strong> 34,500 square feet<br />
for industrial buildings in the <strong>District</strong> <strong>of</strong> Columbia. This amount is considerably smaller than the<br />
Washington, DC Metro Area average <strong>of</strong> 42,699 square feet. 21<br />
Vacancy<br />
In the Flex space category, the <strong>District</strong> <strong>of</strong> Columbia lists the highest vacancy rate <strong>of</strong> any<br />
submarket in the Washington, D.C. Metro Area, at 44.6 percent. Conversely, the <strong>District</strong>’s<br />
Warehouse vacancy rate is one <strong>of</strong> the region’s lowest at 5.2 percent. 22 This would suggest that<br />
there is about 900,000 square feet <strong>of</strong> vacant flex space and 570,000 square feet <strong>of</strong> vacant<br />
warehouse space in the <strong>District</strong>, for a total <strong>of</strong> nearly 1.5 million square feet <strong>of</strong> vacant industrial<br />
space, or 11 percent <strong>of</strong> DC’s total industrial inventory. Qualitatively, field surveys did not reveal<br />
anywhere near such a large amount <strong>of</strong> vacant industrial space within DC’s industrial districts.<br />
The source <strong>of</strong> these vacancy numbers is therefore uncertain. It is likely that at least some <strong>of</strong> the<br />
vacant flex space corresponds to R&D and other buildings located outside <strong>of</strong> the industrial<br />
zones, and hence the study area, for this study. The industrial market reports are keyed to how<br />
different buildings are marketed, rather than the zoning district in which they are located.<br />
Rental Rates<br />
Recorded rental rates for Flex space at $19.54 per square foot have inflated average quoted<br />
rates for the <strong>District</strong>’s industrial space. Being the highest in the Washington, D.C. Metro Area,<br />
the average rate for Flex space is a likely contributor to the category’s high vacancy rate,<br />
although the quality <strong>of</strong> space available likely plays a significant role as well.<br />
20 Ibid..<br />
21 Ibid.<br />
22 Ibid.<br />
- 68 -
<strong>District</strong> <strong>of</strong> Columbia Industrial Areas Study DC Office <strong>of</strong> Planning<br />
Prepared by Phillips Preiss Shapiro Associates, Inc.<br />
At $12.31 per square foot, the Warehouse rental rates are a more accurate reflection <strong>of</strong> market<br />
activity in the industrial sector. This average rate is 50 percent higher than the regional average<br />
<strong>of</strong> $8.08 per square foot, but it is somewhat lower than the average for Fairfax County, which<br />
commands the highest warehouse rents in the region. 23<br />
Recent Absorption Trends<br />
During the past five years, vacancy rates for each category <strong>of</strong> industrial space have gradually<br />
decreased after the region’s Flex vacancy peaked in 2003 at 16.8 percent and the Warehouse<br />
market highest rate <strong>of</strong> 8.0 percent in 2003.<br />
The <strong>District</strong>’s industrial absorption rates have been more tenuous. Although positive absorption<br />
rates have been recorded for the first three quarters <strong>of</strong> 2005, this uptrend follows a year <strong>of</strong> four<br />
consecutive quarters <strong>of</strong> negative absorption.<br />
In the third quarter <strong>of</strong> 2005, net absorption <strong>of</strong> industrial space (Flex and Warehouse space<br />
inclusive) totaled 123,190 square feet.<br />
New Construction<br />
Since the beginning <strong>of</strong> 2002, only 25,000 square feet <strong>of</strong> new industrial space has been<br />
constructed in the <strong>District</strong> <strong>of</strong> Columbia.<br />
3.2.3 FACTORS IMPACT<strong>IN</strong>G THE DISTRICT OF COLUMBIA’S CURRENT <strong><strong>IN</strong>DUSTRIAL</strong><br />
MARKET<br />
In November 2005, six active industrial real estate brokers were interviewed regarding<br />
conditions in the <strong>District</strong> <strong>of</strong> Columbia’s industrial market. Based on their input and independent<br />
research, the following five issues were identified as critical to the future strength <strong>of</strong> the <strong>District</strong>’s<br />
position in the region’s competitive industrial landscape.<br />
Location and Accessibility<br />
Proximity to railroads and major roadways has guided industrial real estate value for over 100<br />
years. Based on these criteria, the low vacancy rates and high appeal <strong>of</strong> the V Street Industrial<br />
Corridor is unsurprising. However, despite its location between freight lines and Routes 50 and<br />
Alternate 1, asking rents along V Street range between $5.00 and $7.00 per square foot, which<br />
23 Ibid.<br />
- 69 -
<strong>District</strong> <strong>of</strong> Columbia Industrial Areas Study DC Office <strong>of</strong> Planning<br />
Prepared by Phillips Preiss Shapiro Associates, Inc.<br />
is a low rate for the DC market, and lower than the regional average. 24 These low rates help<br />
explain the low vacancy rate in this area, and may be due to the presence <strong>of</strong> long term leases<br />
which delay response to a rising market. The combination <strong>of</strong> modest rents and low vacancy may<br />
also stem from another issue: spaces along the V Street corridor are constrained from<br />
significant expansion/reconfiguration, so any tenant must be satisfied with the space size and<br />
configuration, number <strong>of</strong> loading bays, etc.<br />
One <strong>of</strong> the issues with industrial space in the <strong>District</strong> is the relative inaccessibility <strong>of</strong> the region’s<br />
airports, namely Dulles and Baltimore-Washington International Airports. For this reason,<br />
industries located in the <strong>District</strong> are more likely to have locally or regionally-focused businesses.<br />
The rental rates for available space near the <strong>District</strong>’s border with Takoma Park, Maryland<br />
typically range between $7.00 and $9.00 per square foot (this would include the Chillum Place<br />
area). A partial explanation for this increase is related to the area’s relative accessibility to I-295<br />
and I-95, as well as BWI Airport. 25<br />
Size and Expansion Capabilities<br />
Demand for industrial space is highest for space ranging between 10,000 and 20,000 square<br />
feet in size. Space under 10,000 square feet is almost equally sought. Two brokers stated that<br />
the time on market for space in these ranges is short and rarely requires advertising. 26<br />
Unlike the suburban markets, where industrial space <strong>of</strong> this small size generally remains after<br />
the larger leases are signed, small space leases are a premium in the <strong>District</strong>. This condition<br />
creates difficulties when industries in the <strong>District</strong> seek expansion opportunities. Especially in the<br />
Warehouse category, as businesses grow, they are forced to relocate to the suburbs where a<br />
wider variety <strong>of</strong> spaces provide a greater number <strong>of</strong> options. Strategies aimed at easing<br />
expansion within the <strong>District</strong>’s industrial zones could play an important part in efforts to retain<br />
successful PDR uses in the <strong>District</strong>.<br />
Geography <strong>of</strong> the <strong>District</strong><br />
The basic geography <strong>of</strong> the <strong>District</strong> <strong>of</strong> Columbia, paired with the city’s historic industrial trends,<br />
creates difficulty for its Flex and Warehouse markets. As previously discussed, roadway and<br />
airport accessibility can be critical for industrial businesses. Proximity to population density and<br />
a diverse workforce can also be factors in location decision-making.<br />
24 Retail Compass interviews with two brokerage representatives for V Street Industrial Park, November<br />
2005.<br />
25 Retail Compass interviews with two brokerage representatives for industrial parcels at Blair Road and<br />
Rittenhouse Street and Kansas Avenue and Chillum Place, November 2005.<br />
26 Retail Compass interviews with five brokerage representatives, November 2005.<br />
- 70 -
<strong>District</strong> <strong>of</strong> Columbia Industrial Areas Study DC Office <strong>of</strong> Planning<br />
Prepared by Phillips Preiss Shapiro Associates, Inc.<br />
Historically and currently, the <strong>District</strong>’s industrial supply has been largely focused in its rail<br />
corridors. As highways expanded, airports were constructed, and Northern Virginia developed,<br />
the focal point <strong>of</strong> the industrial market’s regional interest shifted west. Along the Dulles Corridor<br />
and as far from the city’s center as Manassas, industries took advantage <strong>of</strong> the growing<br />
population base as well as the roadway capacity <strong>of</strong> Routes 66 & 50, I-495 and I-95 as well as<br />
the Dulles Toll Road and Dulles Greenway.<br />
For <strong>District</strong> businesses, access to these routes is hindered by limited crossings over the<br />
Potomac River and traffic congestion through the city. Perhaps more significantly, available land<br />
for and private development interest in new industrial space in the <strong>District</strong> prevented urban<br />
industrial growth while suburban submarkets added (and continue to add) new, modern and<br />
flexible space each year.<br />
Longevity and Tradition<br />
Vacancy rates in the <strong>District</strong> have remained remarkably consistent over the past sixteen<br />
quarters with only a 2.5 percent fluctuation. One possible explanation for this steady condition is<br />
the relative lack <strong>of</strong> turnover in the <strong>District</strong>’s industrial spaces. Local brokers report that space<br />
rarely becomes available due to the commitment <strong>of</strong> businesses to the <strong>District</strong> as well as the cost<br />
and effort associated with relocation. Modest rents and rent increases also facilitate this<br />
stability. 27<br />
Local Business Standing with the <strong>District</strong> Government<br />
One <strong>of</strong> the factors that influence new businesses to seek industrial space in the <strong>District</strong> are the<br />
benefits associated with a local address. Location in an Enterprise Zone or standing as a Local,<br />
Small, Disadvantaged Business Enterprise (LSDBE) provide financial incentives, lending<br />
capabilities and special consideration for government contracts that are not <strong>of</strong>fered to<br />
businesses outside the <strong>District</strong>.<br />
Regulatory Factors<br />
Within the <strong>District</strong> <strong>of</strong> Columbia, provisions for a Storage Facility Permit or ABC Wholesaler’s<br />
License require wine, beer and liquor wholesale distributors to have facilities within the City to<br />
sell to DC businesses. Because no similar regulations apply to food distribution, a majority <strong>of</strong><br />
grocery wholesalers serve the <strong>District</strong> from Prince George’s County, via Route 50. 28 The only<br />
major food distribution center in the <strong>District</strong> is the Florida Avenue Wholesale Market. This<br />
unique resource addresses ethnic markets and local restaurants rather than chain grocery<br />
stores.<br />
27 As stated in interviews by Retail Compass with three industrial brokerage representatives, November<br />
2005.<br />
28 Interview with Paul Pascal, Pascal & Weiss, P.C. December 2005.<br />
- 71 -
<strong>District</strong> <strong>of</strong> Columbia Industrial Areas Study DC Office <strong>of</strong> Planning<br />
Prepared by Phillips Preiss Shapiro Associates, Inc.<br />
Unlike the ABC laws that increase the demand for industrial space in the <strong>District</strong>, city<br />
regulations decrease the available supply <strong>of</strong> space for another industrial use, trash transfer<br />
facilities, or TTFs. 29 In the 1998 amendment to DC’s Solid Waste Facility Permit Act <strong>of</strong> 1995,<br />
new provisions requiring facilities to be located 300 feet from any residential property line<br />
effectively eliminated any eligible property for this type <strong>of</strong> use in the <strong>District</strong>. 30<br />
Business Taxation<br />
Although industrial space within the <strong>District</strong> is competitive with suburban <strong>of</strong>ferings, the city’s<br />
taxation policies are less so. In comparing corporate franchise income taxation rates, the <strong>District</strong><br />
9.975 percent rate is measured against Maryland’s 7 percent and Virginia’s 6 percent rate.<br />
Another significant taxation consideration for industrial businesses is the cost differential<br />
between the <strong>District</strong>’s Worker’s Compensation premiums and those <strong>of</strong> surrounding jurisdictions.<br />
The <strong>District</strong>’s are reported to be as much as twice as high as Virginia or Maryland.<br />
3.2.4 LOOK<strong>IN</strong>G AHEAD: THE FUTURE OF THE DISTRICT’S <strong><strong>IN</strong>DUSTRIAL</strong> MARKET<br />
Continued Job Growth<br />
Industrial job growth in the Washington, D.C. Metro Area has consistently outperformed national<br />
averages by a full percentage point since 2001. The region’s rate <strong>of</strong> new industrial jobs per year<br />
is expected to grow 1.7 percent over this year, according to the Department <strong>of</strong> Labor and<br />
Bureau <strong>of</strong> Labor Statistics. Over the past five years, expansion <strong>of</strong> the industrial workforce has<br />
increased at higher rate than the development <strong>of</strong> new industrial inventory (6.00 percent to 5.20<br />
percent, respectively). 31<br />
These conditions indicate a high probability <strong>of</strong> stabilized or growing demand for the city and the<br />
possibility <strong>of</strong> further decreases in vacancy rates and increases in asking rents. However, it is<br />
also likely that much <strong>of</strong> this growth will pass the <strong>District</strong> by—existing industrial buildings don’t<br />
provide the amount <strong>of</strong> quality <strong>of</strong> space demanded by many tenants, and higher land costs will<br />
discourage speculative construction.<br />
Strengthening Competition<br />
Several submarkets near the <strong>District</strong> <strong>of</strong> Columbia are experiencing rapid growth in their<br />
industrial sectors. The Dulles Corridor area has added approximately 895,000 square feet <strong>of</strong><br />
new space since the beginning <strong>of</strong> 2005 with an additional 995,000 square feet currently under<br />
construction. The Manassas/I-66 submarket has increased its inventory by 461,000 square feet<br />
with over 100,000 square feet being built.<br />
29 TTFs are also referred to as Intermediate Materials Recycling Facilities.<br />
30 <strong>District</strong> <strong>of</strong> Columbia Municipal Regulations (DCMR), Sections 802.3-802.4.<br />
31 The CoStar Industrial Report.<br />
- 72 -
<strong>District</strong> <strong>of</strong> Columbia Industrial Areas Study DC Office <strong>of</strong> Planning<br />
Prepared by Phillips Preiss Shapiro Associates, Inc.<br />
These two areas are examples <strong>of</strong> the immense growth in many <strong>of</strong> the region’s suburban areas.<br />
During the same period <strong>of</strong> time, the <strong>District</strong> <strong>of</strong> Columbia did not witness any increases to its<br />
existing industrial capacity. As surrounding competitive markets grow, the range <strong>of</strong> options for<br />
size, rent, and amenities available in other locations will put added pressure on the <strong>District</strong> to<br />
expand incentive programs for downtown sites. For a number <strong>of</strong> industrial users, however,<br />
space in the <strong>District</strong> will hold a convenience, city access, and government amenities attraction<br />
that will not be undone by suburban <strong>of</strong>ferings.<br />
Limited Development Potential<br />
One <strong>of</strong> the major issues with the future <strong>of</strong> the <strong>District</strong> <strong>of</strong> Columbia’s industrial market is its<br />
limited ability to expand. As demonstrated above, other communities are creating industrial<br />
centers intended to provide expansion opportunities and to satisfy a variety <strong>of</strong> space<br />
requirements for the vast array <strong>of</strong> industrial users that coexist in this regional market. The<br />
<strong>District</strong> is limited by available land and space from supplementing its market in a similar manner.<br />
The <strong>District</strong>’s industrial market serves a critical role in the region’s industrial framework. It<br />
provides small industries with an opportunity to establish themselves with the support <strong>of</strong> the<br />
<strong>District</strong> government and reasonably affordable space. It also <strong>of</strong>fers convenience to downtown<br />
project sites and access to a concentrated workforce for construction, infrastructure-related<br />
industries, and manufacturing enterprises. The importance <strong>of</strong> these businesses and their<br />
associated space is not limited to the <strong>District</strong>, but extends to the health and strength <strong>of</strong> the<br />
region’s industrial future.<br />
3.2.5 IMPLICATIONS FOR THE STUDY<br />
The <strong>District</strong> is at a distinct competitive disadvantage in the regional industrial market. A May<br />
2006 analysis by the DC Office <strong>of</strong> Planning was particularly telling. 32 It noted that given current<br />
market trends, private firms would likely out-compete DC in the regional and local market. It is<br />
not realistic for DC to expect to house its essential public sector functions outside <strong>of</strong> its own<br />
borders—the market is too competitive and the space is too limited. Assuming the private sector<br />
absorbed the available space industrial within DC, then, in order to meet its public sector<br />
industrial land use needs, DC would have to capture 80 percent <strong>of</strong> the remaining space in the<br />
regional market! This would be a highly unlikely proposition for a fast-moving, deep-pocketed<br />
private investor; it would be impossible for a government actor with limited funds. This<br />
underlines the need to strategically plan for public sector land use needs.<br />
Furthermore, the <strong>District</strong>’s industrial inventory is generally characterized by a stagnant inventory<br />
and declining availability due to constrained land resources, declining vacancy rates, and a<br />
32 See Chart 6.1 in the Appendix <strong>of</strong> this report.<br />
- 73 -
<strong>District</strong> <strong>of</strong> Columbia Industrial Areas Study DC Office <strong>of</strong> Planning<br />
Prepared by Phillips Preiss Shapiro Associates, Inc.<br />
general lack <strong>of</strong> new development. Barring policy change, this situation is unlikely to change for<br />
the foreseeable future: rising rental rates will likely be insufficient to spur significant new<br />
construction or redevelopment <strong>of</strong> obsolete spaces by industrial developers. Long-term leases<br />
will also slow the rate <strong>of</strong> change in DC’s industrial zones. Finally, vacancy rates can be<br />
expected to continue to fall, but not to disappear. When vacancies do appear, they will typically<br />
be slow to fill: Rents do not support major rehabilitation; the ability to redesign buildings is<br />
limited; space for expansion is constrained; thus each tenant must be happy with the available<br />
space, loading docks, ceiling heights and floor loads.<br />
Any significant new investments are much more likely to be made by individual users:<br />
successful businesses with the internal incentive and wherewithal to assemble adjacent<br />
property and upgrade their operations. However, this will only happen in an environment where<br />
such investments can be made with the long term in mind; i.e., an environment where real<br />
estate speculation and the potential for encroaching residential development does not threaten<br />
the continued viability <strong>of</strong> industrial businesses or districts. This underlines the need to provide<br />
greater predictability in targeted industrial areas, so that property owners and developers can be<br />
reasonable certain as to which areas are likely to change, and which will remain stable havens<br />
for PDR use.<br />
3.3 SUB-AREA ANALYSIS<br />
In a mature and built-out city, the formulation <strong>of</strong> land use policy requires a detailed<br />
understanding <strong>of</strong> the current conditions on the ground. To this end, field surveys have been<br />
undertaken <strong>of</strong> all <strong>of</strong> the <strong>District</strong>’s industrially-zoned properties. The full results <strong>of</strong> these surveys<br />
are detailed on Existing Conditions maps, which appear in the Appendix to this report.<br />
The Office <strong>of</strong> Planning divided each <strong>of</strong> the <strong>District</strong>’s industrial zones 24 into sub-areas, named<br />
after defining features (such as CSX rail corridors); local landmarks (Fort Totten); and<br />
neighborhood names (Brookland). This report adopts these sub-areas as the organizing<br />
structure for the discussion <strong>of</strong> existing conditions. These sub-areas are illustrated on the key<br />
map in Section 2, with individual maps provided in the Appendix to illustrate existing uses and<br />
surrounding use patterns.<br />
Based on the field surveys and mapping, an Opportunities and Constraints matrix was prepared<br />
to assess particular attributes <strong>of</strong> each industrially-zoned sub area and to identify areas<br />
appropriate for retention strategies or for land use change, as well as to suggest specific<br />
strategies aimed at addressing identified issues. It was a useful tool in for weighing an area’s<br />
strengths, weaknesses, and any future development plans. The full matrix can be found in the<br />
Appendix to this report.<br />
- 74 -
<strong>District</strong> <strong>of</strong> Columbia Industrial Areas Study DC Office <strong>of</strong> Planning<br />
Prepared by Phillips Preiss Shapiro Associates, Inc.<br />
Next, each sub-area was scored to determine its overall fitness as an industrial area. Eleven<br />
scoring criteria were developed collaboratively by the Office <strong>of</strong> Planning and PPSA. A total <strong>of</strong><br />
55 points were possible (five points per criteria multiplied by 11 criteria). The criteria were:<br />
A. Predominant Adjacent Land Uses<br />
B. Interior Access/Circulation<br />
C. Existing Road Conditions<br />
D. Proximity to Highway<br />
E. Rail Freight Access<br />
F. Average Parcel Size<br />
G. Brownfield/Contamination<br />
H. Metro/Transit<br />
I. Existing Industrial User Concentration<br />
J. General Area Condition<br />
K. Building Stock<br />
This scoring exercise was meant to provide a quantitative basis for our findings. Descriptions <strong>of</strong><br />
scoring criteria and a matrix detailing the scores for each sub-area can be found in the<br />
Appendix.<br />
Based on the data from our field surveys, and reflecting on the scoring, opportunities, and<br />
constraints for each sub-area, PPSA formulated key findings for each sub area. These can be<br />
found at the conclusion <strong>of</strong> each sub-area analysis in the Appendix. For example, is the area a<br />
high-performing industrial zone or is it an island in the middle <strong>of</strong> residential areas? Is it a<br />
strategically important municipal services area with good highway and rail access? Is it a<br />
struggling area with many vacancies or is it thriving?<br />
3.4 OVERALL F<strong>IN</strong>D<strong>IN</strong>GS<br />
Out <strong>of</strong> the land use surveys, scoring exercise, and compilation <strong>of</strong> opportunities and constraints<br />
for each area, certain patterns began to emerge. For example, it was clear that some sub-areas<br />
faced imminent and growing redevelopment pressures from other land uses. Some areas<br />
contained a concentration <strong>of</strong> healthy PDR businesses, and some areas were relatively<br />
underutilized. Finally, there were some areas <strong>of</strong> friction where industrial uses abutted against<br />
incompatible land uses such as residences or new neighborhood development. Map 3.1<br />
illustrates these areas in distinct colors.<br />
- 75 -
<strong>District</strong> <strong>of</strong> Columbia Industrial Areas Study DC Office <strong>of</strong> Planning<br />
Prepared by Phillips Preiss Shapiro Associates, Inc.<br />
3.4.1 AREAS OF PRESSURE<br />
The <strong>District</strong>’s <strong>of</strong>fice development boom and housing market explosion has rapidly utilized many<br />
<strong>of</strong> the most desirable and easily accessible downtown development sites, and now real estate<br />
development forces are pressing heavily against industrial districts<br />
Nowhere is this more evident than in those areas near Metro stops and with relatively easilydeveloped<br />
lots. North <strong>of</strong> Union Station towards Florida Avenue, including the market area and<br />
the New York Avenue Metro stop, and at each successive Red Line Metro stop—Rhode Island<br />
Avenue, CUA/Brookland, Fort Totten, and Takoma—real estate pressures are growing.<br />
Rezoning requests trend towards these areas, and some larger initiatives including possible<br />
Planned Unit Developments in the NY/Florida Avenue Market area and along Eckington Place,<br />
as well as spin-<strong>of</strong>f from large initiatives such as NoMa and the H Street Corridor redevelopment<br />
are all increasing real estate values to the point where current PDR business area threatened.<br />
Map 3.2 illustrates known rezoning requests and major large initiatives. Areas <strong>of</strong> pressure are<br />
shown in light brown on Map 3.1.<br />
It makes sense that some <strong>of</strong> these areas be considered for land use change. In fact it is difficult<br />
to argue against well-planned transit oriented development in such an expensive, congested,<br />
built-out city such as the <strong>District</strong>, where household and job gains are projected to continue<br />
relatively unabated over the coming years. However, several areas under development<br />
pressure, such as the NY/Florida Avenue Market area, are more appropriate for an evolution or<br />
intensification <strong>of</strong> the existing land use, rather than a land use change.<br />
3.4.2 AREAS OF HEALTHY PDR FABRIC<br />
The sub-area existing conditions maps (found in the Appendix) reveal that some industrial<br />
zones contain a concentration <strong>of</strong> PDR businesses or municipal facilities. The businesses in<br />
these areas contribute to the <strong>District</strong> economy directly by providing products and services, but<br />
also by supporting the core economic sectors and providing much needed well-paying jobs. The<br />
municipal facilities located in these areas provide necessary services for the <strong>District</strong>’s growing<br />
residents and businesses (Map 2.2 locates concentrations <strong>of</strong> municipal facilities).<br />
We describe these as areas <strong>of</strong> “healthy PDR fabric.” All <strong>of</strong> these areas also exhibit good<br />
opportunities for continued or intensified PDR use and scored well in our industrial area scoring<br />
exercise (see the Opportunities and Constraints analysis matrix and the scoring matrix in the<br />
Appendix).<br />
Areas <strong>of</strong> healthy PDR fabric are shown in blue on Map 3.1. These areas include much <strong>of</strong> CSX1<br />
- Lamond Riggs south <strong>of</strong> the Metro, significant portions <strong>of</strong> Fort Totten and Brookland, and large<br />
swaths <strong>of</strong> New York/Ivy City and New York/Bladensburg. Some <strong>of</strong> these areas deserve land use<br />
protection, and some should be considered for municipal services. None <strong>of</strong> these, save perhaps<br />
a portion <strong>of</strong> land directly bordering New York Avenue, are appropriate for land use change.<br />
- 76 -
<strong>District</strong> <strong>of</strong> Columbia Industrial Areas Study DC Office <strong>of</strong> Planning<br />
Prepared by Phillips Preiss Shapiro Associates, Inc.<br />
3.4.3 AREAS OF UNDERUTILIZATION<br />
Many <strong>of</strong> the <strong>District</strong>’s industrial areas are underbuilt, have significant vacancies, or are<br />
otherwise underutilized—the existing conditions maps plainly reveal areas with few businesses<br />
and swaths <strong>of</strong> land used only for parking, junkyards, or railroad tracks. These areas are shown<br />
in olive green in Map 3.1.<br />
Vast areas <strong>of</strong> the CSX railroad yards are underutilized, as are large parcels including Fort<br />
Lincoln and portions <strong>of</strong> Bladensburg and Ivy City. Benning Road, 11th Street, SE, Water Street,<br />
SE, DC Village, Anacostia Poplar Point, and Scattered Site 1 are underutilized and present<br />
excellent sites in which to intensify current uses and strategically locate government facilities.<br />
Some may also be areas where the <strong>District</strong> could consider undertaking redevelopment activities<br />
as part <strong>of</strong> a coordinated plan. Ivy City near the Hecht Building may be one such location where<br />
<strong>District</strong> intervention could help jumpstart the upgrading and intensification <strong>of</strong> the area.<br />
3.4.4 AREAS OF FRICTION<br />
Lastly, it is apparent in some areas that PDR businesses and incompatible land uses are<br />
located in very close proximity to each other. Nuisance complaints about noise, pollution, and<br />
visual blight relating to PDR businesses are likely most prevalent in these areas, and it is logical<br />
to assume that expansion or retention <strong>of</strong> PDR uses in these zones may be difficult. These areas<br />
<strong>of</strong> friction are shown in red on Map 3.1.<br />
These places more or less correspond to areas where PDR businesses and residential<br />
communities flow almost seamlessly with little or no buffer. Notably, areas <strong>of</strong> healthy PDR fabric<br />
in Lamond Riggs, Fort Totten, and Brookland all experience friction with the residential<br />
communities on their eastern edges. In many cases there is not even a street, much less an<br />
alley or fence line, dividing these two land uses. Most other areas <strong>of</strong> friction occur where the<br />
industrial land is underutilized. The protection and/or intensification <strong>of</strong> current PDR uses in<br />
these areas (e.g. Lamond Riggs) would require buffer considerations; on the other hand, land<br />
use changes may be more appropriate in some areas (e.g. CSX2-Kennilworth).<br />
3.5 SUMMARY<br />
This section has described in detail the existing conditions <strong>of</strong> the <strong>District</strong>’s industrial land,<br />
through both a real estate market lens and a detailed land use planning analysis. Building upon<br />
the important concepts delineated in Section 2, Section 3 informs the report’s determination <strong>of</strong><br />
PDR suitability and whether the area bears protection for continued PDR use. The detailed land<br />
use recommendations that are the culmination <strong>of</strong> this report follow now in Section 4.<br />
- 77 -
<strong>District</strong> <strong>of</strong> Columbia Industrial Areas Study DC Office <strong>of</strong> Planning<br />
Prepared by Phillips Preiss Shapiro Associates, Inc.<br />
4 Recommendations<br />
The recommendations herein build from the previous chapters <strong>of</strong> this report by considering the<br />
need for and importance <strong>of</strong> appropriate industrial land in the <strong>District</strong>, the supply and demand for<br />
industrial land and buildings, and the overall findings resulting from the land use surveys and<br />
sub-area analyses described above. They are intended for two purposes: (1) as a guide to<br />
zoning policy as it relates to industrially-zoned land; and (2) as a guide to strategies the <strong>District</strong><br />
can undertake to maintain and enhance its base <strong>of</strong> PDR employment. Item one speaks directly<br />
to land use; item two has both land use and policy components.<br />
Simply put, this study revealed that the <strong>District</strong>’s existing zoning framework regarding<br />
industrially zoned land requires modernization. As a result, this chapter begins by positing a<br />
new zoning framework for industrial land, which is then referenced in subsequent sections. This<br />
framework is in direct response to deficiencies identified in the existing zoning categories and<br />
regulations, and is designed to address the issues outlined in the previous sections <strong>of</strong> this<br />
report. The recommendations for different industrial sub-districts cannot be adequately<br />
implemented within the existing zoning framework. The new framework keeps the existing zone<br />
districts, with modifications, but recommends two additional zoning districts to be added to the<br />
zoning ordinance and map.<br />
These recommendations were not made arbitrarily or without great consideration—each<br />
recommendation followed a discernible logic. First, based on information compiled from the<br />
user’s survey, technical advisory committee, market analysis, economic analysis, and fieldwork,<br />
PPSA and OP analyzed the <strong>District</strong>’s “heavy” land use needs. Second, using fieldwork, the<br />
opportunities and constraints and scoring matrices (both described Section 3) and PPSA’s<br />
pr<strong>of</strong>essional judgment, we analyzed the study areas’ suitability for continued PDR use. Areas<br />
deemed suitable were analyzed to determine whether they were more appropriate for private (or<br />
market driven) or public (municipal) use. Areas unsuitable for continued PDR use (e.g. areas<br />
near Metro stations) were considered for land use changes. Discussed in Section 1.2 and<br />
reproduced here, Figure 4.1 clearly illustrates this logic:<br />
- 78 -
<strong>District</strong> <strong>of</strong> Columbia Industrial Areas Study DC Office <strong>of</strong> Planning<br />
Prepared by Phillips Preiss Shapiro Associates, Inc.<br />
Figure 4.1: Recommendations Logic Path<br />
Thus, the <strong>District</strong>’s industrial areas were divided into four categories based on the appropriate<br />
policy response. Sections 4.2 through 4.5 set forth our recommendations based on the following<br />
policy responses:<br />
Retention and reinforcement: Intended for areas that exhibit healthy PDR fabric,<br />
provide a significant concentration <strong>of</strong> support services and PDR jobs, and have good<br />
prospects for continuing to host viable PDR businesses into the future. A new zoning<br />
category is proposed for most <strong>of</strong> these areas, except for areas <strong>of</strong> intense uses, which<br />
would be zoned M.<br />
Intensification/evolution: This category is for areas where PDR use exists and<br />
continues to be desirable, but where intensification is warranted due to a pattern <strong>of</strong><br />
underutilization, and where non-PDR uses are an appropriate part <strong>of</strong> the overall land use<br />
mix. These areas are most appropriate for C-M zoning.<br />
Strategic for public use: Certain industrial areas have been identified as appropriate<br />
areas to accommodate municipal/government/utility space needs. Other uses are not<br />
precluded, but these are potential priority areas for public acquisition and reuse. In most<br />
cases, zoning can remain the same as the current condition.<br />
- 79 -
<strong>District</strong> <strong>of</strong> Columbia Industrial Areas Study DC Office <strong>of</strong> Planning<br />
Prepared by Phillips Preiss Shapiro Associates, Inc.<br />
Land use change: These are areas where a move away from PDR use is appropriate,<br />
due to a lack <strong>of</strong> viable PDR businesses, and the desirability <strong>of</strong> these sites for other uses.<br />
In most cases, residential development is contemplated. There are two sub-categories<br />
within this category: areas where a gradual replacement <strong>of</strong> PDR use with residential is<br />
envisioned (letting the market take its course); and areas where PDR should essentially<br />
be zoned away. Many <strong>of</strong> these areas are proposed for a new zoning district permitting<br />
both residential and light PDR uses such as storage and light fabrication.<br />
The next section addresses the issue <strong>of</strong> government facilities, with a particular emphasis on the<br />
<strong>District</strong>’s municipal space needs. A prior section addressed particular location where public uses<br />
might be sited; this section addresses the policy and programmatic side <strong>of</strong> meeting public<br />
needs. To this end, the section addresses systems <strong>of</strong> property and resource management and<br />
various methods <strong>of</strong> increasing the efficiency <strong>of</strong> public properties and resources. Given the<br />
scarcity <strong>of</strong> both land and public funds, ways <strong>of</strong> doing more with less are a major focus.<br />
While this report sets forth a detailed policy with respect to industrial land use, land use<br />
decisions not foreseen by this report may also need to be brought before the relevant <strong>District</strong><br />
bodies such as the Zoning Commission. Thus the final section <strong>of</strong> this chapter provides a set <strong>of</strong><br />
criteria for evaluating future proposals for land use change which impact industrial areas.<br />
4.1 A NEW ZON<strong>IN</strong>G FRAMEWORK FOR PDR<br />
The existing zoning ordinance has two types <strong>of</strong> industrial district. The C-M districts permit retail,<br />
<strong>of</strong>fice and industrial uses, with permitted FARs ranging from 3.0 to 6.0. The M district permits<br />
everything permitted in the C-M district, but extends the permitted uses to encompass anything<br />
not specifically prohibited, and has a maximum FAR <strong>of</strong> 6.0.<br />
There are several issues with this zoning scheme:<br />
It does nothing to prohibit retail or <strong>of</strong>fice uses from overtaking industrial areas and<br />
displacing PDR tenants.<br />
The bulk standards bear little resemblance to the low-scale, high-coverage built<br />
environments found within these districts.<br />
It is somewhat vague as to what precisely is permitted in the M district: it may be fully<br />
specified in theory, but multiple trips around the zoning ordinance are required to try to<br />
figure this out.<br />
The performance standards for industrial areas need modernization.<br />
A variety <strong>of</strong> industrial zoning strategies were reviewed for this report, some <strong>of</strong> which are esoteric<br />
in their application, many <strong>of</strong> which were formulated for use in big cities with a significant<br />
industrial and manufacturing past. The strategies proposed here, while representing a<br />
- 80 -
<strong>District</strong> <strong>of</strong> Columbia Industrial Areas Study DC Office <strong>of</strong> Planning<br />
Prepared by Phillips Preiss Shapiro Associates, Inc.<br />
substantial modification to the existing zoning categories, are nonetheless fairly straightforward<br />
in concept, involving a retooling <strong>of</strong> the existing zones and an addition <strong>of</strong> new additional zones.<br />
General outlines for these new and modified districts are provided—specific standards will<br />
require additional study and analysis by OP, and deliberation by the Zoning Commission.<br />
One concept worth exploring further is the Planned Manufacturing <strong>District</strong> (PMD) overlay<br />
developed by the City <strong>of</strong> Chicago. Application <strong>of</strong> a PMD district to an existing industrial area<br />
carries with it a strong presumption that the area is <strong>of</strong>f-limits to rezoning for residential use. This<br />
concept could be adopted by the <strong>District</strong> to further strengthen the zoning proposals presented<br />
below. This and other zoning case studies are presented here in the accompanying case<br />
studies.<br />
- 81 -
<strong>District</strong> <strong>of</strong> Columbia Industrial Areas Study DC Office <strong>of</strong> Planning<br />
Prepared by Phillips Preiss Shapiro Associates, Inc.<br />
Sample Industrial Land Use Policies<br />
While the <strong>District</strong> is unique in its economy, function, and political status, other American cities<br />
are facing many <strong>of</strong> the same land use pressures. This report has considered other cities’<br />
perspectives and industrial land use policies, and, in some cases, borrowed best practices from<br />
their experiences.<br />
San Francisco, CA: Production, Distribution, and Repair 33<br />
San Francisco is similar to the <strong>District</strong> in several ways, notably in that it is also a city with very limited<br />
amounts <strong>of</strong> land and where industrial land is under pressure from “higher and better” uses including<br />
housing and high-tech sector <strong>of</strong>fices. Recognizing the need to develop appropriate land use policies to<br />
accommodate industry, housing, and <strong>of</strong>fice development, the San Francisco Planning Department<br />
completed a study <strong>of</strong> its industrial areas in 2002. Its study resulted in a new framework with which to view<br />
the import <strong>of</strong> industry to the city’s economy. Instead <strong>of</strong> using the term “industrial,” which conjures images<br />
<strong>of</strong> heavy “smoke-stack” industry, the terms production, distribution and repair (PDR) are used.<br />
Production uses include building contractors, printing firms, and light manufacturers such as specialty<br />
signs and building mechanical systems. Distribution includes warehousing, trucking, wholesaling, and<br />
retailing operations which cater both industries and public. It is essential that these firms have good<br />
access to rail and road transportation. Finally, Repair includes building systems and automobile repair,<br />
including municipal fleet maintenance garages, and serves both other industrial users as well as the<br />
general public.<br />
The report recognizes that PDR businesses provide fast and efficient support services for core sectors <strong>of</strong><br />
the San Francisco economy (including property development, tourism and hospitality), that PDR provides<br />
employment options for skilled and unskilled residents without advanced degrees, and that PDR helps<br />
stabilize the local economy and reduce some <strong>of</strong> the costs <strong>of</strong> doing business in the city. The report urges<br />
land use planning that considers the needs (space that is affordable, flexible, and away from housing) <strong>of</strong><br />
PDR users.<br />
Chicago, IL: Planned Manufacturing <strong>District</strong>s 34<br />
Chicago’s experience in the 1980s was very similar to what the <strong>District</strong> is experiencing today. Rezonings<br />
in and around Chicago’s manufacturing areas allowed residential and commercial land uses to encroach<br />
upon industry. Throughout the 1980s, as rezonings became commonplace, manufacturers had less and<br />
less confidence that they could safely invest their capital on in-place expansion. Thus a dwindling supply<br />
<strong>of</strong> appropriate land, combined with high taxes and labor costs, conspired to drive more and more industry<br />
from the city.<br />
33 See San Francisco Planning Department, 2002<br />
34 Adapted from Appendix B, Pratt Institute Center for Community and Environmental Development, 2001.<br />
See also University <strong>of</strong> Wisconsin-Milwaukee, 2005.<br />
- 82 -
<strong>District</strong> <strong>of</strong> Columbia Industrial Areas Study DC Office <strong>of</strong> Planning<br />
Prepared by Phillips Preiss Shapiro Associates, Inc.<br />
The city determined that losing industry meant losing good jobs in the Chicago area, permanently<br />
displacing <strong>of</strong> many skilled industrial workers, and sacrificing business activity that had an important role in<br />
Chicago’s economy. In order to retain these important businesses within the city, in 1988 the city created<br />
the Planned Manufacturing <strong>District</strong> (PMD), a special zoning designation which creates an “industrial<br />
sanctuary.”<br />
A PMD designation preserves the existing industrial character <strong>of</strong> an area. It maintains the underlying<br />
zoning’s bulk restrictions, therefore preserving density, but does not include design standards to enhance<br />
quality. The PMD’s main action is to place significant additional use restrictions on the industrial or<br />
manufacturing land and place restrictions on the rezoning <strong>of</strong> industrial land for non-industrial uses.<br />
“Supplementary Regulations” specifying these uses restrictions, as well as other restrictions, are<br />
developed and adopted by the city council for each area when a PMD district is applied to the zoning<br />
map. Any change in the PMD ordinance requires the approval <strong>of</strong> city council. PMD regulations are<br />
district-specific – this allows for targeted regulations, but varying district-by-district regulations make the<br />
program challenging to enforce.<br />
Three PMDs were established in existing industrial areas between 1988 and 2000. Currently, the city has<br />
13 PMDs. The city also has established “Industrial Corridors,” planning districts proposed by the city as<br />
part <strong>of</strong> a comprehensive industrial land use policy to be implemented through zoning review and targeted<br />
public investments. The corridors do not make up all the industrial land in Chicago, but represent key<br />
concentrations <strong>of</strong> industrial investment and employment. Industrial retention and preservation programs<br />
include low-interest loans for industrial firms, business infrastructure assistance, enterprise zone<br />
incentives, and tax increment financing. Additionally, the city targets capital improvement dollars to<br />
support industrial infrastructure including bridges, viaducts, and streets.<br />
The PMD experience has not been problem free or totally successful, but, in terms <strong>of</strong> business retention<br />
and job creation, they have performed well. Some neighborhood opposition to PMDs meant that the<br />
designations could not be imposed lightly, and that a participatory process with businesses and<br />
surrounding residents yielded better sustainability and more support.<br />
New York, NY: Proposals for Manufacturing Development Zones and Industrial Business Zones 35<br />
Finally, New York City, where, perhaps more than anywhere else, land is at a premium, is only now<br />
realizing that equitable development and a sustainable economy are founded in part on a comprehensive<br />
industrial land use policy.<br />
In its 2001 report on manufacturing land use in New York City, the Pratt Center concluded that<br />
Manufacturing Development zones be established in areas that have strong concentrations <strong>of</strong><br />
manufacturing to give extra protection and support to manufacturing businesses. MD zones would overlay<br />
the existing industrial zoning and would, to varying degrees, restrict the location <strong>of</strong> non-industrial uses,<br />
especially residential conversions. MD zones would require that commercial, auto-related, and other nonmanufacturing<br />
uses currently permitted as <strong>of</strong> right, but which have the potential to create negative<br />
35 See “Recommendations,” in Pratt Institute Center for Community and Environmental Development,<br />
2001. See also City <strong>of</strong> New York, 2005.<br />
- 83 -
<strong>District</strong> <strong>of</strong> Columbia Industrial Areas Study DC Office <strong>of</strong> Planning<br />
Prepared by Phillips Preiss Shapiro Associates, Inc.<br />
impacts, would need a special permit. Such uses include utilities, solid waste facilities, and parking as a<br />
principal use.<br />
New York City Mayor Michael Bloomberg’s <strong>of</strong>fice in 2005 issued a report outlining the industrial policies <strong>of</strong><br />
the city in order to create “best-in-class” industrial zones. It stated that Industrial Business Zones (IBZ)<br />
should be drawn to include areas that “can best support vibrant industrial business districts with<br />
competitive advantages over industrial districts in other parts <strong>of</strong> the metropolitan region.” The policy<br />
outlines several critical industrial retention and protection strategies, including, (1) the Bloomberg<br />
Administration pledges that it will not rezone IBZs to allow residential use, (2) Additional incentives for<br />
businesses relocating from within the city to an IBZ will be created, (3) Area-planning studies for each IBZ<br />
will be conducted, and (4) IBZs will be marketed to new, expanding, or relocating businesses.<br />
The city would also undertake additional initiatives to safeguard industrial land, including, (1) discourage<br />
illegal conversions, (2) lower costs <strong>of</strong> development and expansion with incentives and funding, including<br />
an expansion <strong>of</strong> Industrial Development Agency assistance, (3) launch a commercial fleet parking<br />
violations program, (4) create a dumpster shed program, (5) form an industrial energy Consumer<br />
Coalition, and (5) administer a biannual Industry NYC survey to identify key trends and measure the<br />
effectiveness <strong>of</strong> city programs.<br />
The PMD Zones or IBZ proposals are good examples <strong>of</strong> zoning strategies to protect industrial users and<br />
foster industrial development.<br />
- 84 -
<strong>District</strong> <strong>of</strong> Columbia Industrial Areas Study DC Office <strong>of</strong> Planning<br />
Prepared by Phillips Preiss Shapiro Associates, Inc.<br />
The proposed new zoning framework for the <strong>District</strong> <strong>of</strong> Columbia’s industrial areas is as follows:<br />
4.1.1 C-M DISTRICTS<br />
Only minor modifications are proposed to the C-M district regulations. The general intent <strong>of</strong> the<br />
district—to permit a variety <strong>of</strong> retail, <strong>of</strong>fice, and industrial/PDR uses—remains unchanged.<br />
However, the following amendments are proposed:<br />
Prohibiting high-impact industries such as intermediate materials recycling and solid<br />
waste handling facilities, to limit the possibility <strong>of</strong> land use conflicts.<br />
Prohibiting certain community uses that detract from the commercial or PDR nature <strong>of</strong><br />
the area and which present immediate conflicts with their PDR neighbors, specifically,<br />
charter schools and emergency shelters.<br />
Making retail uses above a certain size (say, 50,000 square feet) special exception uses<br />
to provide more control over their location.<br />
Bulk standards in the C-M-1, C-M-2, and C-M-3 district can be left unchanged subject to further<br />
review. Continued C-M zoning is contemplated for areas where a mixing <strong>of</strong> industry, <strong>of</strong>fice and<br />
retail is appropriate, such as the New York Avenue corridor in the vicinity <strong>of</strong> the Hecht Building.<br />
4.1.2 M DISTRICT<br />
The M district should be retooled to serve as an industry-only district specifically permitting<br />
heavy and intense industrial uses such as cement and asphalt batching, and prohibiting other<br />
categories <strong>of</strong> commercial use. These uses would be subject to strict performance and location<br />
standards (not within certain distances <strong>of</strong> residential districts, for example). The M district would<br />
find limited application in the few areas where such intense use is already found. An example is<br />
the area south <strong>of</strong> Fort Totten Metro, where cement and asphalt batching, as well as a municipal<br />
waste transfer station, are found.<br />
4.1.3 IP <strong><strong>IN</strong>DUSTRIAL</strong> PARK DISTRICT<br />
The IP district would be a new district specifically geared towards healthy industrial areas that<br />
would benefit from more coordinated planning. It would differ from suburban industrial park<br />
zoning in that bulk and coverage regulations would be tailored for older industrial areas<br />
characterized by low height and high site coverage. It differs from the Chicago PMD model in<br />
that it does not overlay existing zoning, but instead creates a new designation with its own use<br />
and bulk restrictions. Like the M district, this new IP district would emphasize industry at the<br />
expense <strong>of</strong> other commercial uses. However, certain types <strong>of</strong> <strong>of</strong>fice and retail would be<br />
permitted:<br />
- 85 -
<strong>District</strong> <strong>of</strong> Columbia Industrial Areas Study DC Office <strong>of</strong> Planning<br />
Prepared by Phillips Preiss Shapiro Associates, Inc.<br />
Retail accessory to a PDR use (such as a wholesaler with a small retail operation, or a<br />
manufacturer selling goods on site).<br />
Offices accessory to a PDR use.<br />
Eating places, which would help serve the worker population’s needs.<br />
Areas where IP zoning would be appropriate would include Chillum Place and the Florida<br />
Avenue Wholesale Market. The latter requires special consideration, and may in fact merit its<br />
own special-purpose overlay district.<br />
4.1.4 MXD MIXED-USE DISTRICT<br />
The MXD permits residential, commercial and light PDR uses, for a truly mixed use approach.<br />
This district is intended for the following types <strong>of</strong> areas:<br />
Funky areas where live/work arrangements combining residential with craft trades or the<br />
visual and performing arts is appropriate.<br />
Areas that are surrounded by and/or will likely trend to residential uses, but where there<br />
are existing PDR businesses that should not be rendered non-conforming by a change<br />
<strong>of</strong> zoning.<br />
Areas where the direction is unclear and therefore better left to the marketplace.<br />
The types <strong>of</strong> PDR uses contemplated for these zones would be things such as self-storage,<br />
printing, craft occupations such as furniture making and cabinetry, and light fabrication. More<br />
than any other district, appropriate performance standards would be essential. And, mixed-use<br />
zoning requires vigilant enforcement <strong>of</strong> regulations to ensure mixed-uses remain “good<br />
neighbors” to each other. 36 Areas where MXD zoning would be appropriate would include<br />
Scattered Site 2, a healthy industrial enclave entirely surrounded by residential; and portions <strong>of</strong><br />
the Fort Totten area, where a mix <strong>of</strong> industry and residential is already the norm. 37<br />
36 The automobile repair and service industry is a good example <strong>of</strong> where better enforcement is<br />
desperately needed. The visual blight, overcrowding <strong>of</strong> sites, hazardous and polluting waste, illegal<br />
parking, rodent harborages, damage to sidewalks, and polluting painting facilities that are frequently<br />
associated with this industry are all deterrents to business and residential investment in areas which<br />
otherwise have the potential to encourage mixed-use development.<br />
37 DC might also consider introducing MXD zoning into C-zoned areas that contain a mix <strong>of</strong> PDR,<br />
commercial, and residential uses already, or where encouraging that type mix is desirable. Identifying<br />
such areas was beyond the scope <strong>of</strong> this study, but, given the fast-paced development climate and the<br />
Comprehensive Plan goals for growing an inclusive city, it is logical to have an MXD use code in the<br />
zoning toolkit for areas not in established industrial corridors.<br />
- 86 -
<strong>District</strong> <strong>of</strong> Columbia Industrial Areas Study DC Office <strong>of</strong> Planning<br />
Prepared by Phillips Preiss Shapiro Associates, Inc.<br />
This new zoning framework provides a flexible approach to managing change in DC’s industrial<br />
areas. The zoning avoids large-scale shifts which would engender property owner resistance. It<br />
envisions that these districts would only be mapped in areas where the proscribed land uses<br />
predominate. The proposed MXD district actually provides greater property owner flexibility in<br />
contemplating use options. Finally, the proposed zoning provides greater protection for existing<br />
and future PDR users, which should help promote a more stable climate, and less speculation,<br />
in key industrial areas.<br />
4.2 AREAS TARGETED FOR <strong><strong>IN</strong>DUSTRIAL</strong> RETENTION<br />
4.2.1 DESCRIPTION OF THE AREAS<br />
Map 4.1 shows those areas recommended for retention and reinforcement as PDR zones.<br />
There are seven discrete areas in total. These include portions <strong>of</strong> CSX1 Lamond Riggs, CSX1<br />
Fort Totten, CSX1 Brookland, CSX1, New York/Florida, New York/Ivy City, New<br />
York/Bladensburg, and Scattered Site 3. Each discrete area targeted for retention is numbered.<br />
For the purposes <strong>of</strong> this section and those that follow, the cumbersome sub-area names are<br />
jettisoned, and each area is referred to by its number on the relevant map. 38<br />
Area 1 corresponds to the southern portion <strong>of</strong> CSX1 Lamond Riggs, and includes Chillum<br />
Place. This area deserves consideration because <strong>of</strong> it is intensively used by PDR businesses. It<br />
is zoned C-M-1. There are very few vacancies in this area, and the building and site conditions<br />
are all favorable for PDR businesses. Many <strong>of</strong> these businesses, such as building supply and<br />
maintenance and shipping/warehousing, support key sectors <strong>of</strong> the district economy. Others,<br />
such as sign-makers and light fabricators, provide well-paying jobs. This well-tenanted, highemployment<br />
industrial area could be enhanced with an in-place industrial park strategy to<br />
preserve existing users and provide for roadway and infrastructure improvements.<br />
Area 2 corresponds to the southern stretch <strong>of</strong> CSX1 Fort Totten, and includes heavy industries<br />
(asphalt and cement), light fabrication businesses, and support services such as warehousing. It<br />
is zoned FT/M, FT/C-M-1, and R-5-A. Site conditions are generally fair, but residential buffering<br />
should be sought. (This is all the more urgent as the Rocky Gorge residential townhouse<br />
development is sure to move forward on the site south <strong>of</strong> the Metro, between Park Service land<br />
and Thomas Somerville Co.) Similarly, portions <strong>of</strong> CSX 1 Brookland (zoned C-M-1) and CSX 1<br />
(C-M-2) are home to warehousing and support services such as building and maintenance<br />
trades. While the cement mixing operations are poorly sited in the vicinity <strong>of</strong> the Fort Totten<br />
metro station, there are no alternative sites for such a NIMBY use. The same is true <strong>of</strong> the<br />
waste transfer station just to the south. Buffers should be provided, in the form <strong>of</strong> mixed<br />
residential / light industry (MXD) at the Metro Station and including the Rocky Gorge residential<br />
38 Also, detailed existing conditions/inventory maps and descriptions <strong>of</strong> the sub-areas can be found in the<br />
Appendix and are an important compendium to each <strong>of</strong> the target area discussions below.<br />
- 87 -
<strong>District</strong> <strong>of</strong> Columbia Industrial Areas Study DC Office <strong>of</strong> Planning<br />
Prepared by Phillips Preiss Shapiro Associates, Inc.<br />
site, in part to create a more hospitable environment for transit users, but surely to protect<br />
existing industries from nuisance complaints.<br />
Area 3 is the same as Scattered Site 3. Located near Howard University, Area 3 presents an<br />
opportunity to build on the Hospital and other investments made by the University and reinforce<br />
the medical research industry in the <strong>District</strong>. The area boasts a top employer (the University<br />
Hospital), well-paying jobs, and easy access. Also considering that several large buildings are<br />
ripe for re-use and that real estate pressure in this area are growing, this area needs PDR<br />
protection. It is now zoned C-M-2 and C-M-3.<br />
Area 4 includes the southern part <strong>of</strong> CSX 1 Brookland and a portion <strong>of</strong> CSX 1 north <strong>of</strong> Rhode<br />
Island Avenue. Uses found here include catering, a bakery, and variety <strong>of</strong> PDR support<br />
services: commercial uniforms, storage, industrial hardware, auto repair, and construction<br />
contracting. A portion <strong>of</strong> CSX 1 that corresponds to a small shopping center and a proposed<br />
mixed-use development around the Rhode Island Avenue Metro is excluded. This area<br />
generally intensively utilized with only a few vacancies. A row <strong>of</strong> residential buildings fronting on<br />
10 th Street will require some protection from these adjacent uses.<br />
Area 5, the northwestern portion <strong>of</strong> New York Avenue/Ivy City, is home to a concentration <strong>of</strong><br />
television and telecommunications businesses, including Verizon and BET (Black Entertainment<br />
Television). This area is zoned M. It <strong>of</strong>fers a combination <strong>of</strong> large sites and relatively difficult<br />
access, which actually works well for its current users—remote and guarded areas provide good<br />
security for high value equipment like satellite/microwave receivers. It is an exciting example <strong>of</strong><br />
how the <strong>District</strong> could capture the television and telecom industry within its borders. The area<br />
can be a center for innovation and creative, well-paying jobs.<br />
Area 6, the northern and eastern portions <strong>of</strong> New York Avenue/Florida, also merits retention as<br />
industrial. These are zoned C-M-2, M, and C-M-1, and are home to a concentration <strong>of</strong><br />
transportation uses, including busing and taxi/limo maintenance, electrical and building trades,<br />
and the New York/Florida Wholesale Market. The Wholesale Market area creates value for the<br />
<strong>District</strong> and should continue to benefit from its proximity to the New York Avenue Metro. This is<br />
prime example <strong>of</strong> where policies encouraging shared loading, docking, parking, and security<br />
could benefit all businesses. This wholesale market is a major source <strong>of</strong> employment, important<br />
to the cost-effectiveness <strong>of</strong> the hospitality and restaurant sectors. It is also a cost-saving place<br />
for lower- and moderate-income residents to buy produce and products. Given its access as<br />
well as new housing and <strong>of</strong>fice development and renewal nearby, the area could evolve into a<br />
real destination, which is all the more reason to protect it from rampant real estate speculation.<br />
Area 7, encompassing most <strong>of</strong> New York Avenue/Bladensburg north <strong>of</strong> the CSX/Amtrak rail<br />
line, should be reinforced as a PDR zone. Zoning is now M, C-M-1, and C-M-2. V Street, NE, in<br />
particular represents an exciting, vibrant PDR zone—businesses include light industrial, building<br />
support services such as electrical contracting, several medical <strong>of</strong>fices and research labs such<br />
- 88 -
<strong>District</strong> <strong>of</strong> Columbia Industrial Areas Study DC Office <strong>of</strong> Planning<br />
Prepared by Phillips Preiss Shapiro Associates, Inc.<br />
as the police forensics and crime scene lab, a large beer storage and distribution warehouse,<br />
and catering and food distribution services. Other users include the DC Fire Department (supply<br />
and storage), Washington Hospital (printing services), and a creative arts center. This is an<br />
excellent opportunity for an in-place industrial park, given the high intensity <strong>of</strong> use and its<br />
relative isolation.<br />
4.2.2 ZON<strong>IN</strong>G STRATEGIES<br />
M, C-M and IP zoning are recommended for different areas targeted for retention.<br />
Areas 1 and 4 are appropriate for the new IP category. These areas are nearly exclusively<br />
occupied by PDR businesses. Unlike some other areas, they form cohesive industrial districts<br />
that have a recognizable identity and easily ascertained borders. Protection from non-PDR use<br />
is appropriate, particularly for Area 1, which could easily feel residential pressures. In fact, part<br />
<strong>of</strong> Area 4, south <strong>of</strong> Michigan Avenue, is already operating as an industrial park, but it lacks the<br />
protection <strong>of</strong> an actual zoning designation.<br />
Area 2 is appropriate for the retooled M district. The area is characterized by heavy uses such<br />
as cement and asphalt batching and waste transfer. It represents one <strong>of</strong> the only areas in the<br />
<strong>District</strong> capable <strong>of</strong> accommodating such uses, although the Rocky Gorge residential<br />
development plans is a hindrance to this. Because <strong>of</strong> the existing use pattern, the introduction <strong>of</strong><br />
other types <strong>of</strong> uses such as Rocky Gorge would likely result in nuisance complaints, making the<br />
retooled M zone is all the more important.<br />
Areas 3, 5, and Area 7 are recommended for C-M zoning. Area 3 includes Howard University<br />
Hospital and some related uses, and should be zoned to accommodate research and medical<br />
<strong>of</strong>fice facilities. Area 5 already has a large <strong>of</strong>fice building occupied by BET as well as<br />
broadcasting, TV production and telecommunications uses. The portion <strong>of</strong> Area 7 that includes<br />
the V Street, NE corridor should be designated C-M.<br />
Area 6, corresponding to the Florida Avenue Wholesale Market, is tentatively recommended for<br />
the IP district. However, this area is so unique that it may require its own special district to<br />
adequate regulate the diverse array <strong>of</strong> uses found in the area. In particular, whatever zoning is<br />
adopted should not restrict the ability <strong>of</strong> the wholesalers in this market to also engage in retail<br />
sales. It is this bazaar-like quality that gives this area its particular appeal and charm. The<br />
unique character <strong>of</strong> this area and its potential as a regional destination may warrant a special<br />
study to outline potential planning and development initiatives to enhance its existing functions.<br />
4.2.3 RETENTION PROGRAMS<br />
One way to retain PDR businesses and encourage their long-term viability is to establish<br />
industrial parks or industrial business improvement districts (iBIDs). These strategies would<br />
- 89 -
<strong>District</strong> <strong>of</strong> Columbia Industrial Areas Study DC Office <strong>of</strong> Planning<br />
Prepared by Phillips Preiss Shapiro Associates, Inc.<br />
work especially those areas with multiple-ownership, such as Chillum Place in Area 1. Industrial<br />
park strategies include shared loading and parking, shared security and marketing, and<br />
perimeter fencing and buffering. Wherever possible iBIDs should be set up to govern<br />
management and provide special services such as waste hauling and recycling.<br />
These areas should be targeted by the <strong>District</strong> for employment and job training programs. The<br />
DC ARCH program, which has had great success Ward 8, and the DC-area ACE Mentors<br />
program, are model programs for training and engaging young people in the workforce. Also<br />
deserving <strong>of</strong> consideration is the Back Streets program in Boston, which focuses on retaining<br />
industrial area businesses (“Back Street,” as opposed to “Main Street,” businesses) in the city. It<br />
provides real estate services (site finding), job training and work force development, and special<br />
loan programs.<br />
Market development support is another form <strong>of</strong> retention assistance the city could provide. New<br />
tools could be developed to help small <strong>District</strong>-based PDR firms obtain additional contracts with<br />
major purchasers <strong>of</strong> PDR services, including federal and local government, the hospitality<br />
industry, non-pr<strong>of</strong>it institutions, construction companies, and property management firms. For<br />
example, technical assistance could be provided, either directly or through partnerships with<br />
existing business assistance organizations (e.g., SBA’s Sub-Net program described in Section<br />
2.1), to help PDR businesses bid on government and corporate procurement contracts. Or a<br />
buyer-supplier match program that connects local buyers <strong>of</strong> products and services with local<br />
suppliers could be established. These types <strong>of</strong> activities support retention by increasing<br />
company sales and pr<strong>of</strong>itability.<br />
- 90 -
<strong>District</strong> <strong>of</strong> Columbia Industrial Areas Study DC Office <strong>of</strong> Planning<br />
Prepared by Phillips Preiss Shapiro Associates, Inc.<br />
Sidebar: Sample Policies<br />
Job Training and Employment in Washington, DC<br />
ARCH (Action to Rehabilitate Community Housing) was established in Historic Anacostia in 1986 as a<br />
training-oriented development organization. ARCH began as an organization to encourage and train<br />
DC’s ‘at risk' residents in academic and carpentry skills while rehabilitating residential property in<br />
Anacostia. Today, ARCH has evolved to provide services including assessment, job training, career<br />
development, up-to- date technology, and personal counseling to ensure individuals and families access<br />
to quality education, livable wage jobs, cultural activities, affordable housing, neighborhood businesses,<br />
effective health and social services; while supporting the successful transition to a life-long journey <strong>of</strong><br />
education, self-sufficiency, and community awareness.<br />
In 2003, ARCH finished a five-year development project on a new home in the historic Woolworth<br />
building; the new facility is a state <strong>of</strong> the art school with 16,000 square feet <strong>of</strong> usable space. The new<br />
training center's top floor <strong>of</strong>fers academic classrooms, computer classrooms and computer labs with highspeed<br />
Internet access. The training center has locker areas, large lunchrooms, the skills lab, our version<br />
<strong>of</strong> a lecture room and <strong>of</strong>fices for our teachers, counselors and caseworkers. Next door to the school is<br />
ARCH's Career Services Department and Executive <strong>of</strong>fices, along with a small computer lab for students<br />
working with Job Developers – for a total <strong>of</strong> 20,000 square feet utilized for academics, training,<br />
counseling and career development. Visit http://www.archdc.org/ for more information.<br />
ACE Mentors: Developing New Pr<strong>of</strong>essionals<br />
Founded by principals <strong>of</strong> leading design and construction firms, ACE is an after-school mentoring<br />
program for high school students interested in exploring career opportunities in architecture, engineering<br />
and construction management. Comprised <strong>of</strong> a “unique partnership <strong>of</strong> schools and universities,<br />
architects, interior designers, engineers, construction companies, pr<strong>of</strong>essional organizations, and related<br />
corporations,” ACE volunteers from these fields mentor high school students by introducing them to the<br />
broad range <strong>of</strong> people and projects within the construction industry. Students tour project <strong>of</strong>fices and visit<br />
active construction sites, and mentors present students with challenging real-world projects.<br />
For more information about the ACE program, visit http://www.ace-mentor-dc.org/index.html<br />
Industrial Investment and Retention: Boston’s Back Streets<br />
Boston has a policy <strong>of</strong> no net loss <strong>of</strong> industrial space and implemented the Back Streets program to<br />
“retain and grow viable industrial and commercial businesses through the strategic use <strong>of</strong> land, workforce<br />
and financial resources.” Back Streets “complement yet stand in contract to Main Street businesses,” as<br />
Back Street businesses are <strong>of</strong>ten “unknown and undervalued but are essential to the flow <strong>of</strong> goods” and<br />
significant employment centers in their own right. Backstreets targets the following sectors:<br />
Manufacturing — metal; chemical; high tech; printing and publishing.<br />
Wholesale — distribution; receiving; reselling.<br />
Commercial Services — business services; data management; security services; maintenance.<br />
Logistics — moving; transportation; warehousing; storage.<br />
Building and contractors — general contractors; subcontractors.<br />
- 91 -
<strong>District</strong> <strong>of</strong> Columbia Industrial Areas Study DC Office <strong>of</strong> Planning<br />
Prepared by Phillips Preiss Shapiro Associates, Inc.<br />
Food Processing and Importing — fish and meat processing; food production.<br />
Economic development plans were adopted for each <strong>of</strong> the city industrial zones to identify land use,<br />
circulation, business and workforce services, image development, and infrastructure improvements.<br />
Stronger zoning review guidelines are being developed, including review clauses that protect existing<br />
small businesses for situations when development proposals seek to convert industrial land and buildings<br />
to <strong>of</strong>fice, commercial, residential or institutional use.<br />
The program provides real estate services including development and site finding assistance, workforce<br />
development including job-readiness services such as Boston's Career Centers, neighborhood English<br />
language and job training programs, and the Youth Opportunity Journal, business assistance services<br />
including one stop shopping for zoning, permitting, city department resources, and financing and<br />
partnerships such as low-interest loans, a dedication <strong>of</strong> city capital funds to upgrade industrial roadways,<br />
sidewalks & lighting, industrial development authority financing, and local development corporation loans.<br />
Back Streets businesses can also avail themselves <strong>of</strong> planning services. The program provides to<br />
individual businesses and small districts a range <strong>of</strong> comprehensive industrial planning services including<br />
area and development planning services to:<br />
Protect industrial land use through planning and zoning<br />
Identify opportunities for expansion and development<br />
Identify transit and infrastructure improvements<br />
Identify public realm improvements.<br />
For more information, go to http://www.city<strong>of</strong>boston.gov/bra/backstreets/backstreets.asp<br />
Buyer-Supplier Match Programs<br />
There are a number <strong>of</strong> examples <strong>of</strong> established buyer supplier match programs. A few <strong>of</strong> these are<br />
described below.<br />
The Kansas Match program, operated by the state Department <strong>of</strong> Commerce, connects Kansas<br />
manufacturers that are currently buying products from outside the state with Kansas suppliers <strong>of</strong> those<br />
same products. Participating suppliers register to be added to a supplier database. Participating buyers<br />
contact the program to request a product or service for purchase from an in-state supplier. Program staff<br />
conducts a search <strong>of</strong> the supplier database and additional resources to locate Kansas suppliers. They<br />
then forward the buyer a list <strong>of</strong> Kansas suppliers to contact directly.<br />
The National Minority Supplier Development Council manages MBISYS, a national database <strong>of</strong> over<br />
15,000 minority-owned firms. The database is made available to the Council’s corporate members.<br />
The Delaware Valley Industrial Resource Center, a publicly-funded manufacturing assistance program in<br />
eastern Pennsylvania, has used a private web-based service, ManufacturingQuote.com to help<br />
manufacturers find suppliers. Via the Web, buyers submit a request-for-quote that specifies the product<br />
they need, the price they are willing to pay, and when the product is needed. When a supplier responds<br />
to a request on the Web site with a proposal, the buyer is notified via e-mail and told to check the Web<br />
site to see the proposal.<br />
- 92 -
<strong>District</strong> <strong>of</strong> Columbia Industrial Areas Study DC Office <strong>of</strong> Planning<br />
Prepared by Phillips Preiss Shapiro Associates, Inc.<br />
Finally, targeted physical improvements in all <strong>of</strong> these areas should assist in retaining current<br />
PDR businesses and making their operations more efficient, and making the <strong>District</strong> more<br />
attractive to new PDR businesses. Industrial park or “iBID” specific strategies could be<br />
suggested by constituent businesses. There is also a municipal role here. Many <strong>of</strong> the public<br />
streets in these areas suffer from deferred maintenance, poor paving condition, and inadequate<br />
curbing, guttering and drainage. In making a commitment to keep these areas activated as vital<br />
business locations, the <strong>District</strong> should also make a commitment to keeping the public<br />
infrastructure in good condition as well.<br />
4.2.4 SPECIFIC RECOMMENDATIONS<br />
Map IP zones for areas 1, 4, and, tentatively, 6.<br />
Map the retooled M zone in area 2.<br />
Map C-M zones in areas 3 , 5 and 7.<br />
Adopt more stringent rezoning criteria for all <strong>of</strong> these areas.<br />
Adopt strategies and guidelines for industrial parks and iBIDs, and consider such a<br />
designation for the Chillum Place area.<br />
Work with the Department <strong>of</strong> Employment Services to institute a “Back Street”-like<br />
program for businesses in these areas, and provide support for job training and<br />
apprenticeship programs.<br />
Work with the Business Resource Center to develop targeted market development<br />
support tools for PDR businesses.<br />
4.3 AREAS TARGETED FOR RETENTION AND <strong>IN</strong>TENSIFICATION<br />
4.3.1 DESCRIPTION OF THE AREAS<br />
Map 4.2 illustrates those areas that should be targeted for retention and intensification <strong>of</strong> use. 39<br />
These are areas which are currently underutilized but contain infrastructure, access, or other<br />
characteristics that are sought by PDR businesses. The overall policy for these areas should be<br />
to maintain the industrial zoning and to make PDR expansion and retention easier. However,<br />
policy should also be aware <strong>of</strong> the appropriateness <strong>of</strong> permitting other types <strong>of</strong> uses in these<br />
areas. A move to industrial/<strong>of</strong>fice and warehousing/retail hybrids, and other flexible space types,<br />
is called for.<br />
Area 1 corresponds to the portion <strong>of</strong> CSX1 south <strong>of</strong> Rhode Island Avenue, but does not include<br />
the planned shopping center development at the Metro. The current zoning is M and C-M-1.<br />
This area is notable for the Home Depot just above Brentwood Road. While a more<br />
conventional commercial use, not a PDR or industrial use, this site is also a major employer<br />
39 Again, detailed existing conditions/inventory maps and descriptions <strong>of</strong> the sub-areas can be found in<br />
the Appendix and are an important compendium to each <strong>of</strong> the target area discussions below.<br />
- 93 -
<strong>District</strong> <strong>of</strong> Columbia Industrial Areas Study DC Office <strong>of</strong> Planning<br />
Prepared by Phillips Preiss Shapiro Associates, Inc.<br />
convenient to transit. Its continued intensification for big box / semi-industrial / hybrid uses like<br />
Home Depot is desirable.<br />
Area 2 consists <strong>of</strong> a large central portion <strong>of</strong> the New York Avenue/Ivy City area that is currently<br />
underutilized, but which has excellent transportation access and is rumored to have recently<br />
been wired with fiber optic cables. The landmark Hecht’s building is found in this area. The area<br />
is a mix <strong>of</strong> C-M-1, C-M-2, M, and R-4 zoning. The residential area is in very poor condition, and<br />
the current vision for this enclave is that <strong>of</strong> a revived residential core as per the <strong>District</strong>’s Home<br />
Again Initiative. As such, consideration, through the Home Again Initiative, <strong>of</strong> the development<br />
<strong>of</strong> artists’ live/work housing, residential as an accessory use, or other such residential<br />
development typologies is recommended, as these uses could mesh well with the surround<br />
PDR-oriented fabric. We also encourage the assemblage <strong>of</strong> large parcels in Area 2 for PDR use<br />
and expansion <strong>of</strong> current warehousing and shipping businesses. This would also allow plenty <strong>of</strong><br />
buffer space for heavy municipal uses across West Virginia Avenue.<br />
The Fort Lincoln Urban Renewal area, Area 3, is well-buffered and enjoys excellent interior<br />
roadways, and is currently home to a beer distributor. Its area encompasses zones SP-2 and R-<br />
5-D—neither <strong>of</strong> which are industrial. The western portion <strong>of</strong> the area has been programmed for<br />
big and medium box retail and has been rezoned commercial, so can no longer be considered<br />
for an industrial designation. However, the warehouse/distribution character <strong>of</strong> the eastern<br />
portion, which contains the distributor, should be preserved with an industrial designation. 40<br />
Area 4 is Bladensburg/Fort Lincoln consists <strong>of</strong> a number <strong>of</strong> quasi-industrial and industrial uses,<br />
though there are interspersed concentrations <strong>of</strong> non-industrial uses including several houses <strong>of</strong><br />
worship, and the relatively narrow strip <strong>of</strong> industrial land is in close proximity to residential<br />
neighborhoods. Bladensburg is an important commercial corridor, and the uses here fill an<br />
important service niche. As such, they should be protected and zoning guidelines which buffer<br />
the industrial and non-industrial uses are required to minimize conflicts.<br />
4.3.2 ZON<strong>IN</strong>G STRATEGIES<br />
The zoning in these areas is very mixed, and in some cases does not include industrial zoning<br />
at all. We recommend that the Home Again Initiative, targeting the R-4 portion <strong>of</strong> Area 2, include<br />
artist live/work housing or residential as an accessory use, or other special residential use that<br />
might mesh better with increased PDR uses in the area. In other places, the existing C-M<br />
zoning is appropriate for these areas because it permits both PDR uses and traditional <strong>of</strong>fices.<br />
The Home Depot shopping center could remain in its current zoning, or be rezoned to a purely<br />
40 Even if Area 3 is not lost to retail/commercial development, the <strong>District</strong> might consider rezoning the<br />
parcel immediately south, between New York Avenue and the railroad tracks, to industrial use, in order to<br />
encourage PDR businesses dependent on the excellent road access or to bank the land for strategic<br />
public use. It is now zoned GOV, and is unused. This area is indicated on the inventory/existing<br />
conditions map for the area.<br />
- 94 -
<strong>District</strong> <strong>of</strong> Columbia Industrial Areas Study DC Office <strong>of</strong> Planning<br />
Prepared by Phillips Preiss Shapiro Associates, Inc.<br />
commercial district reflective <strong>of</strong> its current use. The Fort Lincoln area (Area 3) may eventually<br />
require a rezoning, depending upon its final use. However, with that use in flux, it would<br />
premature to specify here precisely what that zoning should be. Area 4 should retain its existing<br />
C-M zoning to ensure retention <strong>of</strong> this viable PDR corridor, although selective rezoning within<br />
the concentrations <strong>of</strong> other (mainly church related) uses may be appropriate with effective<br />
buffering.<br />
4.3.3 PHYSICAL DEVELOPMENT STRATEGIES<br />
Development in Area 1 should focus on the needs the big box retailers and major<br />
shipping/distribution uses. This includes making access to both Brentwood Road and Rhode<br />
Island Avenue easier and safer. PDR users in the central portion <strong>of</strong> Area 2 would benefit from<br />
land assemblage assistance and improvements in access to both New York Avenue and West<br />
Virginia Avenue. Interior roads are in poor condition, and should be improved.<br />
Further, the <strong>District</strong> may wish to take a leadership role in identifying reuse opportunities for the<br />
Hecht Building. The Economic Development White Paper prepared as a background study for<br />
the Comprehensive Plan recommends exploring a technology-intensive reuse strategy, and has<br />
this to say:<br />
The Hecht Building is an architectural landmark that also happens to <strong>of</strong>fer large floor<br />
plates, high load-bearing capacity, abundant daylighting, and a location on a major traffic<br />
arterial, adjacent to a fat internet backbone. Its combination <strong>of</strong> assets as well as its<br />
physical appearance is reminiscent <strong>of</strong> the Starrett-Lehigh building in Manhattan. The<br />
latter is much larger, at 2.3 million square feet, but like the Hecht Building sat partially<br />
utilized by industrial users for decades before being rediscovered by contemporary<br />
tenants looking for more than <strong>of</strong>fice space. The most notable tenant to occupy space in<br />
the building has been Martha Stewart International, which operates its Internet<br />
operation, photography studios, and more out <strong>of</strong> its space in the Starrett-Lehigh.<br />
A similar strategy may work for the Hecht Building, given the assets listed above. The<br />
building should prove endlessly adaptable. At its best, it could provide the type <strong>of</strong> space<br />
ideal for startups and other fast-changing businesses whose needs are not well served<br />
by traditional single-purpose <strong>of</strong>fice space. The high floor loads make it ideal for operating<br />
large numbers <strong>of</strong> computer servers, or combining <strong>of</strong>fices with distribution. The <strong>District</strong><br />
should therefore have in place zoning which permits an easy mixing <strong>of</strong> different uses<br />
and activities in the same building to encourage creative approaches to the reuse <strong>of</strong> this<br />
landmark.<br />
- 95 -
<strong>District</strong> <strong>of</strong> Columbia Industrial Areas Study DC Office <strong>of</strong> Planning<br />
Prepared by Phillips Preiss Shapiro Associates, Inc.<br />
Scarrett- Lehigh Building: From Old Warehouse to Sought-After Address<br />
The Starrett-Lehigh building, bounded by West 26 th and 27 th streets and 10 th and 11 th avenues in New<br />
York City, rises 19-stories above the Chelsea neighborhood. The brick and concrete, 1.8 million square<br />
feet building was originally a warehouse and manufacturing center. Designed to facilitate easy railroad<br />
freight access, it contained railroad tracks running into the bottom floors allowing freight to enter from the<br />
nearby piers on the Hudson River. Although it was an innovative building from the outset, it has been<br />
redesigned to attract tenants that can afford the $35 to $40 per square foot rents it draws. Only two years<br />
prior, rents hovered around $5 per square foot. Improvements financed by a group <strong>of</strong> investors, 601 West<br />
Associates, included a thorough gutting <strong>of</strong> the building, the addition <strong>of</strong> a<br />
large glass-enclosed lobby, and the installation <strong>of</strong> T 1 cable wiring<br />
throughout. The new <strong>of</strong>fice space appeals to businesses that wish to<br />
convert and divide up the space<br />
to suit their needs. Most <strong>of</strong> the<br />
current tenants are those that<br />
have a creative proclivity, like<br />
media, dot-com, and fashion<br />
companies including Martha<br />
Stewart Living Omnimedia, Inc.,<br />
Concrete Incorporated, and<br />
Tommy Hilfiger U.S.A., Inc.<br />
Other portions <strong>of</strong> New York Avenue/Ivy City are home to telecommunications and<br />
communications firms, including Verizon and BET, but a great deal <strong>of</strong> adjacent land is<br />
consumed by the railroad yards. Perhaps some <strong>of</strong> these railroad areas could attract<br />
development for the television and motion picture industry, in much the same way the Brooklyn<br />
Navy Yard in New York City has been converted from a derelict industrial area to a highpowered<br />
economic engine.<br />
Brooklyn Navy Yard: From Shipbuilding Facility to Economic Development Engine<br />
The historical Brooklyn Navy Yard, the birthplace <strong>of</strong> many<br />
American battleships, has transformed from a dilapidated<br />
shipbuilding facility into a 260-acre commercial and industrial<br />
park that serves as an economic development engine for New<br />
York City. Acquired in 1967 by the City <strong>of</strong> New York, the<br />
industrial park is currently host to an array <strong>of</strong> industries, ranging<br />
from movie studios to electronic distributors and from furniture<br />
manufacturers to food processing plants. Run by the Brooklyn<br />
Navy Yard Development Corporation, the site contains forty<br />
buildings, four dry docks, five active piers, over 200 tenants,<br />
more than 4,500 employed workers, and 3.5 million square feet<br />
<strong>of</strong> leasable space. With Mayor Michael Bloomberg’s 2004<br />
commitment <strong>of</strong> $71,000,000 <strong>of</strong> city money to infrastructure<br />
- 96 -
<strong>District</strong> <strong>of</strong> Columbia Industrial Areas Study DC Office <strong>of</strong> Planning<br />
Prepared by Phillips Preiss Shapiro Associates, Inc.<br />
improvements, easy access to Manhattan, airports, and<br />
the greater metropolitan area, and an open campus<br />
environment the park has attracted new industries to the<br />
City. One notable example, Steiner Studios, has<br />
recently constructed an enclosed 15-acre, full-service<br />
movie production facility complete with spacious<br />
soundstages. It is currently the largest, modern<br />
production facility east <strong>of</strong> Los Angeles and expected to<br />
contribute more than 1,000 new jobs to the local economy.<br />
4.3.4 SPECIFIC RECOMMENDATIONS<br />
Rezone (where necessary) all four <strong>of</strong> these areas for commercial/industrial uses with a<br />
C-M designation and guidelines that will minimize nuisance complaints with adjacent<br />
land uses.<br />
Work with the Home Again Initiative to ensure that the envisioned residential uses mesh<br />
well with surrounding PDR uses—artist live/work housing is one example <strong>of</strong> a residential<br />
use that is appropriate.<br />
Make access and road improvements in Areas 1 and 2 after completing appropriate<br />
transportation and planning studies.<br />
Consider assembling land for private users in Area 2.<br />
Initiate a building renovation loan program.<br />
Consider taking a leadership role with regards to the reuse <strong>of</strong> the Hecht Building,<br />
potentially pursing a multi-tenant technology and media “incubator.”<br />
4.4 AREAS TARGETED FOR STRATEGIC PUBLIC SECTOR USE<br />
4.4.1 DESCRIPTION OF THE AREAS<br />
Map 4.3 illustrates strategic areas which should be targeted for public sector use. These areas<br />
tend to have current concentrations <strong>of</strong> public sector uses (Map 4.3 overlays Map 2.2 to illustrate<br />
this point), relatively buffered sites, good access and infrastructure, and strategic locations with<br />
easy access to all areas <strong>of</strong> the <strong>District</strong>. It is not contemplated that all <strong>of</strong> the land area in these<br />
designated areas will become public facilities—merely that these represent strategic areas for<br />
the public sector to meet public needs while simultaneously redeveloping underutilized<br />
properties. 41<br />
41 As with Sections 4.2 and 4.3, the detailed existing conditions/inventory maps and descriptions <strong>of</strong> the<br />
sub-areas can be found in the Appendix and are an important compendium to each <strong>of</strong> the target area<br />
discussions below.<br />
- 97 -
<strong>District</strong> <strong>of</strong> Columbia Industrial Areas Study DC Office <strong>of</strong> Planning<br />
Prepared by Phillips Preiss Shapiro Associates, Inc.<br />
Note that there are areas within DC that we did not study in depth, but where there are now<br />
housed important public-sector activities. These include the areas around the McMillan<br />
Reservoir and DC’s portion <strong>of</strong> the Fort Reno site. See Section 4.4.5 below for more information.<br />
Area 1 (Scattered Site 1) is currently home to a WMATA bus garage and is zoned C-M-1. The<br />
southern portion <strong>of</strong> this site is underutilized and could house other municipal uses that are “good<br />
neighbors” with the surrounding residential communities. The bus garage itself could perhaps<br />
be decked and built higher (assuming that the busses are not fueled by compressed natural<br />
gas), accommodating additional buses or presenting collocation space. PPSA acknowledges<br />
that WMATA is currently seeking a joint venture partner to redevelop the bus garage site,<br />
presumably to a “higher and better use,” which may result in a relocation <strong>of</strong> the bus garage.<br />
From the perspective <strong>of</strong> this report, repositioning this site is not desirable—once it is<br />
redeveloped, any chance <strong>of</strong> having a strategic municipal location in this area will be lost.<br />
Areas 2, 3 and 4, corresponding to portions <strong>of</strong> New York Avenue/ Ivy City and New York<br />
Avenue/ Bladensburg, are currently home to municipal uses and have the ability to absorb<br />
more. The northern portion <strong>of</strong> Area 2, now zoned M and LO/C-M-1, is home to DPW street<br />
cleaning, waste management, and a small vehicle impoundment area. Some <strong>of</strong> these uses may<br />
be consolidated into the DPW campus on West Virginia Avenue, so these lots would be<br />
available for other <strong>District</strong> municipal needs. The southern portion <strong>of</strong> Area 2, zoned C-M-1,<br />
contains an extremely large DPW campus consisting <strong>of</strong> vehicle maintenance yards and other<br />
light and medium industrial uses. Given the sites strategic location and other characteristics,<br />
and the DPW campus and collocation plans for the site, this area should be protected for<br />
continued public sector use.<br />
The Bladensburg area south <strong>of</strong> New York Avenue (Area 4), zoned C-M-1 and M, houses a<br />
police station and housing authority building, as well as a large auto salvage/repair site and an<br />
underutilized federal government parcel abutting the Arboretum. This area abuts, but does not<br />
include the large triangular site which is being targeted for redevelopment. This area should be<br />
targeted for municipal use, given its strategic location, access to New York Avenue, and<br />
buffered character. The police station, which is west <strong>of</strong> the triangular site, should in particular be<br />
retained. The federal parcels are very open and the location near the green spaces <strong>of</strong> the<br />
Arboretum present an excellent collocation opportunity for the <strong>District</strong>’s Department <strong>of</strong> Parks<br />
and Recreation and federal agencies like the Park Service. The parcels immediately along New<br />
York Avenue, however, could be developed as convenience retail and commercial, so long as<br />
the industrial lands between it and the Arboretum are protected.<br />
Benning Road (Area 5) and a portion <strong>of</strong> 11th Street, SE / Water Street, SE (Area 6) are<br />
additional strategic locations for public sector uses. Significant portions <strong>of</strong> these sites are<br />
underutilized, and they all enjoy strategic locations and have good to excellent<br />
highway/thoroughfare access. Moreover, they are all highly secure. However, all or portions <strong>of</strong><br />
all three sites are within the Anacostia Waterfront Initiative (AWI) area, so are generally<br />
- 98 -
<strong>District</strong> <strong>of</strong> Columbia Industrial Areas Study DC Office <strong>of</strong> Planning<br />
Prepared by Phillips Preiss Shapiro Associates, Inc.<br />
envisioned for open space and waterfront uses. In addition, much <strong>of</strong> Water Street, SE is<br />
currently federal land. Even so, the sites are excellent locations proximate to downtown and<br />
Capitol Hill for very pressing needs such as secure government records storage or even police<br />
forensics storage. Areas that are probably unusable for any other purpose—the areas under the<br />
I-295 and Pennsylvania Avenue highway ramps, for example—would be perfect for that<br />
purpose. Benning Road is zoned C-M-1 and M; 11th Street, SE and Water Street, SE are zoned<br />
C-M-1, C-M-2, and M.<br />
Area 7 (Anacostia Poplar Point) is a challenging area—AWI plans and the major highway<br />
interchanges make it difficult to assemble any meaningful land for PDR use, but its strategic<br />
location and proximity to a new government center at Anacostia make it appropriate for<br />
municipal uses. It is now zoned C-M-1, W-3, and GOV. The area is currently grossly<br />
underutilized despite its highway proximity, likely due to access constraints and oddly shaped<br />
parcels. The areas immediately abutting the interchanges and the narrow sliver <strong>of</strong> land between<br />
the freight rail tracks and the highway, which is already used for vehicle staging/storage, could<br />
be strategic public use areas.<br />
Area 8 (DC Village), zoned C-M-1, is now home to an unorganized mix <strong>of</strong> public sector uses,<br />
including police and fire facilities, the <strong>District</strong>’s main impoundment lot, a job training facility and<br />
special needs prep school (Potomac Job Corps), and a dilapidated emergency family shelter.<br />
These current uses, along with its secure, buffered location make this area ideal for more<br />
intense government uses. Large sites could be obtained with strategic planning and efficient<br />
location.<br />
Area 9 was not studied in depth, but we are aware that it now houses WMATA’s western bus<br />
garage. It represents a de facto industrial area strategically placed to serve established<br />
residential neighborhoods.<br />
4.4.2 ZON<strong>IN</strong>G STRATEGIES<br />
The current zoning in these areas is most likely adequate for public sector uses, but it may be<br />
desirable to distinguish public sector use areas with designations such as Municipal Use Zones.<br />
These designations would put limitations on the amount <strong>of</strong> private sector development in these<br />
areas, thereby “banking” or guaranteeing land for municipal uses and retaining a secure<br />
perimeter around sensitive government areas. The designation would also provide for any<br />
special buffer requirements or the like on an as-needed basis. It is desirable that the <strong>District</strong><br />
initiate master plans for each <strong>of</strong> these areas in order to maximize their use, much like DPW has<br />
done at the West Virginia Avenue site.<br />
- 99 -
<strong>District</strong> <strong>of</strong> Columbia Industrial Areas Study DC Office <strong>of</strong> Planning<br />
Prepared by Phillips Preiss Shapiro Associates, Inc.<br />
4.4.3 PHYSICAL DEVELOPMENT STRATEGIES<br />
Most <strong>of</strong> the areas discussed above could benefit from access and interior circulation<br />
improvements. Further, site perimeters should be made more secure where necessary. On the<br />
other hand, some sites, such as the vehicle inspection station on West Virginia Avenue, need to<br />
remain accessible and open to the public. In all cases, as we just noted, it is desirable to master<br />
plans for each <strong>of</strong> these areas.<br />
Area 7 is unique. It invites regional destinations, due to its tremendous highway and Metro<br />
access, soon to be augmented by light rail along the Anacostia River, as well as tremendous<br />
highway and Anacostia River visibility. The siting <strong>of</strong> the <strong>District</strong>’s proposed soccer stadium<br />
nearby is one such use. This area may be a good location for municipal <strong>of</strong>fices, or municipal<br />
uses serving the general public, such as the DMV.<br />
Area 8, DC Village/Blue Plains, is perhaps the most important municipally-owned area in terms<br />
<strong>of</strong> its immediate ability to satisfy additional municipal needs. Master planning for the location<br />
and inter-relation <strong>of</strong> public uses on this site especially is important. There are several ways in<br />
which the property could be better utilized:<br />
First, it contains at least one large, vacant structure which could either be rehabilitated<br />
(perhaps for storage and warehousing) or demolished to create a new development site.<br />
Decking over the impoundment lot would halve its size, freeing up significant amounts <strong>of</strong><br />
land. Such an undertaking would <strong>of</strong> course be very expensive, but the test <strong>of</strong> whether it<br />
makes financial sense is to measure the cost against the price <strong>of</strong> an equivalent amount<br />
<strong>of</strong> vacant property elsewhere.<br />
The Emergency Family Shelter should be relocated, possibly to scattered sites<br />
throughout the <strong>District</strong>—the current location is isolated from transit, jobs and services,<br />
and the existing buildings are not in good condition. This would further free up significant<br />
amounts <strong>of</strong> property.<br />
Potomac Job Corps could remain in its current location, but should continue to make<br />
improvements to the campus, and be strengthened in terms <strong>of</strong> its connection to the<br />
neighborhood, given the concentration <strong>of</strong> unemployment east <strong>of</strong> the River.<br />
4.4.4 SPECIFIC RECOMMENDATIONS<br />
Retain current industrial zoning, but consider the use <strong>of</strong> designations such as a new<br />
Municipal Use zones to land bank these areas and guarantee their availability in the<br />
long-term for needed public sector use.<br />
Target these Zones for technical innovations, discussed in 4.6.4, below.<br />
Be proactive in acquiring/leasing/using land for public sector uses at Benning Road,<br />
portions <strong>of</strong> 11th Street, SE, Water Street, SE, Scattered Site 1, and Anacostia Poplar<br />
Point.<br />
- 100 -
<strong>District</strong> <strong>of</strong> Columbia Industrial Areas Study DC Office <strong>of</strong> Planning<br />
Prepared by Phillips Preiss Shapiro Associates, Inc.<br />
Improve road and access conditions after completing appropriate transportation and<br />
planning studies.<br />
Address any needed security/perimeter infrastructure that may be required.<br />
Consider Area 7 for municipal <strong>of</strong>fices or other destination, public sector use. Be sure to<br />
retain the vehicle staging/storage areas that do exist now.<br />
Undertake modifications to free up additional property in DC Village for municipal<br />
purposes.<br />
Relocate the Emergency Family Shelter, potentially to several scattered sites located in<br />
non-industrial areas.<br />
Protect with industrial zoning the western bus garage at Area 9.<br />
4.4.5 ADDITIONAL AREAS FOR PUBLIC SECTOR USE<br />
Several areas that were not subject to this study came to our attention as serving important<br />
public sector functions. The <strong>District</strong> should consider acquiring, if necessary, or otherwise<br />
protecting these areas with appropriate C-M or M zoning designations. These areas, including<br />
the eastern side <strong>of</strong> McMillan Reservoir as well as part <strong>of</strong> Fort Reno, are colored purple on Map<br />
4.3.<br />
4.5 AREAS TARGETED FOR CHANGE OF USE<br />
4.5.1 DESCRIPTION OF THE AREAS<br />
After studying the <strong>District</strong> it was apparent that various industrially zoned areas are no longer<br />
appropriate for PDR uses and should be targeted for change <strong>of</strong> use—specifically, to either<br />
permit residential development and let the real estate market take its course, or to zone away<br />
PDR uses. Generally these areas are under substantial rezoning pressure already, are<br />
positioned near Metro stations and thus are suitable for transit oriented development, do not<br />
host many PDR users, and are not suitable for industrial uses. Map 4.4 illustrates these areas. 42<br />
The portions <strong>of</strong> Takoma, Fort Totten, and Brookland around the Metro stops (Areas 1, 2 and 5)<br />
are under intense residential pressure and are more appropriate for transit-orienteddevelopment<br />
(TOD) including mixed commercial, retail, and residential uses. The Takoma area,<br />
now zoned R-5-A and C-2-A, functions more as a neighborhood main street than as a PDR<br />
area, and the historic district designation does not facilitate PDR development in any case. Fort<br />
Totten, now zoned GOV, FT/C-M-1, and FT/M, consists <strong>of</strong> a large amount <strong>of</strong> open space and<br />
Metro-associated facilities including parking lots. This is a transit hub and is targeted by the<br />
<strong>District</strong> for mixed-use TOD, and residential development spurred by Rocky Gorge Homes is<br />
proceeding just south <strong>of</strong> the Metro. Brookland is zoned C-M-1 and the Metro area is proximate<br />
42 The detailed existing conditions/inventory maps and descriptions <strong>of</strong> the sub-areas, found in the<br />
Appendix, are an important compendium to each <strong>of</strong> the target area discussions below.<br />
- 101 -
<strong>District</strong> <strong>of</strong> Columbia Industrial Areas Study DC Office <strong>of</strong> Planning<br />
Prepared by Phillips Preiss Shapiro Associates, Inc.<br />
both to Catholic University and stable residential communities. Given the <strong>District</strong>’s overall<br />
Comprehensive Plan goals and the strategy <strong>of</strong> better utilizing its transit system to promote<br />
economic development, it makes sense to redevelop this area for TOD.<br />
Areas 3 and 4 correspond to Scattered Sites 2 and 4. Both are zoned C-M-1 and are small sites<br />
surrounded by residential neighborhoods. Area 4 is in fact occupied exclusively by residential<br />
uses. They are isolated and are not appropriate for intense PDR use. However, some PDR uses<br />
and social service uses remain active in Area 3, and should be allowed to remain. A rezoning to<br />
mixed-use would permit this while allowing more context-appropriate residential uses with<br />
associated retail and commercial development.<br />
Area 6 corresponds to a narrow protuberance from the CSX 1 area, which is currently occupied<br />
by a poorly configured shopping center with a supermarket and a National Wholesale<br />
Liquidators, as well as the area immediately around the Rhode Island Avenue Metro station,<br />
where a mixed-use shopping center will be developed. There are no PDR users in this area,<br />
and land use policy should seek to upgrade the existing property condition.<br />
Area 7, the western portion <strong>of</strong> New York Avenue/Florida, zoned C-M-2 and M, is also under<br />
intense development pressure, including new <strong>of</strong>fices such as XM Satellite Radio and the Bureau<br />
<strong>of</strong> Alcohol, Tobacco, and Firearms. A very large site on Eckington Place has been proposed for<br />
rezoning for a planned residential development. This location near two major thoroughfares and<br />
a Metro, and on the northern edge <strong>of</strong> the NoMa initiative, is the prime development site outside<br />
<strong>of</strong> Downtown. It no longer contains a large number <strong>of</strong> PDR uses and is appropriate for a change<br />
<strong>of</strong> use to accommodate this development.<br />
Area 8, which includes Union Station and land immediately to the north, is now zoned C-M-3<br />
but is primed for a mixed-use designation to allow multi-family residential as well as commercial,<br />
retail, and hospitality development along and over the Amtrak rail yards. Major development<br />
proposals using these air rights are already in discussion, and have the ability to connect the<br />
new NoMa with residential neighborhoods to the east.<br />
Portions <strong>of</strong> New York Avenue/ Bladensburg north <strong>of</strong> the CSX Bladensburg line, Area 9, are also<br />
appropriate for land use change. They currently have a mix <strong>of</strong> residential, commercial, and PDR<br />
uses, and are surrounded by residential neighborhoods. Current zoning includes C-M-1, CO/C-<br />
M-1, and R-1-B. These areas are appropriate for mixed-use, including housing (MXD),<br />
especially if commuter rail service is someday provided. Importantly, land use pressures in<br />
these areas are not as great as in others, so land value increases due to a rezoning to a mixeduse<br />
designation would not immediately displace existing PDR businesses.<br />
The triangular site is targeted for a change <strong>of</strong> use now, and a private developer has already<br />
assembled much <strong>of</strong> the land. It should be noted, however, that should this development not<br />
come to fruition, this site could be re-cast for certain strategic public uses, as there are other<br />
- 102 -
<strong>District</strong> <strong>of</strong> Columbia Industrial Areas Study DC Office <strong>of</strong> Planning<br />
Prepared by Phillips Preiss Shapiro Associates, Inc.<br />
public uses to the east and west. Analysis <strong>of</strong> the underlying ownership patterns <strong>of</strong> this site<br />
suggest that it would be unlikely that <strong>District</strong> government – much less private sector users –<br />
would be able to acquire it, and its current tenancy patterns suggest that it is significantly under<br />
performing and in fact contributing to the blighted image <strong>of</strong> the New York Avenue gateway. As it<br />
is trending toward redevelopment, a change <strong>of</strong> use is not unreasonable.<br />
Area 10 contains a strip <strong>of</strong> land along New York Avenue and a large triangular site south <strong>of</strong><br />
New York Avenue, west <strong>of</strong> Bladensburg Road and east <strong>of</strong> Montana Avenue. Reuse <strong>of</strong> the<br />
narrow band <strong>of</strong> land between the CSX/Amtrak railroad and New York Avenue for strip retail is<br />
advisable, so long as roadway improvements such as shared access / egress are made. This<br />
corridor, a gateway into the <strong>District</strong>, could accommodate a good mix <strong>of</strong> convenience retail and<br />
<strong>of</strong>fice uses, and is a strategic area for economic development. This area is now primarily C-M-1<br />
and M zoning.<br />
Area 11, part <strong>of</strong> the 11 th Street SE area, includes parcels that have received approvals, prior to<br />
this Study’s completion, for <strong>of</strong>fice and hotel development – uses currently permitted in the M<br />
zone, but which may not be permitted if the M zone is amended as recommended by this report.<br />
Other portions <strong>of</strong> this area are currently within a residential context and are largely within the<br />
Capitol Hill Historic <strong>District</strong>, so a land use change from industrial use to a mixed use district<br />
would be appropriate. However, other portions <strong>of</strong> this area under and adjacent to the highway<br />
and along the railway tracks should be considered for public sector use (see Section 4.4).<br />
East <strong>of</strong> the Anacostia, all <strong>of</strong> CSX2, including Anacostia/Fairlawn and Kennilworth, can be<br />
rezoned to a mixed-use designation (Area 12). At the northeastern end, in Kennilworth,<br />
residential and commercial development already surrounds the Metro stations <strong>of</strong> Deanwood and<br />
Minnesota. Anacostia/Fairlawn, meanwhile, is underutilized. Meaningful PDR development has<br />
not yet taken place along this corridor and is probably not possible, most likely due to its very<br />
small and narrow parcels hugging the rail line and I-295. Kennilworth and much <strong>of</strong> Anacostia<br />
Fairlawn are zoned C-M-1. Other portions <strong>of</strong> Anacostia Fairlawn are zoned GOV, C-M-1, R-5-A,<br />
and C-2-A.<br />
Area 13 (Scattered Site 5) is a scrap yard located in the middle <strong>of</strong> a residential area, and near<br />
Nannie Helen Burroughs Avenue, a designated “Great Street.” Regardless <strong>of</strong> whether this is a<br />
viable business, it is an inappropriate use to be located in the middle <strong>of</strong> a residential area;<br />
rezoning for residential use would help facilitate its relocation and redevelopment.<br />
4.5.2 ZON<strong>IN</strong>G STRATEGIES<br />
As we noted above, there are two sub-strategies under the “change <strong>of</strong> use” recommendation—<br />
to either zone away PDR uses or to permit residential development and let the real estate<br />
market take its course.<br />
- 103 -
<strong>District</strong> <strong>of</strong> Columbia Industrial Areas Study DC Office <strong>of</strong> Planning<br />
Prepared by Phillips Preiss Shapiro Associates, Inc.<br />
There are two areas where PDR use need no longer be accommodated by zoning. Area 1 is an<br />
appropriate site for planned TOD development. There is little to no PDR use that would be<br />
displaced by redevelopment, and a complete removal <strong>of</strong> PDR zoning would be appropriate for<br />
this area. Area 7 (near XM and FedEx) is more appropriately zoned for residential and <strong>of</strong>fices.<br />
However, pockets <strong>of</strong> PDR zoning might have to be retained to ensure that neither FedEx nor<br />
XM is rendered nonconforming.<br />
Area 10 is a location where a transition to retailing uses is the logical option. Located along a<br />
major traffic corridor, in a gateway location, and retail is the predominating use. A rezoning to a<br />
purely retail/commercial district might provide investors with more confidence to develop retail in<br />
these areas, safe in the knowledge that they will not be impinged upon by conflicting uses such<br />
as auto body shops.<br />
Mixed-use designations (MXD) should be established in the remaining areas. MXD zoning, by<br />
opening the door to residential use, will eventually result in the displacement <strong>of</strong> PDR<br />
businesses. In all these areas, a decision has been made to tolerate the eventual loss <strong>of</strong> PDR<br />
businesses, because PDR use is already lacking, is inappropriate, and/or residential<br />
development is already established or targeted on these sites. An MXD zone, as opposed to a<br />
drastic change to more restrictive C or R zoning, has the flexibility to allow current PDR uses to<br />
continue and possibly expand without the need for variances, while encouraging other uses to<br />
populate the sites. This is desirable from both a land use and economic development<br />
perspective.<br />
4.5.3 SPECIFIC RECOMMENDATIONS<br />
Program Areas 1 and 7 for residential and mixed-use TOD development. The northern<br />
portion <strong>of</strong> Area 8, next to the New York Avenue Metro, is also appropriate for TOD<br />
development.<br />
Encourage upgraded retail uses in area 10, and consider rezoning to a commercial land<br />
use classification.<br />
Encourage the redevelopment <strong>of</strong> Area 6 for either a more modern and attractive<br />
shopping center, or for residential use.<br />
New <strong>of</strong>fice and hotel uses have been approved in Area 11. It is appropriate to change<br />
the zoning designation here, particularly if changes to the M zone as recommended in<br />
this report are implemented.<br />
In addition, all MXD areas should be studied to determine their needs for physical<br />
improvements, including land clearance and assemblage to encourage investment as<br />
well as road and circulation and access improvements. Overall, environmental issues<br />
and historic properties deserve consideration, and new developments in MXD areas<br />
should follow appropriate procedures in this regard. Additionally, the <strong>District</strong> should<br />
adopt a coherent and effective brownfield program to identify and remediate<br />
contaminated sites and inject them back into the property market.<br />
- 104 -
<strong>District</strong> <strong>of</strong> Columbia Industrial Areas Study DC Office <strong>of</strong> Planning<br />
Prepared by Phillips Preiss Shapiro Associates, Inc.<br />
Vigilantly enforce zoning use regulations and performance standards to ensure mixeduse<br />
areas remain “good neighbors.”<br />
4.6 GOVERNMENT FACILITIES<br />
As discussed in Section 2.4, the public sector demand for industrial land is great, but large<br />
developments and the superheated regional land market are shrinking supply at the same time<br />
that increasing service requirements are raising immediate and long term demand for land. As<br />
such a significant user <strong>of</strong> industrial land in the <strong>District</strong>, clearly government has the potential and<br />
responsibility to better manage its own industrial land resources.<br />
4.6.1 POTENTIAL LOCATIONS FOR GOVERNMENT FUNCTIONS<br />
Several locations, illuminated in Section 4.4 above, are appropriate for consolidated public<br />
sector uses. The <strong>District</strong> should strategically plan for its own industrial land demands—the<br />
identification and acquisition <strong>of</strong> industrial areas is absolutely necessary for a government that<br />
must meet growing service demands while being constrained by its own zoning. DC Village and<br />
Blue Plains, for example, are now and should remain important locations <strong>of</strong> municipally<br />
controlled industrial land. Other industrial areas should be acquired for government use and<br />
more intensely built. The PEPCO site on Benning Road is one excellent example—the <strong>District</strong><br />
may have the opportunity acquire large portions <strong>of</strong> this underutilized and strategically located<br />
site and use it to meet immediate space needs or bank the land for future needs. Scattered Site<br />
1, and portions <strong>of</strong> the 11th Street, SE, Water Street, SE, and Anacostia Poplar Point areas are<br />
also underutilized, and strategically located industrial areas which should be considered for<br />
municipal uses such as school bus storage under highway overpasses or secure records<br />
storage. The <strong>District</strong> should act on these opportunities promptly, and consider designating them<br />
under a new Municipal Use Zone category to ensure access for strategic public use.<br />
4.6.2 CHANG<strong>IN</strong>G THE WAY ASSETS ARE MANAGED<br />
4.6.2.1 Property Management<br />
Of course, strategically planning to meet municipal space needs requires knowing exactly how<br />
much land and <strong>of</strong> what type each <strong>District</strong> agency requires. But this study found three major<br />
flaws in the way <strong>District</strong> assets are managed. These are:<br />
1) The absence <strong>of</strong> a comprehensive inventory <strong>of</strong> <strong>District</strong> land and property holdings,<br />
including leased properties;<br />
2) A dearth <strong>of</strong> information regarding immediate and future space needs; and,<br />
3) <strong>District</strong> agencies compete against each other in the industrial land market,<br />
sometimes for the same properties.<br />
- 105 -
<strong>District</strong> <strong>of</strong> Columbia Industrial Areas Study DC Office <strong>of</strong> Planning<br />
Prepared by Phillips Preiss Shapiro Associates, Inc.<br />
To address both issues, a stronger role for the Office <strong>of</strong> Property Management (OPM) is<br />
recommended as the single most important solution to these problems. Currently OPM is the<br />
one agency that is authorized to acquire and dispose <strong>of</strong> <strong>District</strong> property, but it is not able to<br />
provide sufficiently comprehensive planning, budgeting, or real estate services. It also does not<br />
have jurisdiction over all <strong>District</strong> agencies in this regard.<br />
One model for OPM to follow is the U.S. General Services Administration or, more<br />
appropriately, the Chicago Department <strong>of</strong> General Services (DGS). The Chicago DGS<br />
manages, operates, leases, disposes, and budgets for each municipal facility, for all agencies<br />
(except for agencies not wholly subject to the city budget, such as schools and transportation<br />
authorities). DGS is also the lead agency for capital budgeting, and it is the only recipient <strong>of</strong><br />
capital budget funds, which it then distributes to agencies, thereby giving it the ability to prioritize<br />
needs, pursue cost savings, and maintain direct accountability. It is also the lead agency for<br />
directing environmental programs such as green buildings, because it can, through the capital<br />
process, reward with funds or provide incentives to agencies that pursue cost savings through<br />
environmental initiatives.<br />
An OPM re-formed into a Chicago DGS-type agency could thus benefit the <strong>District</strong>. Importantly,<br />
it would be able to plan for future space needs, shift assets as needed, and have the authority to<br />
acquire and bank land for future municipal use. Working with the Office <strong>of</strong> Planning and the<br />
Advisory Neighborhood Commissions, this one agency would centralize or decentralize facilities<br />
as the city grows and needs shift, helping to best serve citizens’ needs. This partnership can<br />
also help locate facilities in neighborhood growth centers to spur economic development. This<br />
type <strong>of</strong> comprehensive facility planning can also ensure the equitable siting <strong>of</strong> municipal<br />
facilities, helping to promote fair shares and environmental justice.<br />
While most existing agencies have a good working relationship with OPM, there is bound to be<br />
some resistance to this proposal, particularly from agencies currently heavily involved in<br />
property transactions. It must be stressed, however, that centralized property management is<br />
the only alternative to destructive competition for land resources among agencies. There simply<br />
is no other option for addressing this issue. Opposition to a strengthened OPM is essentially an<br />
endorsement <strong>of</strong> the current system by which property allocation decisions are made on the<br />
basis <strong>of</strong> who was quickest on the draw, not on considerations <strong>of</strong> need and appropriateness.<br />
4.6.2.2 Fleet Management<br />
Another possibility for asset management is consolidating the acquisition, fueling, maintenance,<br />
and repair for all <strong>District</strong> vehicles under one agency. Currently DPW handles most <strong>of</strong> these<br />
functions, particularly the acquisition and service <strong>of</strong> light-duty vehicles, but several agencies<br />
such as Police (MPD) and Fire (FEMS) service their own fleets at separate locations.<br />
- 106 -
<strong>District</strong> <strong>of</strong> Columbia Industrial Areas Study DC Office <strong>of</strong> Planning<br />
Prepared by Phillips Preiss Shapiro Associates, Inc.<br />
Historically, DPW served as the <strong>District</strong>’s fleet management agency, but dissatisfaction with<br />
service rates and response times by constituent agencies, as well as lack <strong>of</strong> sufficient funding<br />
for DPW, led to the secession <strong>of</strong> MPD and FEMS. It is strongly suggested that the <strong>District</strong><br />
investigate whether DPW can resume the performance <strong>of</strong> this function.<br />
A unified Office <strong>of</strong> Fleet Management, such as the one in Philadelphia, is desirable for several<br />
reasons. First, it could free up time and money <strong>of</strong> other agencies. Agencies would in many<br />
cases be relieved <strong>of</strong> having to budget for and dedicate staff to vehicle maintenance and repair in<br />
addition to their chartered duties. Second, it has the potential to consolidate fleet operations on<br />
several centralized sites, rather than having numerous small sites using valuable industrial land.<br />
And thirdly, it has the potential to push green technologies such as hybrid and alternative fuel<br />
vehicles through the budget process.<br />
4.6.3 IMPROV<strong>IN</strong>G EFFICIENCY<br />
It has been noted that there is an already limited supply <strong>of</strong> industrial land in the <strong>District</strong>, and it is<br />
shrinking as large initiatives and zoning changes encroach. So, in addition to better planning for<br />
its industrial land needs, the <strong>District</strong> should seek ways to reduce its overall demand for, and<br />
footprint on, industrial land. This would have the added benefit <strong>of</strong> reducing the municipal costs<br />
and reprogramming industrial areas for tax-paying private businesses.<br />
4.6.3.1 Co-Location<br />
One way to reduce land demand is to consolidate several municipal uses onto one site or into<br />
one building. There are two approaches to co-location. The “joint-use approach” means that<br />
agencies/users operate in the same facility or building, at different hours. This approach<br />
requires less land and fewer buildings, and thus maximizes investment and spreads out<br />
economic impact over day and night. This requires carefully coordinated use and funding<br />
agreements. Secondly, the “campus approach” is the siting <strong>of</strong> several like-uses on the same<br />
plot, or in a centralized fashion. This may require more land and multiple facilities, and can take<br />
longer to implement in terms <strong>of</strong> project coordination, land assemblage, and complex financing,<br />
but there is less <strong>of</strong> a problem with legal and regulatory issues, the technical/operational<br />
difficulties resulting from specialized functions and funding, and any inherent cultural attitudes <strong>of</strong><br />
the agencies used to operating in relative isolation.<br />
The <strong>District</strong> has already begun to look at co-location opportunities. DPW is consolidating most<br />
<strong>of</strong> its functions onto one major campus on West Virginia Avenue. The <strong>District</strong> has also<br />
recognized the possible economic development benefits <strong>of</strong> “government centers” (the colocation<br />
approach) at Benning Road/Minnesota Avenue (DOES + DHS) as well as Anacostia<br />
(DDOT). DCPS (public schools) has undertaken an initiative to co-locate public and charter<br />
schools, and other educational services (joint use approach).<br />
- 107 -
<strong>District</strong> <strong>of</strong> Columbia Industrial Areas Study DC Office <strong>of</strong> Planning<br />
Prepared by Phillips Preiss Shapiro Associates, Inc.<br />
The potential gains from co-location, including lessening the municipal demand for industrial<br />
land, the re-use <strong>of</strong> existing facilities and infrastructure, the economies <strong>of</strong> scale in shipping and<br />
delivery, utilizing existing and cheaper support services, creating a locus <strong>of</strong> stable jobs and<br />
employment, and cost efficiencies from sharing management, space and rent are all reasons for<br />
the <strong>District</strong> to continue its co-location efforts.<br />
4.6.3.2 Fleet Reduction<br />
To further reduce municipal demand for industrial land, the <strong>District</strong> should consider reducing the<br />
overall size <strong>of</strong> the municipal vehicle fleet, if possible. Philadelphia’s Office <strong>of</strong> Fleet Management,<br />
for example, has instituted a car sharing program to reduce its overall fleet size by 400 vehicles.<br />
A fleet reduction program, coupled with an improved car share/ motor pool program has the<br />
potential to decrease the total space required for fleet servicing and parking, as well as reducing<br />
overall fleet management responsibilities.<br />
4.6.4 TECHNOLOGICAL <strong>IN</strong>NOVATIONS—REDUC<strong>IN</strong>G DEMAND FOR <strong><strong>IN</strong>DUSTRIAL</strong> <strong>LAND</strong><br />
Advances in technology and a push towards environmental sustainability are examples <strong>of</strong> less<br />
obvious but equally valid ways to reduce overall demand for industrial land. As the nation’s<br />
Capitol and a world city, the <strong>District</strong> should play an influential role in adopting technical<br />
innovations and “going green.” Chicago, for example, is lauded for its environmental initiatives,<br />
which include green ro<strong>of</strong>s. The <strong>District</strong> has instituted policies for sustainable, environmentallyfriendly<br />
development recently, and the Mayor has created a cabinet level Department <strong>of</strong> the<br />
Environment.<br />
Following are several examples <strong>of</strong> technical innovations which could reduce demand for<br />
industrial land. While there is no guarantee that the <strong>District</strong> will adopt the following technologies,<br />
these are food for thought and should help craft a comprehensive response to managing the<br />
<strong>District</strong>’s land assets.<br />
4.6.4.1 Diesel-electric Hybrid Buses<br />
Using diesel-electric hybrids instead <strong>of</strong> compressed natural gas (CNG) buses would benefit the<br />
<strong>District</strong> in several ways, since hybrids use less space and less-costly fuel, and are more efficient<br />
overall. Firstly, hybrids run on low-sulfur diesel, not unstable and explosive CNG, so they do not<br />
require open air, single-story garages. Garages can be multi-level, eliminating the need for very<br />
large bus campuses, such as the WMATA garage on Bladensburg Road. Secondly, as the price<br />
<strong>of</strong> natural gas continues to increase and supply is constricted by field depletion, pipelines and<br />
appropriate fueling facilities, hybrids become a more reliable and less costly option in the public<br />
transportation authority’s toolkit. Thirdly, hybrids are also more efficient, because they can<br />
recycle the energy normally lost through braking into electricity to charge their batteries—a<br />
major gain for heavy vehicles which are constantly starting and stopping. Finally, modern hybrid<br />
technology can achieve emissions levels comparable to CNG vehicles, meeting the <strong>District</strong>’s<br />
clean air goals by alternative means.<br />
- 108 -
<strong>District</strong> <strong>of</strong> Columbia Industrial Areas Study DC Office <strong>of</strong> Planning<br />
Prepared by Phillips Preiss Shapiro Associates, Inc.<br />
4.6.4.2 Distributed Generation<br />
Distributed generation (DG) refers to using local sources <strong>of</strong> energy production and distribution<br />
for power, rather than large, centralized facilities like fossil fuel plants. While DG can utilize<br />
conventional fuels, its real potential lies with easily obtainable energy from renewable sources<br />
like solar, wind, biomass, and tidal currents. DG facilities can generally be installed on buildings,<br />
meaning that no additional space is required. Because power is generated close to its where it<br />
will be used, transmission losses are minimized. Further, DG eliminates the need for gigantic,<br />
highly secure power plants, like the peaking plants found at Benning Road and in Buzzard<br />
Point. Instead, these vast swaths <strong>of</strong> industrial land could be made now available for<br />
employment-generating PDR uses.<br />
Municipal landfills and sewage plants are man-made sources <strong>of</strong> methane, or natural gas. Some<br />
municipalities have looked at the potential for generating electrical power from methane evolved<br />
from landfills. The same potential may exist for a methane-driven power plant capitalizing on<br />
waste gas from the Blue Plains water treatment facility. The benefits are tw<strong>of</strong>old—capturing a<br />
“free” source <strong>of</strong> energy, and combusting a greenhouse gas more potent than carbon dioxide.<br />
This alternative energy source could further reduce the need for large “dirty” power plants.<br />
4.6.4.3 Green Buildings, Green Planning<br />
Green building and planning standards and technologies are aimed at finding low-energy, more<br />
natural solutions to the problems common to all development: heating and cooling, disposing <strong>of</strong><br />
liquid and solid wastes, managing stormwater flows. While this topic may seem unrelated to<br />
industrial land, it does in fact address directly issues related both the efficient deployment <strong>of</strong><br />
municipal resources and the ability to accommodate future growth without overstressing the<br />
<strong>District</strong>’s infrastructure.<br />
As more and more people live and work in the <strong>District</strong>, demands on the <strong>District</strong>’s sewers and<br />
Blue Plains wastewater treatment plant will grow. Blue Plains has the capacity to absorb this<br />
demand, but large rainfall events flood the <strong>District</strong>’s older combined sanitary/storm sewers and<br />
run<strong>of</strong>f pours, untreated, into rivers. To alleviate this, WASA is retr<strong>of</strong>itting its system to separate<br />
water and storm sewers in the few areas where they are still combined, but additional storm<br />
water management and retention strategies should be pursued, especially in industrial areas<br />
where run<strong>of</strong>f tends to be toxic.<br />
The Office <strong>of</strong> Planning guidelines for “green” development in NoMa are important steps in the<br />
right direction. Recognizing that intense development could have considerable environmental<br />
impacts, OP notes that certain strategies should be investigated to reduce demand on an<br />
already overburdened water management system. Strategies could include rainwater collection<br />
and reuse (which has the potential to decrease costs for water-heavy PDR businesses),<br />
increasing permeable surfaces and decreasing hardscapes like parking lots (car sharing and<br />
transit would reduce auto use and space lost to parking lots), and using bioswales and green<br />
ro<strong>of</strong>s and other buffers to control, channel, filter, and mitigate run<strong>of</strong>f. These strategies not only<br />
- 109 -
<strong>District</strong> <strong>of</strong> Columbia Industrial Areas Study DC Office <strong>of</strong> Planning<br />
Prepared by Phillips Preiss Shapiro Associates, Inc.<br />
have positive effects on the bottom line, they also help keep the region’s wetlands and rivers<br />
clean, and ensure that the <strong>District</strong>’s waterfronts remain amenities for residents and attractions<br />
for tourists.<br />
Riverbank State Park: A Locally Unwanted Land Use Becomes a Community Amenity<br />
There is rarely the opportunity to convert a<br />
facility such as a water treatment plant into<br />
a community amenity. Yet, with Riverbank<br />
State Park this is just what happened. As a<br />
concession to local activists in nearby<br />
Harlem who protested the construction <strong>of</strong><br />
the North River Water Treatment Plant, the<br />
plant that treats most <strong>of</strong> New York City’s<br />
sewage, a ro<strong>of</strong>top park was sited on top <strong>of</strong><br />
the sewage treatment plant. The state park,<br />
69 feet above the Hudson River, provides<br />
local residents with spectacular views <strong>of</strong> the<br />
Hudson, New Jersey, and the George Washington<br />
Bridge. It is also a full-service recreational facility,<br />
consisting <strong>of</strong> five buildings that house an Olympicsize<br />
swimming pool, a covered skating rink, an<br />
800-seat cultural theater and an athletic complex<br />
with fitness rooms. Outdoor facilities include tennis<br />
courts, basketball courts, a s<strong>of</strong>tball field, and an eight-lane running track with<br />
an artificial turf football/soccer field. At water level, there is a 900-seat amphitheater and boat docks.<br />
Currently, it is the only park in the United States using this ro<strong>of</strong>top model, which was inspired by ro<strong>of</strong>top<br />
gardens found in Tokyo, Japan.<br />
More possibilities may present themselves. As an example, green ro<strong>of</strong>s help cool in the summer<br />
and insulate in the winter—what if they were combined with active recreation facilities and<br />
located on the ro<strong>of</strong>s <strong>of</strong> large slab-like building such as bus and vehicle garages?<br />
4.7 RECOMMENDATIONS FOR FUTURE <strong>LAND</strong> USE DECISIONS<br />
While this plan provides a detailed set <strong>of</strong> land use recommendations based on current<br />
conditions in DC’s industrial districts, events will occur that will require decisions to be made<br />
regarding particular industrial parcels. This section first discusses the relationship <strong>of</strong> this report<br />
to the <strong>District</strong>’s forthcoming Comprehensive Plan, and then presents some criteria for judging<br />
the merits <strong>of</strong> future proposals to zone land away from PDR use.<br />
- 110 -
<strong>District</strong> <strong>of</strong> Columbia Industrial Areas Study DC Office <strong>of</strong> Planning<br />
Prepared by Phillips Preiss Shapiro Associates, Inc.<br />
4.7.1 COMPREHENSIVE PLAN GUIDEL<strong>IN</strong>ES<br />
The four industrial land classifications discussed in sections 4.2 through 4.5—areas for<br />
retention, intensification, municipal use, and land use change—should be reflected in the final<br />
adopted update <strong>of</strong> the Comprehensive Plan’s land use policy map. On the prior Comprehensive<br />
Plan map, these areas were designated “production and technical employment.” Striping was<br />
used to indicate where this category could be mixed with other uses.<br />
The new map should adopt the PDR designation, consistent with this report, and the map<br />
should reflect all the areas programmed for retention, intensification, municipal use, and land<br />
use change. A new category <strong>of</strong> ‘Municipal Service Area” should be added to the Comp Plan<br />
map as well. This designation can be shown as a solid color over publicly-owned land such as<br />
DC Village; and in a striped pattern mixed with the PDR color for areas where private ownership<br />
predominates. Likewise, the PDR color should be solid in areas recommended for IP and M<br />
zoning; and striped with commercial designations elsewhere.<br />
The economic development chapter, as well as the land use chapter, <strong>of</strong> the Comprehensive<br />
Plan should reflect the recommendations <strong>of</strong> this report. To that end, a summarized version <strong>of</strong><br />
the major land use recommendations, albeit in a less specified form, has been incorporated into<br />
the Economic Development background study for the Comprehensive Plan. It is hoped that<br />
some version <strong>of</strong> this language will be incorporated into the policies and strategies <strong>of</strong> the final<br />
Plan document.<br />
4.7.2 REZON<strong>IN</strong>G CRITERIA<br />
Early in this planning process, OP requested that criteria be developed that would provide<br />
guidance to the Zoning Commission with regards to rezoning requests. These criteria would be<br />
based upon the following factors:<br />
Land use context: is the area clearly industrial in nature? Does it adjoin residential or<br />
commercial areas? Would it function as a logical extension <strong>of</strong> such areas? Would a land<br />
use change likely result in addition pressure on remaining industrial lands?<br />
Transportation context: does the site have appropriate access for trucks or freight rail?<br />
Can the property be accessed without using residential streets? How far is the property<br />
from a major arterial roadway or freeway? Is it adjacent to a Metro stop?<br />
Environmental context: is the site contaminated? If so, could it be cleaned to<br />
residential standards? What use would best facilitate environmental cleanup?<br />
Conversely, are there sensitive environmental features that would make the site<br />
inappropriate for industrial use?<br />
Existing conditions: Are the current uses considered appropriate or undesirable?<br />
Would redevelopment require significant displacement <strong>of</strong> existing uses?<br />
- 111 -
<strong>District</strong> <strong>of</strong> Columbia Industrial Areas Study DC Office <strong>of</strong> Planning<br />
Prepared by Phillips Preiss Shapiro Associates, Inc.<br />
Unique characteristics: Would redevelopment remove from the <strong>District</strong>’s “portfolio” a<br />
unique building or site that would be difficult to replace? Conversely, is there a unique<br />
building that is functionally obsolete but attractive for adaptive reuse?<br />
Municipal needs: Can it be reasonably anticipated that the site in question may be<br />
needed for municipal or other public service purposes in the foreseeable future?<br />
From these topical points, the Office <strong>of</strong> Planning is currently developing a systematic set <strong>of</strong><br />
zoning criteria to evaluate zoning change proposals going forward. The development <strong>of</strong> this<br />
criteria is near completion at the time <strong>of</strong> the writing <strong>of</strong> this report.<br />
- 112 -
<strong>District</strong> <strong>of</strong> Columbia Industrial Areas Study DC Office <strong>of</strong> Planning<br />
Prepared by Phillips Preiss Shapiro Associates, Inc.<br />
5 References<br />
5.1 <strong>IN</strong>TERVIEWS AND MEET<strong>IN</strong>GS<br />
Technical Advisory Committee<br />
Meeting Dates:<br />
November 1, 2005<br />
November 22, 2005<br />
December 14, 2005<br />
Invited Agencies and Major Industrial Tenants:<br />
Office <strong>of</strong> Planning (OP)<br />
Office <strong>of</strong> Property Management (OPM)<br />
Department <strong>of</strong> Motor Vehicles (DMV)<br />
Department <strong>of</strong> Consumer and Regulatory Affairs (DCRA)<br />
Architect <strong>of</strong> the Capitol (AOC)<br />
DC Water and Sewer Authority (WASA)<br />
Washington Metropolitan Area Transportation Authority (WMATA)<br />
U.S. General Services Administration (GSA)<br />
<strong>District</strong> Department <strong>of</strong> Transportation (DDOT)<br />
Department <strong>of</strong> Public Works (DPW)<br />
Metropolitan Police Department (MPD)<br />
Fire and Emergency Medical Services (FEMS)<br />
Department <strong>of</strong> Parks and Recreation (DPR)<br />
DC Public Schools (DCPS)<br />
Office <strong>of</strong> the City Administrator (OCA)<br />
National Park Service<br />
Pepco<br />
Verizon Communications<br />
Amtrak<br />
CSX Corporation<br />
Interviews<br />
Private industrial real estate brokers and economic development <strong>of</strong>ficials involved in recruitment<br />
and site finding assistance<br />
Paul Pascal, Pascal and Weiss<br />
Mark Payne, Wilkes Company<br />
George Tyler, B&R Property Management<br />
Cydney Fowler, Crowder Realty Team<br />
Keith Sellers, DC Economic Partnership<br />
- 113 -
<strong>District</strong> <strong>of</strong> Columbia Industrial Areas Study DC Office <strong>of</strong> Planning<br />
Prepared by Phillips Preiss Shapiro Associates, Inc.<br />
PDR user representatives:<br />
Patrick Horn, Restaurant Association <strong>of</strong> Metropolitan Washington<br />
Chip Sraver, President, Federal Center Chapter, National Property Management<br />
Association<br />
Arnetta Cook, Special Assistant to the Head <strong>of</strong> Small Business Assistance, National<br />
Capital Region, General Services Administration<br />
5.2 DOCUMENTS AND REPORTS<br />
Bay Area Economics. 2004. Industrial Land Use Analysis: City <strong>of</strong> Baltimore, Maryland. A report<br />
for the Baltimore Development Corporation. January. Silver Spring, MD: Bay Area Economics.<br />
“Backstreets.” City <strong>of</strong> Boston. Accessed at<br />
http://www.city<strong>of</strong>boston.gov/bra/backstreets/backstreets.asp, September 2005.<br />
City <strong>of</strong> Chicago, Department <strong>of</strong> Zoning. Zoning Ordinance. Manufacturing <strong>District</strong>s and Planned<br />
Manufacturing <strong>District</strong>s, Chapters 17-5 and 17-6-0400. Accessed at<br />
http://w14.city<strong>of</strong>chicago.org:8080/zoning/default.jsp, November 2005.<br />
City <strong>of</strong> New York. 2005. New York City Industrial Policy: Protecting and Growing New York<br />
City’s Industrial Job Base. January 2005. Accessed at<br />
http://www.nyc.gov/html/imb/downloads/pdf/whitepaper.pdf.<br />
City <strong>of</strong> Portland, OR. Bureau <strong>of</strong> Planning. Zoning Code. Accessed at<br />
http://www.portlandonline.com/planning/index.cfm?c=31612, November 2005.<br />
Cohen, Stephen S. and John Zysman. 1987. Manufacturing Matters: The Myth <strong>of</strong> the Post-<br />
Industrial Economy. New York: Basic Books.<br />
HNTB. 2005. Land Capacity in the <strong>District</strong> <strong>of</strong> Columbia. Memo to the Comp Plan Task Force.<br />
February 24, 2005.<br />
Landau, Nathan. 2005. “Showdown at Showplace Square: Does San Francisco Have Room for<br />
Industry?” The Next American City. Issue 8. April 2005.<br />
Moss, Mitchell. 1994. Made in New York: The Future <strong>of</strong> Manufacturing in the City <strong>of</strong> New York.<br />
New York: Urban Research Center, Wagner School <strong>of</strong> Public Service, New York University.<br />
New York City Department <strong>of</strong> City Planning. 1993. Citywide Industry Study: New Opportunities<br />
for a Changing Economy. New York: New York City Department <strong>of</strong> City Planning.<br />
- 114 -
<strong>District</strong> <strong>of</strong> Columbia Industrial Areas Study DC Office <strong>of</strong> Planning<br />
Prepared by Phillips Preiss Shapiro Associates, Inc.<br />
Pratt Institute Center for Community and Environmental Development. 2001. Making it in New<br />
York: Manufacturing land use and zoning initiative. Brooklyn: Pratt Institute.<br />
San Francisco Planning Department. 2002. Industrial Land in San Francisco: Understanding<br />
Production, Distribution, and Repair. San Francisco, CA. July.<br />
Traceries. 1992. DC Warehouse Survey Phase II Final Report. Prepared for the DC Historic<br />
Preservation Division. Washington, DC. July.<br />
University <strong>of</strong> Wisconsin-Milwaukee. 2005. Curbing Industrial Decline or Thwarting<br />
Redevelopment? An Evaluation <strong>of</strong> Chicago’s Clybourn Corridor, Goose Island, and Elston<br />
Corridor Planned Manufacturing <strong>District</strong>s. Milwaukee, WI: Center for Economic Development,<br />
University <strong>of</strong> Wisconsin-Milwaukee. November.<br />
Wolf-Powers, Laura. 2005. “Up-Zoning New York City’s Mixed-Use Neighborhoods: Property<br />
Led Economic Development and the Anatomy <strong>of</strong> a Planning Dilemma.” Journal <strong>of</strong> Planning<br />
Educations and Research. 24: 379-393.<br />
- 115 -
<strong>District</strong> <strong>of</strong> Columbia Industrial Areas Study DC Office <strong>of</strong> Planning<br />
Prepared by Phillips Preiss Shapiro Associates, Inc.<br />
6 Appendices<br />
6.1 ZON<strong>IN</strong>G MAPS FOR STUDY AREAS<br />
Please see attached zoning maps.<br />
6.2 SUB AREA ANALYSES AND ILLUSTRATIVE <strong>LAND</strong> USE MAPS<br />
The discussion <strong>of</strong> each sub-area follows a standard format. First, physical characteristics,<br />
including the location and land area, existing building typologies, and site conditions are<br />
described. Next, land use considerations such as existing uses, surrounding uses, and access<br />
are discussed. Real property information, such as major owners and tenants and existing<br />
property assemblages, is presented. Lastly, any other issues affecting the sub-area are<br />
described and analyzed, including likely environmental considerations and planning issues.<br />
The reader should also refer to the attached zoning maps, also in this Appendix. The chart <strong>of</strong><br />
average parcel sizes for each sub areas (Chart 2.16) is a useful resource as well.<br />
6.2.1 CSX1—LAMOND RIGGS<br />
PHYSICAL CHARACTERISTICS<br />
Location and Land Area In the far northern corner <strong>of</strong> the <strong>District</strong>, along the CSX railroad<br />
and Metro Red Line right-<strong>of</strong>-way, is the long and narrow CSX1-Lamond Riggs sub-area. It is<br />
bounded at its north end by Piney Branch Road and the <strong>District</strong>/Maryland border and runs south<br />
to Riggs Road, NE. It encompasses 125.84 acres, representing 4.78 percent <strong>of</strong> the <strong>District</strong>’s<br />
industrial study areas.<br />
Building Typologies Many buildings were built in the railroad age and front on the railroad,<br />
with low-rise brick warehouse structures, large floor plates and loading bays. These types<br />
represent only a small portion <strong>of</strong> the buildings in Lamond Riggs, however. For the most part,<br />
buildings are low-rise rectangular brick and/or concrete block commercial buildings. Some<br />
residential units <strong>of</strong> varying brick and wood frame construction exist along 2 nd Street, NE.<br />
General Site Condition Conditions vary greatly. While some buildings are vacant and for<br />
lease, most are occupied and seem to be doing well; abandoned buildings or vacant lots were<br />
not prevalent. Overall, businesses in this area appear to be “good neighbors”, with notable<br />
exceptions in the poorly-regulated automotive repair industries. Major north-south roads such<br />
as Blair Road, Chillum Place, and 2 nd Street, NE are in need <strong>of</strong> significant repairs. Interior<br />
service drives are also in need <strong>of</strong> significant repairs.<br />
- 116 -
<strong>District</strong> <strong>of</strong> Columbia Industrial Areas Study DC Office <strong>of</strong> Planning<br />
Prepared by Phillips Preiss Shapiro Associates, Inc.<br />
<strong>LAND</strong> USE<br />
Land Use, General Character, and Function The northernmost area, around the Metro<br />
station (Red Line: Takoma) is a transit and retail hub. The area functions almost as a “Main<br />
Street” around the Takoma Metro station. New residential and commercial development is<br />
occurring in the area.<br />
Moving southwards, the area centering on Kansas Avenue and Chillum Place and south to New<br />
Hampshire Avenue is home to manufacturers and fabricators, notably a building and storefront<br />
display sign manufacturer, serving clients such as Sprint, Nextel, and other retailers. Also<br />
prominent are electrical and mechanical contractors such as HVAC (heating, ventilation and air<br />
conditioning) contractors, and suppliers <strong>of</strong> construction materials to service the <strong>District</strong>’s<br />
construction and building trades. The United States Postal Service maintains a medium-sized<br />
facility in the area. There is also a large liquor retailer, <strong>of</strong>fice furniture supply, cabinet makers,<br />
printers and graphics, self-storage buildings, auto repair shops, an environmental contracting<br />
firm, contractors’ unions, vocational-technical training schools, and several houses <strong>of</strong> worship.<br />
The area south <strong>of</strong> New Hampshire Avenue to Riggs Road is predominately warehouse in nature<br />
but includes a Metro substation, a ro<strong>of</strong>ing/siding/windows contractor and supplier, a printing<br />
business, and graphics design establishments.<br />
Surrounding Land Use Context This entire study sub-area is surrounded by low-density<br />
residential areas consisting <strong>of</strong> mainly <strong>of</strong> single-family homes <strong>of</strong> brick and frame construction.<br />
Some <strong>of</strong> the industrial study area falls within the Takoma Park Historic <strong>District</strong>.<br />
Access and Circulation These areas enjoy good circulation from Blair Road, Kansas<br />
Avenue, and Minnesota Avenue. Chillum Place is busy with truck and automobile traffic to and<br />
from the many businesses. Interior service roads vary in quality from fai to very poor.<br />
PROPERTY DATA<br />
Major Tenants Major tenants include the United States Postal Service, WMATA, Gelberg<br />
Signs, a set design company, light manufacturing and building and mechanical trades.<br />
Ownership Patterns and Property Assemblages There are no major assemblages <strong>of</strong> multiple<br />
properties by a single owner, though several real estate developers as well as commercial<br />
brokers and partnerships are active.<br />
OTHER<br />
Environmental Issues There was no obvious evidence <strong>of</strong> environmental issues or<br />
pollution hotspots. Of course, the freight railroad and truck traffic contribute particulates and<br />
other air pollutants; fabricators and manufacturers in the area are <strong>of</strong> the light-industrial type and<br />
probably do not present high levels <strong>of</strong> toxic pollutants.<br />
- 117 -
<strong>District</strong> <strong>of</strong> Columbia Industrial Areas Study DC Office <strong>of</strong> Planning<br />
Prepared by Phillips Preiss Shapiro Associates, Inc.<br />
Historically or Architecturally Significant Buildings There are no known historic or historiceligible<br />
buildings, but some <strong>of</strong> the study area falls within the Takoma Park Historic <strong>District</strong>.<br />
Development pressures The most significant development pressure on this industrial land<br />
is centered on the Takoma Metro station, where new construction <strong>of</strong> residential buildings and<br />
convenience retail is concentrated.<br />
Other Planning Issues This industrial area is very viable, and its character and function<br />
should be retained. However, any possible industrial expansion must take into account the<br />
neighboring residential communities. Areas 14 and 15 <strong>of</strong> the October 19, 2005 DRAFT Land<br />
Use Change Map fall within this study area. The map and key accurately describe portions <strong>of</strong><br />
these areas as underutilized with opportunities for infill development.<br />
KEY F<strong>IN</strong>D<strong>IN</strong>GS<br />
The development pressures on the industrial lands, as well as the presence <strong>of</strong> a<br />
historic residential district surrounding the Takoma metro station are significant<br />
enough factors to consider a land use change in the northern portion <strong>of</strong> this sub-<br />
area.<br />
The southern portion <strong>of</strong> the sub-area is a high-performing, high-value industrial area<br />
with a sustainable and viable tenant mix. Appropriate zoning and land use policies<br />
should be enacted to preserve this industrial area.<br />
6.2.2 CSX1—FORT TOTTEN<br />
PHYSICAL CHARACTERISTICS<br />
Location and Land Area This sub-area extends along the CSX/Red Line corridor from<br />
Riggs Road to Taylor Street, NE. It encompasses 98.97 acres, or 3.76 percent <strong>of</strong> the <strong>District</strong>’s<br />
industrial study areas. The Metro Red and Green lines intersect here at Fort Totten station.<br />
Building Typologies Buildings are generally one- and two-story brick or concrete block<br />
industrial buildings.<br />
General Site Condition Those sites that were accessible seemed in good condition. The<br />
largest sites, particularly the concrete and asphalt batching plants and gravel yards are fenced<br />
<strong>of</strong>f and inaccessible. The Fort Totten solid waste transfer station receives two-thirds <strong>of</strong> the<br />
<strong>District</strong>’s trash and is correspondingly busy, noisy, and dirty.<br />
- 118 -
<strong>District</strong> <strong>of</strong> Columbia Industrial Areas Study DC Office <strong>of</strong> Planning<br />
Prepared by Phillips Preiss Shapiro Associates, Inc.<br />
<strong>LAND</strong> USE<br />
Land Use, General Character, and Function The Metro station at Fort Totten is the<br />
anchor for this area. This bustling hub serves the Red and Green lines. A parking lot for Metro<br />
commuters seems well-used. North <strong>of</strong> the Metro station is a catering business, apartment<br />
houses, union <strong>of</strong>fices, cellular phone towers, and HVAC contractors. South <strong>of</strong> the Metro is an<br />
asphalt plant, a concrete/gravel yard, and the aforementioned Fort Totten waste transfer station.<br />
Surrounding Land Use Context On the east is a mixed-use area, and on the overlooking<br />
ridge to the west is Fort Totten Park. Beyond this are low- and moderate-density residential<br />
neighborhoods.<br />
Access and Circulation Access to the Metro station is generally good, though it is<br />
considerably easier to find when coming from the east as opposed to the west. The major<br />
industrial sites (asphalt, concrete, waste transfer) are generally inaccessible to the public and<br />
foreboding.<br />
PROPERTY DATA<br />
Major Tenants Major tenants include the Metro station, waste transfer station, asphalt<br />
and concrete plants, and several building mechanical systems contractors.<br />
Ownership Patterns and Property Assemblages There are no major assemblages <strong>of</strong> multiple<br />
properties by a single owner.<br />
OTHER<br />
Environmental issues While not known as fact, apparent environmental issues are<br />
numerous. Waste transfer, asphalt mixing, concrete batching, and the railroad contribute dust,<br />
debris, and particulates into the air. They may also contribute to water and soil contamination.<br />
Historically or Architecturally Significant Buildings There are no known historic or historiceligible<br />
buildings.<br />
Development Pressures A rezoning application to build about 80 townhouses has been<br />
approved for the Rocky Gorge site, south <strong>of</strong> the Fort Totten metro. While it is desirable to<br />
concentrate residential development around Metro stations, these residential units would be<br />
bordered on the south by the asphalt plant, a noisy and dirty land use. Compatibility could be an<br />
issue, and one or both <strong>of</strong> the two neighbors may find life in the neighborhood uncomfortable.<br />
Other Planning Issues Open space advocates, the <strong>District</strong>, and the Federal government<br />
have expressed interest in developing a “Fort Circle Greenway” linking the Civil War era forts<br />
that encircle the <strong>District</strong>. Fort Totten is one <strong>of</strong> those.<br />
- 119 -
<strong>District</strong> <strong>of</strong> Columbia Industrial Areas Study DC Office <strong>of</strong> Planning<br />
Prepared by Phillips Preiss Shapiro Associates, Inc.<br />
The area is designated as a Development Opportunity Area and Housing Opportunity Area<br />
under the current Comprehensive Plan, and listed as areas D and 16 on the October 19, 2005<br />
DRAFT Land Use Change Map. The map and key accurately note that the area is generally<br />
underutilized and has the potential, if land use compatibility issues are reconciled, for infill<br />
development.<br />
KEY F<strong>IN</strong>D<strong>IN</strong>GS<br />
Significant development pressures surround the Fort Totten Metro, a prime area for<br />
transit-oriented development and a land use change.<br />
The “heavy” industrial uses south <strong>of</strong> the Metro should be preserved, if possible.<br />
6.2.3 CSX1—BROOK<strong>LAND</strong><br />
PHYSICAL CHARACTERISTICS<br />
Location and Land Area This area extends along the CSX/Red Line corridor from Taylor<br />
Street south to Girard Street. It encompasses 55.34 acres, or 2.10 percent <strong>of</strong> the <strong>District</strong>’s<br />
industrial study areas. There is a Metro stop at Michigan Avenue (Red Line: Brookland/CUA).<br />
Building Typologies Buildings are generally one-story brick or concrete warehouse buildings<br />
with large floor plates and loading bays.<br />
General Site Condition Conditions are generally good, with only incidental aesthetic<br />
concerns such as litter. The buildings seem well-kept. Interior service roads are in fair condition.<br />
<strong>LAND</strong> USE<br />
Land Use, General Character, and Function The land use is mostly industrial with a mix<br />
<strong>of</strong> commercial buildings. A strip <strong>of</strong> buildings (probably former railroad warehouses) has a range<br />
<strong>of</strong> businesses from a bakery to theater storage to a food bank. The area functions both in<br />
support <strong>of</strong> the <strong>District</strong>’s core economic sectors and as a home to social services. Also present<br />
are an auto scrap yard, Housing Authority storage, and Comcast cable company.<br />
Surrounding Land Use Context Surrounding land uses include Catholic University <strong>of</strong><br />
America (CUA) to the west and moderate-density residential to the east. Notably, many<br />
residential units rear yards border on this industrial/commercial land, with only a chain-link fence<br />
to separate the two uses.<br />
Access and Circulation Access to the northern end <strong>of</strong> the site is restricted to one driveway<br />
<strong>of</strong>f <strong>of</strong> Taylor Street. This area is dangerous during the mornings and other common delivery<br />
times when trucks and vans are pulling in and out <strong>of</strong> this driveway. Local neighborhood streets<br />
also provide access points—9 th Street, NE, provides access on the eastern side, and 8 th Street,<br />
NE provides access from the western side.<br />
- 120 -
<strong>District</strong> <strong>of</strong> Columbia Industrial Areas Study DC Office <strong>of</strong> Planning<br />
Prepared by Phillips Preiss Shapiro Associates, Inc.<br />
PROPERTY DATA<br />
Major Tenants Major tenants include the Capitol Area Food Bank, The Shakespeare<br />
Theater, Ottenberg Bakers, DCHA, Comcast, and the United Cerebral Palsy organization. Other<br />
commercial tenants include an equipment rental company, an elevator company, and other<br />
mechanical contractors.<br />
Ownership Patterns and Property Assemblages There are no major assemblages <strong>of</strong> multiple<br />
properties by a single owner. Some properties appear to operate as an ad-hoc industrial park,<br />
though they are not zoned as such.<br />
OTHER<br />
Environmental Issues Aside from truck traffic and noise, there are no apparent or known<br />
environmental issues.<br />
Historically or Architecturally Significant Buildings There are no known historic or historiceligible<br />
buildings.<br />
Development Pressures While the Metro station is used heavily by the surrounding<br />
residential communities and by CUA students and is a prime area for transit oriented<br />
development, there are no known rezoning requests <strong>of</strong> industrial lands. It is possible that if CUA<br />
looks to expand its academic or residential property, it will look to these industrial lands around<br />
the Metro station.<br />
Other Planning Issues As with all <strong>of</strong> the areas along the CSX/Red Line corridor, new<br />
development in Brookland must be undertaken with full consideration <strong>of</strong> the surround residential<br />
communities. The October 19, 2005 DRAFT Land Use Change Map notes area E near the<br />
Metro is a Development Opportunity Area under the Comprehensive Plan. Area 17 on the same<br />
map is accurately noted as having potential for compatible infill development.<br />
KEY F<strong>IN</strong>D<strong>IN</strong>GS<br />
Significant development pressure for transient-oriented development surrounds the<br />
Brookland/CUA Metro, and a land use change should be considered.<br />
The portions <strong>of</strong> the sub-area north and south <strong>of</strong> the Metro are home to active<br />
industrial users, primarily warehouse or light industrial in nature. These should be<br />
preserved.<br />
- 121 -
<strong>District</strong> <strong>of</strong> Columbia Industrial Areas Study DC Office <strong>of</strong> Planning<br />
Prepared by Phillips Preiss Shapiro Associates, Inc.<br />
6.2.4 CSX1<br />
PHYSICAL CHARACTERISTICS<br />
Location and Land Area The CSX/Red Line corridor forms the central axis <strong>of</strong> this area,<br />
which is roughly bounded by Girard Street to the north, 10 th Street to the east, Brentwood Road<br />
to the Southeast, T Street to the south, and 7 th Street to the west. It encompasses 167.42 acres,<br />
representing 6.36 percent <strong>of</strong> the <strong>District</strong>’s industrial study areas.<br />
Building Typologies Building typologies vary greatly within this area, from one-story brick and<br />
concrete commercial buildings to multi-story industrial facilities, to very large modern big box<br />
facilities.<br />
General Site Condition The site conditions also vary greatly. Sites along the rail line are<br />
generally ill-kept, while sites fronting on the larger streets tend to be cleaner and better<br />
maintained. Sites on Reed Street, NE and on 5 th Street, NE are in poor condition, reflecting the<br />
character <strong>of</strong> the streets themselves.<br />
<strong>LAND</strong> USE<br />
Land Use, General Character, and Function The northern portion <strong>of</strong> CSX1 houses<br />
construction contractors, WMATA, industrial hardware stores, a community development<br />
corporation, Old Towne Trolley Parking, and various other industrial users. However, 10 th<br />
Street, NE, within the industrially-zoned land, is a well-established neighborhood residential<br />
street, and several small houses <strong>of</strong> worship are sprinkled throughout the area. A large<br />
wholesale store and supermarket are west <strong>of</strong> the railroad tracks, <strong>of</strong>f <strong>of</strong> 4 th Street, SE between<br />
Channing Street and Bryant Street.<br />
The site south <strong>of</strong> Rhode Island Avenue is a mix <strong>of</strong> commercial and industrial. The eastern side<br />
is home to Home Depot, Giant supermarket, and an accompanying sea <strong>of</strong> parking. There is<br />
room for a third big box on this site. The United States Postal Service maintains a very large<br />
mail facility here. To the west <strong>of</strong> the railroad are industrial users, including a concrete batching<br />
plant, construction contractors, storage, auto salvage, taxi and auto uses, a local fire house, a<br />
DCPS vehicle facility, and two United States Postal Service fleet facilities. Some <strong>of</strong> this land<br />
falls in what appears to be the <strong>District</strong>’s only de facto industrial park, called the ABDO Industrial<br />
Park.<br />
Surrounding Land Use Context Active industrial land borders this site to the south and<br />
southeast. To the east are residential communities and neighborhood streets, and to the west<br />
lie a mix <strong>of</strong> uses including light commercial and moderate density residential.<br />
Access and Circulation Access into and out <strong>of</strong> these areas is generally easy, with most<br />
traffic utilizing Franklin Street, Rhode Island Avenue and Brentwood Road. Circulation ranges<br />
from fair to good, as there are plenty <strong>of</strong> entrance and egress options with minimal friction points.<br />
- 122 -
<strong>District</strong> <strong>of</strong> Columbia Industrial Areas Study DC Office <strong>of</strong> Planning<br />
Prepared by Phillips Preiss Shapiro Associates, Inc.<br />
Entrance to the big box stores is fair. It should be noted that the major longitudinal access<br />
roads, Reed Street and 5 th Street, are narrow and in poor condition. The Metro Red Line stops<br />
at Rhode Island Avenue (with an associated commuter parking lot).<br />
PROPERTY DATA<br />
Major Tenants Major tenants include construction contractors, WMATA, industrial<br />
hardware stores, Manna House (a community development corporation), Old Towne Trolley<br />
parking, and various other industrial users, as well as a large wholesale warehouse and<br />
Safeway grocery store to the north <strong>of</strong> Rhode Island Avenue.<br />
To the south <strong>of</strong> Rhode Island Avenue is the United State Postal Service Brentwood mail<br />
processing distribution facility, a big box shopping plaza anchored by Home Depot and Giant<br />
supermarket, as well as a concrete batching plant, construction contractors, storage, auto<br />
salvage, taxi and auto uses, a local fire house, a DCPS vehicle facility, and two United States<br />
Postal Service fleet facilities<br />
Ownership Patterns and Property Assemblages There are several owners <strong>of</strong> multiple<br />
properties. Edgewood Associates, LLC controls several parcels on Edgewood, north <strong>of</strong> Rhode<br />
Island Avenue, to the west <strong>of</strong> the rail line. An organization called variously Jemal’s Channing<br />
Place, LLC and Jemal’s Springworks controls several parcels on Reed Street. Home Depot, the<br />
Postal Service, and WMATA also control large areas <strong>of</strong> land.<br />
OTHER<br />
Environmental Issues The presence <strong>of</strong> a concrete batching plant, auto salvage yard, and<br />
other industrial users contribute noise, debris, and particulate pollution at the least. As the entire<br />
area is one <strong>of</strong> former medium and heavy industrial uses, ground and soil contamination and<br />
underground tanks may be present.<br />
Historically or Architecturally Significant Buildings The former Heinz 57 Warehouse, at 2101<br />
5 th Street, NE (at V Street) may be eligible for historic designation. This 2-story brick building<br />
was built in 1927 as a food storage and distribution warehouse, and operated by Marriott<br />
Distribution for a time. Its current use is undetermined. Also, on Rhode Island Avenue NE,<br />
between 8 th Street and Reed (9 th ) Streets, is the former Merkle Press complex. These three<br />
buildings <strong>of</strong> cast concrete, built in the 1920’s, housed printing presses and <strong>of</strong>fices. Merkle Press<br />
clients included the government, AFL-CIO, and private sector companies such as Time<br />
Magazine.<br />
Development Pressures A rezoning application has been submitted for several parcels on<br />
Reed Street (9 th Street) just north <strong>of</strong> Rhode Island Avenue. Also, a development on the<br />
WMATA-owned parking lot south <strong>of</strong> Rhode Island Avenue near the Metro is slated for retail and<br />
mixed-use development.<br />
- 123 -
<strong>District</strong> <strong>of</strong> Columbia Industrial Areas Study DC Office <strong>of</strong> Planning<br />
Prepared by Phillips Preiss Shapiro Associates, Inc.<br />
Other Planning Issues The big box site is the most prominent feature <strong>of</strong> this sub-area. It<br />
can accommodate at least three big box retailers, and currently only serves two (Kmart would<br />
have been the third, but the company pulled out). The residential areas to the west <strong>of</strong> 10 th Street<br />
NE and to the east <strong>of</strong> 4 th Street NE appear to be stable areas and should be taken into account<br />
in any development activities.<br />
The October 19, 2005 DRAFT Land Use Change Map notes area J near the Rhode Island<br />
Avenue Metro station has several development projects in the pipeline and is designated a<br />
Development Opportunity Area under the existing Comprehensive Plan.<br />
KEY F<strong>IN</strong>D<strong>IN</strong>GS<br />
Reed Street north <strong>of</strong> Rhode Island Avenue is in need <strong>of</strong> significant investment and<br />
repair.<br />
The Rhode Island Metro area is experiencing some development pressure. It is a<br />
prime area to capture commercial and retail development, but residential<br />
development on the industrial land in this sub-area is not desirable. Mixed-use<br />
development around the Metro should be encouraged.<br />
Efforts should be made to complete the build-out and occupancy <strong>of</strong> the final big box<br />
site near Home Depot. Possible historic buildings on the western side should be<br />
preserved in their industrial states as warehouse or other commercial (even <strong>of</strong>fice)<br />
buildings.<br />
6.2.5 NEW YORK AVENUE/FLORIDA<br />
PHYSICAL CHARACTERISTICS<br />
Location and Land Area This area is roughly bounded by T Street on the north, 9 th Street to<br />
the east, Florida Avenue to the south, and 1 st Street, Eckington Place, and 3 rd Street to the west.<br />
It is the nexus <strong>of</strong> the CSX, Amtrak, and B&O rail lines which enter the <strong>District</strong> from the north and<br />
east. The area encompasses 196.73 acres, which is 7.47 percent <strong>of</strong> the <strong>District</strong>’s industrial<br />
study areas.<br />
Building Typologies Building sizes and types vary greatly in this area. The buildings to the<br />
west <strong>of</strong> the railroads are generally mid-rise brick and concrete commercial buildings, many <strong>of</strong><br />
which are former railroad-oriented warehouses. The southwest <strong>of</strong> the site, at the convergence <strong>of</strong><br />
New York and Florida Avenues is new construction rehabilitation <strong>of</strong> concrete and brick multistory<br />
<strong>of</strong>fice buildings, now the site <strong>of</strong> XM Satellite Radio and FedEx. South <strong>of</strong> New York Avenue<br />
and north <strong>of</strong> Florida Avenue is dominated by the Capitol City Market’s low-rise, one- and twostory<br />
concrete and brick wholesale buildings with loading docks and large truck bays.<br />
- 124 -
<strong>District</strong> <strong>of</strong> Columbia Industrial Areas Study DC Office <strong>of</strong> Planning<br />
Prepared by Phillips Preiss Shapiro Associates, Inc.<br />
General Site Condition Site conditions vary from very good, to fair, or poor. The Eckington<br />
Place and New York Avenue area is generally good. Many <strong>of</strong> the sites within the wholesale<br />
market south <strong>of</strong> New York Avenue are small and rundown in places. Truck and vehicular traffic<br />
is chaotic.<br />
<strong>LAND</strong> USE<br />
Land Use, General Character, and Function The northern portion <strong>of</strong> the site is comprised<br />
exclusively <strong>of</strong> railroad lines, switching yards, and maintenance buildings.<br />
The southeastern portion <strong>of</strong> the site, the area <strong>of</strong> 4 th and 5 th Streets, NE between New York<br />
Avenue and Florida Avenue is a truly unique wholesale and retail district that <strong>of</strong>fers products<br />
such as ethnic and specialty foods, a fish market, discount clothing, and restaurant supplies.<br />
Built in the 1930’s, the Market area also seems to <strong>of</strong>fer some areas for walk-in customers, an<br />
excellent example <strong>of</strong> wholesalers capitalizing on the retail market. For example, the Italian foods<br />
store A. Litteri Inc. is probably a destination—people arrive from all over the <strong>District</strong> to purchase<br />
specialty meats, cheeses, and olive oils. Some parcels (open lots) and buildings in the area may<br />
be underutilized. Given its tremendous accessibility to New York Avenue, Florida Avenue, Metro<br />
Bus, and the recently-opened New York Avenue Metro (Red Line), this is an area where more<br />
intense development could produce tangible benefits for the <strong>District</strong>.<br />
West <strong>of</strong> the railroad, north <strong>of</strong> Florida Avenue is an area <strong>of</strong> new commercial development and<br />
older industrial buildings. XM Satellite Radio headquarters are here, along with a major FedEx<br />
facility, the Washington Flower Center, and an art/drama therapy center. There are also several<br />
storage buildings and a Verizon telecommunications facility.<br />
Surrounding Land Use Context To the east <strong>of</strong> the Market is Gallaudet University, an<br />
attractive campus <strong>of</strong> buildings which is insulated from the bustle <strong>of</strong> the Market (although<br />
students and staff are said to frequent the market). Stable residential communities border the<br />
commercial buildings to the west <strong>of</strong> Eckington Place and north <strong>of</strong> R Street. The site south <strong>of</strong> the<br />
intersection <strong>of</strong> New York and Florida is under construction, to be a new headquarters for the<br />
Bureau <strong>of</strong> Alcohol Tobacco and Firearms and a hotel complex, just a block from the brand new<br />
Metro station (Red Line: New York Avenue).<br />
Access and Circulation Access to and through most <strong>of</strong> these areas, from New York and<br />
Florida Avenues is good. However, traffic on New York Avenue is very heavy at rush hours and<br />
the road can be dangerous. Traffic and circulation within the Market is chaotic as delivery trucks<br />
and personal vehicles frequently block entire streets.<br />
PROPERTY DATA<br />
Major Tenants Major tenants include the Capitol City Market, XM Satellite Radio, and<br />
FedEx.<br />
- 125 -
<strong>District</strong> <strong>of</strong> Columbia Industrial Areas Study DC Office <strong>of</strong> Planning<br />
Prepared by Phillips Preiss Shapiro Associates, Inc.<br />
Ownership Patterns and Property Assemblages The most notable assemblages occur within<br />
the Capitol City Market, with Sang Oh & Company controlling a number <strong>of</strong> the sites and<br />
buildings.<br />
OTHER<br />
Environmental Issues The railroads are the most likely source <strong>of</strong> contamination in this<br />
area, but no known environmental issues are present. The older industrial buildings were<br />
primarily used as warehouses, not manufacturing facilities, and the presence <strong>of</strong> pollutants<br />
seems less likely.<br />
Historically or Architecturally Significant Buildings The XM Radio Headquarters is located in<br />
the former Judd & Detweiler Printing Company complex, a unified complex comprised <strong>of</strong> historic<br />
three- and four-story brick and concrete structures. A potential landmark building, the Sanitary<br />
Grocery Company, was originally a warehouse and was converted to <strong>of</strong>fice space and storage<br />
areas sometime in the early 1980s. The Sanitary Grocery Company and the National<br />
Geographic Society building, as well as the entire Market area, are also worthy <strong>of</strong> historic and<br />
cultural consideration.<br />
Development Pressures The New York Avenue/Florida Avenue area is sure to become a<br />
hub <strong>of</strong> mixed-use activity. Excellent Metro access from a new station, the presence <strong>of</strong> national<br />
headquarters, a new Federal <strong>of</strong>fice building, and a bustling market area all contribute to day and<br />
nighttime activity and development “buzz.” A rezoning application for 700 residential units has<br />
been submitted for the parcel immediately north <strong>of</strong> FedEx.<br />
Other Planning Issues The presence <strong>of</strong> adjacent residential areas, new <strong>of</strong>fices and<br />
associated employment opportunities, the Market, and a new Metro station make new<br />
residential and mixed-use development on infill sites in this area an almost natural course.<br />
Consideration should be given to opening the Market area up to the broader public, linkages to<br />
the Gallaudet community and the new <strong>of</strong>fice buildings are especially promising.<br />
The October 19, 2005 DRAFT Land Use Change Map lists area 24, the Market area, as capable<br />
<strong>of</strong> sustaining significant mixed-use development, but with special protections for the market<br />
area. This area is a Special Treatment Area under the existing Comprehensive Plan.<br />
KEY F<strong>IN</strong>D<strong>IN</strong>GS<br />
There is limited available land for development, and much <strong>of</strong> the interior <strong>of</strong> the site is<br />
occupied by railroad yards. However, significant commercial and <strong>of</strong>fice development<br />
is taking place near the New York Avenue Metro and intersection <strong>of</strong> New York and<br />
Florida Avenues - this specific area should be considered for a land use change.<br />
- 126 -
<strong>District</strong> <strong>of</strong> Columbia Industrial Areas Study DC Office <strong>of</strong> Planning<br />
Prepared by Phillips Preiss Shapiro Associates, Inc.<br />
Potentially historic buildings should be retained as industrial or commercial uses.<br />
They are currently occupied and are too distant from the Metro to warrant conversion<br />
to residential use.<br />
Limited residential exposure to the north, east, and south, as well as excellent road<br />
and rail access makes this area a prime candidate for preservation <strong>of</strong> its industrial<br />
character.<br />
The Wholesale Market should be protected as a culturally and industrially-significant<br />
area. Portions <strong>of</strong> it may benefit from increased density. Limited commercial/<strong>of</strong>fice<br />
development in the market area near the Metro and Florida Avenue could help<br />
bolster the market’s retail businesses with additional daytime population.<br />
6.2.6 CSX1 NY/NOMA<br />
PHYSICAL CHARACTERISTICS<br />
Location and Land Area This area around the railroad corridor is bordered to the north by<br />
Florida Avenue, and the south by Union Station. It encompasses 76.32 acres, or 2.90 percent <strong>of</strong><br />
the <strong>District</strong>’s industrial study areas.<br />
Building Typologies Buildings are generally industrial in character, <strong>of</strong> brick and concrete<br />
construction. The newest developments, on 2 nd Street just north <strong>of</strong> Union Station are modern<br />
glass and steel <strong>of</strong>fice buildings. Small residential buildings are present along Parker and 3 rd<br />
Streets.<br />
General Site Condition The sites around Union Station are in excellent condition. Sites<br />
north <strong>of</strong> the station, near M Street, NE and along 3 rd Street NE are in fair to poor condition, with<br />
run-down structures, overgrown brush, and litter contributing to an unwelcoming atmosphere.<br />
<strong>LAND</strong> USE<br />
Land Use, General Character, and Function The sites are a mix <strong>of</strong> transportation,<br />
commercial, and industrial. Union Station and its railroad yards and parking deck dominate the<br />
area, but older warehouse and factory buildings are also present. These apparently no longer<br />
function as such, as the Uline buildings and others are houses <strong>of</strong> worship and storage lots. The<br />
site and buildings are unique, but not inviting.<br />
Surrounding Land Use Context To the west is <strong>of</strong>fice development, and to the east are<br />
residential communities. This industrial land is a distinct boundary between the two areas.<br />
Access and Circulation Access to Union Station is very good (via car, bus, and Metro).<br />
The industrial buildings are accessed from Florida Avenue or the residential neighborhoods to<br />
the east; streets are rough and in marginal condition. Heavy truck traffic is not an issue in this<br />
area.<br />
- 127 -
<strong>District</strong> <strong>of</strong> Columbia Industrial Areas Study DC Office <strong>of</strong> Planning<br />
Prepared by Phillips Preiss Shapiro Associates, Inc.<br />
PROPERTY DATA<br />
Major Tenants Union Station/Amtrak occupy most <strong>of</strong> the area.<br />
Ownership Patterns and Property Assemblages The old Uline buildings are now held by<br />
Jemal’s Uline LLC. Other property owners with significant assemblages include M Street<br />
Development Group LLC and K Street Developers LLC.<br />
OTHER<br />
Environmental Issues There are no known environmental issues, but it can be assumed<br />
that the railroad presents some ground and air contamination.<br />
Historically or Architecturally Significant Buildings The Uline Ice Company and arena were<br />
built in the early 1930s and are unique for their construction, type, and function. It is reported<br />
that The Beatles’ first Washington, DC concert was played in the Uline arena. Neighboring<br />
buildings not in the industrial zone also deserve consideration.<br />
Development Pressures Union Station, the terminus for the Northeast Corridor rail system<br />
and a hub for Metro and commuter rail, is one <strong>of</strong> the most active surface transportation hubs in<br />
the country. Thus the development air rights from the railroad and Union Station have been<br />
highly prized. The new SEC building at F and 2 nd Street is one manifestation <strong>of</strong> the mixed-use<br />
and <strong>of</strong>fice development pressures in this area. One plan calls for a very large residential<br />
development in two ten-story buildings, including an <strong>of</strong>fice, hotel, and very large retail<br />
component, on 15 acres to the north and south <strong>of</strong> H Street.<br />
Other planning issues Area 21 and K <strong>of</strong> the October 19, 2005 DRAFT Land Use Change<br />
Map are within this area, and noted as infill and change areas, respectively. Both areas are<br />
Development Opportunity Areas under the existing Comprehensive Plan.<br />
KEY F<strong>IN</strong>D<strong>IN</strong>GS<br />
Very significant commercial and residential development pressures area associated<br />
with the air rights from Amtrak’s Union Station – this area could benefit from a land<br />
use change.<br />
There are a number <strong>of</strong> underutilized industrial sites to the east <strong>of</strong> the railroad that<br />
should be retained as industrial use, if the small building floorplates and land areas<br />
make that possible.<br />
The northern portion <strong>of</strong> the area near the New York Avenue Metro could support<br />
commercial and mixed-use development. Consider permitting residential as an<br />
accessory use in this area.<br />
- 128 -
<strong>District</strong> <strong>of</strong> Columbia Industrial Areas Study DC Office <strong>of</strong> Planning<br />
Prepared by Phillips Preiss Shapiro Associates, Inc.<br />
6.2.7 BLADENSBURG/FORT L<strong>IN</strong>COLN<br />
PHYSICAL CHARACTERISTICS<br />
Location and Land Area This area stretches along Bladensburg Road, NE, between South<br />
Dakota Avenue and Eastern Avenue, the <strong>District</strong>’s Maryland border. The site is 32.93 acres,<br />
comprising 1.25 percent <strong>of</strong> the <strong>District</strong>’s industrial study areas.<br />
Building Typologies The buildings are generally low-rise brick and concrete block structures,<br />
some set against the street, some set back behind parking lots.<br />
General Site Condition The site is more commercial than industrial in appearance. The<br />
prevailing image is <strong>of</strong> bustling auto repair shops.<br />
<strong>LAND</strong> USE<br />
Land Use, General Character, and Function Land uses include commercial,<br />
transportation/utility, institutional, and residential. This strip includes at least three houses <strong>of</strong><br />
worship, about five auto-repair shops, a convenience store, a social service <strong>of</strong>fice, three low-rise<br />
residences (which may be associated with the churches), value retail, and mechanical<br />
contractors.<br />
Surrounding Land Use Context The area is surrounded by low-density residential<br />
neighborhoods, with some higher density residential to the south.<br />
Access and Circulation All sites enjoy good access to Bladensburg Road. There are no<br />
circulation problems, although parking on worship days may be difficult.<br />
PROPERTY DATA<br />
Major Tenants The most common tenants here are auto repair shops and houses <strong>of</strong><br />
worship.<br />
Ownership Patterns and Property Assemblages Two owners control several properties each:<br />
Samuel J. Decker and Bristol Bladensburg LLC.<br />
OTHER<br />
Environmental Issues There are no known environmental issues, but it can be surmised<br />
that there is some petroleum contamination and run<strong>of</strong>f from the auto shops.<br />
Historically or Architecturally Significant Buildings There are no historic or historic-eligible<br />
buildings.<br />
- 129 -
<strong>District</strong> <strong>of</strong> Columbia Industrial Areas Study DC Office <strong>of</strong> Planning<br />
Prepared by Phillips Preiss Shapiro Associates, Inc.<br />
Development Pressures There are few apparent development pressures in this area,<br />
although there have been some preliminary discussions regarding a possible proposal to<br />
develop a piece <strong>of</strong> land, which is currently not used for industrial purposes, as residential.<br />
Other Planning Issues There is a need to buffer the residential areas from the autorelated<br />
uses on Bladensburg. This is listed as area 22 on the October 19, 2005 DRAFT Land<br />
Use Change Map.<br />
KEY F<strong>IN</strong>D<strong>IN</strong>GS<br />
The automobile-related uses concentrated along Bladensburg appear viable but<br />
require some buffering from adjacent residential communities.<br />
The area also represents a concentration <strong>of</strong> non-industrial uses. Relocation <strong>of</strong> these<br />
uses is not likely, although some redevelopment <strong>of</strong> these lands is possible.<br />
Therefore, buffering between incompatible land uses is needed.<br />
6.2.8 FORT L<strong>IN</strong>COLN URBAN RENEWAL<br />
PHYSICAL CHARACTERISTICS<br />
Location and Land Area The Fort Lincoln Urban Renewal Area is a very large,<br />
strategically-located site just inside the <strong>District</strong> boundary with Maryland accessible from New<br />
York Avenue (Route 50). It encompasses about 91.88 acres, or 3.49 percent <strong>of</strong> industrial study<br />
areas.<br />
Building Typologies The only building is a modern one-story, large floor plate alcohol<br />
distribution facility.<br />
General Site Condition The site condition <strong>of</strong> the existing building is good. The balance <strong>of</strong><br />
the area consists <strong>of</strong> rolling slopes and is covered with overgrown brush and immature<br />
woodland.<br />
<strong>LAND</strong> USE<br />
Land Use, General Character, and Function The only current facility is an alcohol<br />
distributor, which enjoys good access to both the <strong>District</strong> and the suburbs. A Costco and other<br />
large to medium format retail stores are planned for the commercially zoned portion <strong>of</strong> this area.<br />
Surrounding Land Use Context The surrounding area is semi-wooded. Multi-story<br />
residential buildings are located on Fort Lincoln Drive.<br />
Access and Circulation The roads within this area provide excellent truck access and<br />
circulation. Access from inbound New York Avenue/Route 50 is excellent, but the outbound<br />
traffic must navigate a difficult exit onto South Dakota Avenue to access the site.<br />
- 130 -
<strong>District</strong> <strong>of</strong> Columbia Industrial Areas Study DC Office <strong>of</strong> Planning<br />
Prepared by Phillips Preiss Shapiro Associates, Inc.<br />
PROPERTY DATA<br />
Major Tenants There is currently only one tenant, an alcohol distribution facility.<br />
Ownership Patterns and Property Assemblages None. The urban renewal area is controlled<br />
by public and quasi-public entities.<br />
OTHER<br />
Environmental Issues There are no known environmental issues.<br />
Historically or Architecturally Significant Buildings There are no historic or historic-eligible<br />
buildings.<br />
Development Pressures The <strong>District</strong> is planning for the commercially zoned portion <strong>of</strong> the<br />
area to be developed as a large and medium format destination shopping center, including a<br />
Costco. Limited neighborhood serving retail is also possible.<br />
Other Planning Issues A portion <strong>of</strong> this area was listed on the October 19, 2005 DRAFT<br />
Land Use Change Map as area L. It is identified for further residential development is both a<br />
Housing Opportunity Area and Development Opportunity Area under the existing<br />
Comprehensive Plan.<br />
KEY F<strong>IN</strong>D<strong>IN</strong>GS<br />
With the exception <strong>of</strong> a planned destination retail shopping center, there are very few<br />
development pressures on this sub-area, although the retail center may increase<br />
development pressures.<br />
The area enjoys excellent interior circulation, highway access, and ability to<br />
accommodate modern, large-floorplate buildings.<br />
It is not zoned industrial, and would be best programmed for a technology-oriented<br />
R&D <strong>of</strong>fice park or strategic public PDR use if the retail development does not move<br />
forward.<br />
6.2.9 NEW YORK AVENUE/BLADENSBURG<br />
PHYSICAL CHARACTERISTICS<br />
Location and Land Area This is the second-largest sub-area <strong>of</strong> industrial study areas,<br />
encompassing 348.10 acres and comprising 13.22 percent <strong>of</strong> the <strong>District</strong>’s industrial land. It is<br />
an irregularly shaped area centering on New York Avenue and the railroad corridor,<br />
approximately west <strong>of</strong> South Dakota Avenue and east <strong>of</strong> West Virginia Avenue and 18 th Street<br />
NE.<br />
- 131 -
<strong>District</strong> <strong>of</strong> Columbia Industrial Areas Study DC Office <strong>of</strong> Planning<br />
Prepared by Phillips Preiss Shapiro Associates, Inc.<br />
Building Typologies Building types vary greatly in this area. Old, medium sized brick buildings<br />
associated with the railroad give way to comparatively newer and larger brick and concrete<br />
structures. The largest and newest buildings are <strong>of</strong> post-war vintage built <strong>of</strong> concrete block and<br />
steel.<br />
General Site Condition Site conditions also vary widely. In general, V Street and<br />
Bladensburg are in good condition. Sites and roads north <strong>of</strong> Bladensburg (Queens Chapel<br />
Road, 24 th Place, 25 th Place) are in poor condition—heavily used and poorly-maintained.<br />
<strong>LAND</strong> USE<br />
Land Use, General Character, and Function The area is very heavily used by a mixture<br />
<strong>of</strong> industrial, transportation/utility, and commercial uses. Just <strong>of</strong>f <strong>of</strong> and paralleling New York<br />
Avenue NE to the north is V Street, NE, a heavily-used district. There is a concentration <strong>of</strong> uses<br />
including light industrial, building support services such as electrical contracting, several medical<br />
<strong>of</strong>fices and research labs such as the police forensics and crime scene lab, a large beer storage<br />
and distribution warehouse, and catering and food distribution services. Other users include the<br />
DC Fire Department (supply and storage), Washington Hospital (printing services), and a<br />
creative arts center. Just south <strong>of</strong> V Street, along New York Avenue, is the Washington Times<br />
newspaper headquarters. Several gas stations line New York Avenue and Bladensburg.<br />
North <strong>of</strong> Bladensburg is a WMATA bus maintenance facility, building contractors, a large private<br />
waste transfer facility, DC Public Schools bus parking, automobile repair shops, warehouses,<br />
and smaller facilities such as a church, credit union, and insurance <strong>of</strong>fices.<br />
South <strong>of</strong> New York Avenue is a large automobile scrap yard and a DC Police station/facility, as<br />
well as building contractors’ supply and automobile repair.<br />
Surrounding Land Use Context Low and moderate density residential development<br />
borders this area closely to the north. The open space <strong>of</strong> the National Arboretum border New<br />
York Avenue is located to the south.<br />
Access and Circulation Access <strong>of</strong>f <strong>of</strong> New York Avenue is good, though New York Avenue<br />
is very busy and congested during rush hours. V Street is heavily used but has adequate<br />
circulation. Bladensburg is in good condition and provides good access to industrial and<br />
commercial users on both sides. Large garbage trucks, Metro buses, and school buses are very<br />
frequent on strip <strong>of</strong> Bladensburg north <strong>of</strong> New York Avenue. Dead-end streets such as Adams,<br />
24 th , 25 th , and 26 th Places are used only by local industrial traffic.<br />
PROPERTY DATA<br />
Major Tenants There are numerous municipal facilities in this area, including Police,<br />
Public Schools, WMATA, and Housing Authority facilities. Other tenants include the Washington<br />
Times, a large waste transfer station, and a very large auto scrap yard.<br />
- 132 -
<strong>District</strong> <strong>of</strong> Columbia Industrial Areas Study DC Office <strong>of</strong> Planning<br />
Prepared by Phillips Preiss Shapiro Associates, Inc.<br />
Ownership Patterns and Property Assemblages The only significant assemblage occurs<br />
along V Street, where SMC United Industrial Limited Partnership controls many <strong>of</strong> the parcels.<br />
OTHER<br />
Environmental Issues It is likely that there are significant environmental issues in these<br />
areas, given the concentration <strong>of</strong> light industrial activities including waste transfer, vehicle<br />
maintenance, and an auto scrap yard.<br />
Historically or Architecturally Significant Buildings There are no known historic or historiceligible<br />
buildings, but it is suggest that the V Street corridor is deserving <strong>of</strong> some industrial area<br />
recognition.<br />
Development Pressures The low density residential neighborhoods and the Arboretum<br />
present no direct pressures on this industrial area. However, parcels on the triangular site south<br />
<strong>of</strong> New York Avenue are being assembled for private commercial development.<br />
Other Planning Issues There are some sites or spaces along V Street that may be vacant<br />
or are for lease, which, along with the concentration <strong>of</strong> municipal facilities in the area, present<br />
interesting co-location opportunities for businesses or municipal services. New York Avenue<br />
should be reviewed for the possibility <strong>of</strong> a creating a convenience retail corridor, given its high<br />
visibility and high traffic volumes.<br />
Area 21 <strong>of</strong> the October 19, 2005 DRAFT Land Use Change Map is an infill area. It is a<br />
Development Opportunity Areas under the existing Comprehensive Plan.<br />
KEY F<strong>IN</strong>D<strong>IN</strong>GS<br />
The area is home to a wide variety <strong>of</strong> users, and the V Street corridor is particularly<br />
robust. Appropriate zoning and land use policies should be enacted to preserve the<br />
V Street industrial area in use and character.<br />
Several municipal government uses exist in the area. Two police (MPD) facilities<br />
provide an opportunity for consolidation. A large WMATA bus garage facility presents<br />
some opportunity for more efficient use through technical innovations. Open space<br />
on federal government land is an opportunity for DPR to collocate with NPS or other<br />
park-like agency.<br />
Government/ public sector use zones should be established where the real estate<br />
market permits cost-feasible development.<br />
- 133 -
<strong>District</strong> <strong>of</strong> Columbia Industrial Areas Study DC Office <strong>of</strong> Planning<br />
Prepared by Phillips Preiss Shapiro Associates, Inc.<br />
6.2.10 NEW YORK AVENUE/IVY <strong>CITY</strong><br />
PHYSICAL CHARACTERISTICS<br />
Location and Land Area This site is approximately bordered by W Street to the north,<br />
Brentwood Road to the west, and Mt. Olivet Road and cemetery to the east and south. It<br />
encompasses 249.34 acres, or 9.47 percent <strong>of</strong> industrial study areas.<br />
Building Typologies The Hecht warehouse building is the most prominent in the area. It is a<br />
multi-story utilitarian warehouse <strong>of</strong> concrete and brick construction, but is distinguished by its<br />
curved corners and bands <strong>of</strong> glass brick windows. The northwestern portion <strong>of</strong> the site is a mix<br />
<strong>of</strong> industrial and commercial buildings, including new <strong>of</strong>fice buildings for telephone and<br />
television companies. Low-lying horizontal block type buildings make up the balance <strong>of</strong> the Ivy<br />
City area.<br />
General Site Condition The northwest portion <strong>of</strong> the site is in good condition, with new<br />
buildings and clean sites. Several smaller structures appear vacant or abandoned however.<br />
This problem is very apparent in the Ivy City area; an older neighborhood around the Hecht<br />
building is now reduced to vacant lots and the occasional residence. The <strong>District</strong> DPW sites,<br />
Hecht building, and smaller warehouses are all well-used and well-maintained, though it is our<br />
opinion that the DPW site is not configured optimally and could accommodate additional use<br />
intensity.<br />
<strong>LAND</strong> USE<br />
Land Use, General Character, and Function The most prominent site along New York<br />
Avenue, NE in the Ivy City area is the Hecht’s Department Store warehouse. This building is still<br />
in use and occupies a prime site enjoying convenient access to truck transportation routes. Also<br />
present include a historic school building, a school bus parking lot, a nightclub, food distributors,<br />
a large school bus parking lot, and a small core <strong>of</strong> dilapidated residential structures. Along West<br />
Virginia Avenue are a large number <strong>of</strong> municipal users including a municipal vehicle inspection<br />
lot, bus facilities, and distribution users. The northwestern portion <strong>of</strong> the site, <strong>of</strong>f <strong>of</strong> Brentwood<br />
Road, is home to telecom and technology uses such as Verizon and BET (Black Entertainment<br />
Television). A waste transfer facility is also located there, <strong>of</strong>f <strong>of</strong> W Street. The railroads<br />
dominate the middle <strong>of</strong> the area.<br />
Surrounding Land Use Context Industrial uses and railroads border to the north, east and<br />
west. The site is bordered to the south by Mt. Olivet Cemetery and stable residential<br />
neighborhoods.<br />
Access and Circulation Access from Brentwood Road, New York Avenue and West<br />
Virginia Avenue is excellent. However, truck circulation within the Ivy City/Hecht building area is<br />
constrained by narrow streets. The municipal facilities <strong>of</strong>f <strong>of</strong> West Virginia have sufficient access<br />
and circulation.<br />
- 134 -
<strong>District</strong> <strong>of</strong> Columbia Industrial Areas Study DC Office <strong>of</strong> Planning<br />
Prepared by Phillips Preiss Shapiro Associates, Inc.<br />
PROPERTY DATA<br />
Major Tenants Amtrak, Verizon, BET, Hecht’s (owned by Federated Department stores),<br />
and the <strong>District</strong> own a significant portion <strong>of</strong> the area’s properties.<br />
Ownership Patterns and Property Assemblages Federated Department Stores (Hecht<br />
Building), BET, and the <strong>District</strong> control the most significant assemblages.<br />
OTHER<br />
Environmental Issues Railroad yards, waste transfer, bus parking, and municipal vehicle<br />
parking all raise environmental concerns.<br />
Historically or Architecturally Significant Buildings The Hecht building, an abandoned school,<br />
and other warehouses are all worthy <strong>of</strong> historic consideration. The Hecht building is a landmark.<br />
Development Pressures There are no known rezoning requests for this area. Given the<br />
prominence <strong>of</strong> municipal maintenance facilities and the lack <strong>of</strong> a Metro stop, it is unlikely that<br />
residential development will encroach upon the area anytime soon. However, should Gallaudet<br />
University seek to expand its campus, it could look northward into the low density area across<br />
Mt. Olivet Road. Also, the residential area is targeted by the <strong>District</strong> as a pilot site for its Home<br />
Again Initiative.<br />
Other Planning Issues The <strong>District</strong>’s vehicle maintenance facilities occupy much <strong>of</strong> the<br />
southern portion <strong>of</strong> the Ivy City area. Given the particular use and large area occupied, it would<br />
be very difficult to relocate these facilities if they are forced out by real estate pressures. Much<br />
<strong>of</strong> the <strong>District</strong>-owned land area seems under-utilized, however. Co-location and concentration <strong>of</strong><br />
more municipal facilities would be an excellent way to optimize these sites.<br />
KEY F<strong>IN</strong>D<strong>IN</strong>GS<br />
The DPW campus on West Virginia Avenue is an excellent opportunity for<br />
consolidation and collocation <strong>of</strong> municipal fleet maintenance activities. It should be<br />
protected as a municipal service area<br />
The northwestern portion <strong>of</strong> this sub-area houses a robust concentration <strong>of</strong><br />
information and communications users – this area should be protected and<br />
intensified<br />
The Hecht warehouse building is a landmark whose appearance and function should<br />
be preserved.<br />
The residential area targeted for the Home Again Initiative should include residential<br />
uses that are compatible with their industrial neighbors.<br />
- 135 -
<strong>District</strong> <strong>of</strong> Columbia Industrial Areas Study DC Office <strong>of</strong> Planning<br />
Prepared by Phillips Preiss Shapiro Associates, Inc.<br />
There is little development pressure on this sub-area. It is a prime location for uses<br />
such as information and communications, warehousing and transportation, and<br />
heavy municipal operations. Appropriate zoning and land use policies should be<br />
enacted to preserve this industrial area in use and character.<br />
6.2.11 WATER STREET, SE AND 11TH STREET, SE<br />
PHYSICAL CHARACTERISTICS<br />
Location and Land Area This sub-area is located on the west bank <strong>of</strong> the Anacostia River<br />
east <strong>of</strong> 11 th Street, SE, south <strong>of</strong> I-295 and the Congressional Cemetery, and south <strong>of</strong> the<br />
Baltimore & Washington Railroad Bridge. Pennsylvania Avenue, SE cuts the site in two pieces:<br />
Water Street, SE is the northeastern portion and 11th Street, SE is the southwestern portion<br />
(according to the labels on the map). In total, these sub-areas amount to 37.0 acres,<br />
representing 1.41 percent <strong>of</strong> the <strong>District</strong>’s industrial study areas.<br />
Building Typologies Buildings along the river appear to be marina and boating facilities,<br />
including docks, and are low-rise. Several buildings in 11th Street, SE, on the Maritime Plaza<br />
site, are medium-rise brick and concrete commercial buildings.<br />
General Site Condition The site appears to be in good condition, but numerous open and<br />
apparently vacant parking lots and large cylindrical tanks <strong>of</strong> an unknown nature contribute to a<br />
decidedly “no man’s land” feel.<br />
<strong>LAND</strong> USE<br />
Land Use, General Character, and Function The area contains commercial, industrial,<br />
and parking uses. Quite a large amount <strong>of</strong> the land is unimproved and vacant surface parking,<br />
or is under / adjacent to freeways, bridges, and railway tracks. Marina buildings, on what is<br />
currently National Park Service land, line the waterfront. At the north-west corner <strong>of</strong> the 11 th<br />
Street area is a mixed use subarea, including some light industrial, warehouse, and open space<br />
uses.<br />
Surrounding Land Use Context I-295, the CSX railroad corridor, and the 11 th Street bridges<br />
isolate these areas from surrounding land uses. The Navy Yard is beyond 11th Street to the<br />
west, and to the north <strong>of</strong> I-295 lie moderate density residential areas, and open space in the<br />
form <strong>of</strong> a Congressional cemetery.<br />
Access and Circulation The area is neither particularly accessible nor inviting to the<br />
public. O Street, SE and M Street, SE provide some access from the west, and an access road<br />
to RFK Stadium provides very limited access from the north east.<br />
- 136 -
<strong>District</strong> <strong>of</strong> Columbia Industrial Areas Study DC Office <strong>of</strong> Planning<br />
Prepared by Phillips Preiss Shapiro Associates, Inc.<br />
PROPERTY DATA<br />
Major Tenants Washington Gas and Light Company, CSX railroad, and the Federal<br />
government are the major tenants.<br />
Ownership Patterns and Property Assemblages Washington Gas and Light Company, CSX<br />
railroad, and the Federal government are the land owners.<br />
OTHER<br />
Environmental Issues It is likely that many portions <strong>of</strong> the area have surface and<br />
subsurface contamination along the rail corridor, and, perhaps, around the old storage tanks.<br />
Historically or Architecturally Significant Buildings There are no known historic or historiceligible<br />
buildings. A portion <strong>of</strong> the area at the north-west corner <strong>of</strong> the 11 th Street area is within<br />
the Capitol Hill Historic <strong>District</strong>.<br />
Development Pressures A large <strong>of</strong>fice and/or hotel proposal is pending for the Maritime<br />
Plaza site, zoned M. This would be a by-right development. A proposal for a small adjacent<br />
piece <strong>of</strong> land which included a rezoning to allow residential development was received but was<br />
not set down for a public hearing by the Zoning Commission, pending completion <strong>of</strong> this study.<br />
Other Planning Issues The Anacostia Waterfront Initiative (AWI) targets this area and<br />
surrounding areas as part <strong>of</strong> a plan to improve access to the waterfront and make connections<br />
across the river and between neighborhoods. A spur <strong>of</strong> the proposed light rail line is planned to<br />
run through this area to RFK Stadium. Major waterfront open space developments are planned.<br />
KEY F<strong>IN</strong>D<strong>IN</strong>GS<br />
Both <strong>of</strong> these areas enjoy good highway, rail, and water access. They are also<br />
strategic locations for municipal uses.<br />
Both areas are underutilized, but their utility and road infrastructure are unknown.<br />
Both areas are targeted for open space and mixed-use development under the AWI.<br />
Given their advantages in transportation access, available land, and relative isolation<br />
from residential uses, consideration should be given to retaining at least portions <strong>of</strong><br />
these sites for light industrial uses compatible with open space/waterfront<br />
redevelopment. Perhaps secure records storage facilities or drop screening facilities<br />
could be located here (little pollution, noise, etc + good access to Capitol Hill and<br />
Downtown), particularly in underutilized areas under the highway overpasses.<br />
Small portions to the north and west are appropriate for land use change.<br />
- 137 -
<strong>District</strong> <strong>of</strong> Columbia Industrial Areas Study DC Office <strong>of</strong> Planning<br />
Prepared by Phillips Preiss Shapiro Associates, Inc.<br />
6.2.12 BENN<strong>IN</strong>G ROAD, NE<br />
PHYSICAL CHARACTERISTICS<br />
Location and Land Area Benning Road sits on the east side <strong>of</strong> the Anacostia River,<br />
bounded on the west by the river and Anacostia Avenue, on the north by Anacostia Park and<br />
Foote Street, on the east by I-295 and Kennilworth Avenue, and on the south by Benning Road<br />
itself. The site is 99.86acres, representing 3.79 percent <strong>of</strong> total industrial land study areas.<br />
Building Typologies The area is dominated by the PEPCO (Potomac Electric Power<br />
Company) power plant. The buildings <strong>of</strong> the PEPCO site are <strong>of</strong> varying size and construction.<br />
Because <strong>of</strong> restricted access, it was impossible to determine age or individual uses (e.g. <strong>of</strong>fice,<br />
transformer stations, vehicle facilities, etc.). There is a Federal facility behind the PEPCO plant<br />
on the far north edge <strong>of</strong> the site which appears to be a power plant, but surveys were unable to<br />
determine its exact function or type.<br />
General Site Condition The site is distinctly industrial but appeared well maintained.<br />
Access roads are limited and <strong>of</strong> varying quality.<br />
<strong>LAND</strong> USE<br />
Land Use, General Character, and Function The PEPCO plant is strictly industrial and<br />
functions as a peaking plant for the <strong>District</strong>, operating only about 30 days per year. PEPCO also<br />
maintains a very large service fleet on the site. A Federal power plant also appears to be<br />
located to the north and west <strong>of</strong> PEPCO. Several buildings south <strong>of</strong> Benning Road, NE at I-295<br />
are commercial and auto-oriented. To the immediate west <strong>of</strong> PEPCO, on Anacostia Avenue, is<br />
a solid waste transfer facility which handles about one-third <strong>of</strong> the <strong>District</strong>’s trash (the balance is<br />
taken to Fort Totten).<br />
Surrounding Land Use Context The PEPCO plant is surrounded on the west and north by<br />
open space. The Metro track carrying the Orange and Blue lines is elevated above Benning<br />
Road’s northerly edge and, along with the power plant itself, is a major visual mark on the<br />
landscape. To the east is the Parkside residential neighborhood, for which a proposal to<br />
significantly increase density is in process. That development is intended to include as many as<br />
2,000 new residential units in a mix <strong>of</strong> low to high rise buildings, plus new <strong>of</strong>fice and retail<br />
space. Across Kennilworth and I-295 to the west are low-density residential developments, and<br />
across Benning Road, NE to the south are commercial uses including auto repair, convenience<br />
shopping, and low-rise <strong>of</strong>fice space.<br />
Access and Circulation The Metro Orange line stops at Minnesota Avenue just north <strong>of</strong><br />
Benning. This station serves mainly surrounding residential neighborhoods and does not<br />
provide ready access to the industrial areas. In terms <strong>of</strong> vehicular access, Benning Road, NE, I-<br />
295, and Minnesota Avenue, NE all provide good access into the area. However, Benning Road<br />
is very poorly maintained and the sheer volumes <strong>of</strong> cars on it and I-295 make entrance and<br />
- 138 -
<strong>District</strong> <strong>of</strong> Columbia Industrial Areas Study DC Office <strong>of</strong> Planning<br />
Prepared by Phillips Preiss Shapiro Associates, Inc.<br />
egress difficult and dangerous. The PEPCO plant has one main gate, and is generally very<br />
restricted. The public cannot enter or pass through this very large site.<br />
PROPERTY DATA<br />
Major Tenants PEPCO is the major tenant. Its facility is gigantic; its buildings and stacks<br />
dominate the surrounding landscape. Also, the <strong>District</strong> Department <strong>of</strong> Public Works maintains<br />
the Benning Road Waste Transfer facility.<br />
Ownership Patterns and Property Assemblages PEPCO is the major owner at Benning<br />
Road.<br />
OTHER<br />
Environmental Issues Numerous issues, caused by the PEPCO power plant and the<br />
Benning Road waste transfer facility, are likely to include toxic chemicals and fine particulates,<br />
truck traffic and associated pollution, noise, and vermin. In addition, traffic on Benning Road and<br />
I-295 are likely to contribute localized noise and tailpipe pollution.<br />
Historically or Architecturally Significant Buildings There are no known historic or historiceligible<br />
buildings.<br />
Development Pressures There are no known development pressures directly on the<br />
Benning Road site, although the new Parkside development will be directly to the east, with new<br />
residential units overlooking the power plant. As discussed below in the Kennilworth sub-area<br />
description, the <strong>District</strong> is also planning a Government Center and transit oriented development<br />
around the Minnesota Avenue Metro.<br />
Other Planning Issues PEPCO has considered selling or leasing a portion <strong>of</strong> its site in the<br />
past. The Anacostia Waterfront Initiative (AWI) is targeting the waterfront near Benning Road for<br />
the development <strong>of</strong> a riverfront greenway trail, and for access to Kingman Island in the<br />
Anacostia River.<br />
KEY F<strong>IN</strong>D<strong>IN</strong>GS<br />
This sub-area received a total score <strong>of</strong> 41, tying it for fifth best.<br />
The site is comprised <strong>of</strong> heavy industrial uses and should remain industrial in<br />
function.<br />
Appropriate zoning and land use policies, especially a designation for utility and<br />
municipal uses, should be enacted to preserve this industrial area in use and<br />
character.<br />
The <strong>District</strong> should discuss with PEPCO the possibility <strong>of</strong> buying or leasing a<br />
significant portion <strong>of</strong> the land. It presents an excellent location for municipal services<br />
being moved from Buzzard Point.<br />
- 139 -
<strong>District</strong> <strong>of</strong> Columbia Industrial Areas Study DC Office <strong>of</strong> Planning<br />
Prepared by Phillips Preiss Shapiro Associates, Inc.<br />
6.2.13 CSX2—KENNILWORTH<br />
PHYSICAL CHARACTERISTICS<br />
Location and Land Area CSX2—Kennilworth is a long narrow strip <strong>of</strong> industrial land<br />
running along both sides <strong>of</strong> I-295 and Minnesota Avenue, SE from just north <strong>of</strong> Massachusetts<br />
Avenue, SE to the <strong>District</strong>’s Maryland border at Eastern Avenue. This corridor totals about<br />
158.04 acres, representing 6.0 percent <strong>of</strong> the <strong>District</strong>’s industrial land.<br />
Building Typologies Buildings in this area are predominately low-slung brick and/or concrete<br />
block buildings. Many, particularly the auto- and transportation-related uses, are <strong>of</strong> newer<br />
vintage. Several, however, are perhaps relics <strong>of</strong> the age when warehouses fronted the railroad<br />
lines; they are now either vacant or occupied by other commercial/industrial facilities.<br />
General Site Condition The conditions vary widely. Along I-295, some sites are heavilytrafficked<br />
and their appearance belies this. Some <strong>of</strong> these lots are vacant, save for rusting metal<br />
and overgrown brush. The sites <strong>of</strong>f <strong>of</strong> Minnesota Avenue, SE are generally more wellmaintained<br />
and cleaner, with a not un-inviting appearance and fair to good access.<br />
<strong>LAND</strong> USE<br />
Land Use, General Character, and Function This sub-area is basically a very narrow<br />
strip <strong>of</strong> industrial land hugging close to the CSX (B&O) rail corridor and I-295. As such, the most<br />
prominent land uses are commercial auto-related enterprises such as gas stations and auto<br />
repair, accessible via Kennilworth Avenue (which acts as an I-295 service road). There are also<br />
several small warehouses and self-storage buildings along Kennilworth. On the other side <strong>of</strong> the<br />
railroad corridor to the east, Minnesota Avenue is home to several small religious institutions<br />
and a Metro station (Orange Line: Deanwood). At Minnesota Avenue and Nannie Helen<br />
Burroughs Avenue there is a fast food restaurant and what is apparently a storage building.<br />
Between Benning Road and Hayes Street is a Metro station (Orange Line: Minnesota Avenue),<br />
which serves the surrounding mixed-use and residential areas.<br />
Surrounding Land Use Context As noted above, residential and commercial mixed-uses<br />
surround the Minnesota Avenue Metro station. Moderate density residential areas surround the<br />
Deanwood Metro station.<br />
Access and Circulation Access from the residential areas is good, as Minnesota Avenue<br />
and Kennilworth Avenue are capable <strong>of</strong> carrying medium volumes <strong>of</strong> traffic and heavy loads.<br />
Transit across the corridor is severely limited by the expressway and railroad right-<strong>of</strong> ways,<br />
however. Also, as noted above, two Metro stations are located within this industrial corridor.<br />
PROPERTY DATA<br />
Major Tenants Major tenants include WMATA (Metro stations and parking lots),<br />
Churches and religious institutions, and auto-related commercial uses.<br />
- 140 -
<strong>District</strong> <strong>of</strong> Columbia Industrial Areas Study DC Office <strong>of</strong> Planning<br />
Prepared by Phillips Preiss Shapiro Associates, Inc.<br />
Ownership Patterns and Property Assemblages Several owners carry multiple small<br />
properties, but there are no significant concentrations <strong>of</strong> large properties under one owner.<br />
OTHER<br />
Environmental Issues We presume that the railroad and the expressway have related<br />
pollution and noise, and the auto-related uses such as gas stations may present environmental<br />
issues.<br />
Historically or Architecturally Significant Buildings There are no known historic or historiceligible<br />
buildings.<br />
Development Pressures The <strong>District</strong> intends to locate several government <strong>of</strong>fices near the<br />
Minnesota Avenue Metro to form a Government Center and promote local retail and commercial<br />
development.<br />
Other Planning Issues The Government Center will also be the terminus for the proposed<br />
light rail line, part <strong>of</strong> the Anacostia Waterfront Initiative (AWI). A transit-oriented, mixed-use<br />
neighborhood with ground floor retail will be developed around the Center. Also, AWI’s “East <strong>of</strong><br />
the River Gateways” project hopes to reconnect areas east <strong>of</strong> I-295 back to the waterfront with<br />
streetscape, bridge, and pedestrian improvements.<br />
KEY F<strong>IN</strong>D<strong>IN</strong>GS<br />
Small, shallow lots along Kennilworth Avenue and the railroad tracks characterize<br />
the area. There is little room for expansion.<br />
The area does present a good location for a concentration <strong>of</strong> automobile-related and<br />
warehouse uses, however.<br />
A land use change to mixed-use, to retain existing businesses but encourage new<br />
development, should be considered.<br />
6.2.14 ANACOSTIA—POPLAR PO<strong>IN</strong>T—CSX2—FAIRLAWN<br />
PHYSICAL CHARACTERISTICS<br />
Location and Land Area The Anacostia—Poplar Point—CSX2- Fairlawn area is located<br />
just east <strong>of</strong> the Anacostia River along I-295, approximately between South Capitol Street and<br />
Massachusetts Avenue, SE. It is a narrow corridor that hugs the I-295 and CSX right-<strong>of</strong>-way,<br />
overlooking the Anacostia River. The land totals about 135.85 acres (5.16 percent <strong>of</strong> total<br />
industrial study areas). Anacostia Poplar Point, the southern-most sub area, where South<br />
Capitol Street and I-295 converge, and including the Metro station (Green Line: Anacostia),<br />
totals about 59.99 acres. CSX2 Anacostia Fairlawn, from just north <strong>of</strong> the Metro station to just<br />
north <strong>of</strong> Massachusetts Avenue, SE, is a long narrow strip totaling 75.86 acres.<br />
- 141 -
<strong>District</strong> <strong>of</strong> Columbia Industrial Areas Study DC Office <strong>of</strong> Planning<br />
Prepared by Phillips Preiss Shapiro Associates, Inc.<br />
Building Typologies The building typologies are very mixed, ranging from low concrete<br />
structures for auto repair uses to multi-story brick structures that are evidently former<br />
warehouses.<br />
General Site Condition The long, linear, narrow character <strong>of</strong> this area greatly disperses<br />
the land uses, and even Poplar Point, dominated as it is by the South Capitol Street/I-<br />
295/Suitland Parkway cloverleaf intersection cannot be thought <strong>of</strong> as “one site.” In general,<br />
however, the sites contain run-down concrete structures and vacant lots. The CSX2 Fairlawn<br />
area along I-295 is mostly right-<strong>of</strong>-way and almost devoid <strong>of</strong> use, save for an occasional<br />
automobile-related building.<br />
<strong>LAND</strong> USE<br />
Land Use, General Character, and Function This area contains primarily transportationtype<br />
and automobile related uses, including towing services and a towing storage facility.<br />
Towards the southwestern end <strong>of</strong> this area (Anacostia Poplar Point), there is a small charter<br />
school, a telecommunications building, and a WMATA Metro/Bus station. Several residential<br />
buildings line the streets immediately north <strong>of</strong> the Metro station. Following I-295 in a<br />
northeasterly direction from the Metro station, what users exist are predominately auto-related,<br />
with a few religious institutions occupying former commercial spaces. A rezoning is being<br />
sought by a hotel developer for a parcel paralleling Shannon Place between V and W Street,<br />
SE.<br />
Surrounding Land Use Context Bordering this area to the south, on the other side <strong>of</strong> Martin<br />
Luther King Jr. Avenue, is Berry Farms, a low-rise housing complex in very poor condition.<br />
Residential areas also border to the east. To the north <strong>of</strong> this area and extending northwestward<br />
along the Anacostia River is Poplar Point, an open space included in the Anacostia Waterfront<br />
Initiative plan. The areas around the Metro station and Martin Luther King Jr. Avenue at Good<br />
Hope Road (Fairlawn) are emerging neighborhood commercial centers.<br />
Access and Circulation I-295, Suitland Parkway, SE, and South Capitol Street converge in<br />
the Anacostia Poplar Point Area, providing good arterial access to the area. However, signage<br />
is poor and the cloverleaf design is confusing. (A redesign <strong>of</strong> this interchange is proposed by D-<br />
DOT.) Traffic lights interrupt traffic flow, and the intersections are very dangerous. The<br />
commercial area emerging around the Metro station and around Good Hope Road has very<br />
poor circulation due to poor one-way street patterns and streets end abruptly against the I-295<br />
right-<strong>of</strong>-way. There is currently little or no access across I-295 to the River.<br />
PROPERTY DATA<br />
Major Tenants Major tenants include a towing and truck storage facility, a charter school,<br />
a news distribution building, a Verizon telecom building, and the WMATA Metro/bus station.<br />
- 142 -
<strong>District</strong> <strong>of</strong> Columbia Industrial Areas Study DC Office <strong>of</strong> Planning<br />
Prepared by Phillips Preiss Shapiro Associates, Inc.<br />
Ownership Patterns and Property Assemblages The <strong>District</strong> and WMATA are the major<br />
property owners in the area.<br />
OTHER<br />
Environmental Issues There are no known environmental hazards in the area. However,<br />
it is probable that fuel leakage and run<strong>of</strong>f from the towing yard, auto repair shops, and from I-<br />
295 itself present some soil and water contamination problems.<br />
Historically or Architecturally Significant Buildings There are no apparent historic or historiceligible<br />
buildings in the study area. A school and several buildings along Martin Luther King Jr.<br />
Avenue may be historic and deserve recognition.<br />
Development Pressures The only known pressure is a rezoning request submitted for a<br />
120-unit hotel on a parcel on the southerly side <strong>of</strong> I-295, paralleling Shannon Place between V<br />
and W Street, SE. The area is currently home to auto/transportation uses.<br />
Other planning Issues The Anacostia Waterfront Initiative (AWI) includes some <strong>of</strong><br />
Anacostia Poplar Point in its plan. While the AWI does not currently contemplate developing on<br />
the industrial land in this study area, its adjacent land improvements, including a 60-acre<br />
waterfront cultural park, will most likely draw its own real estate and speculative development<br />
pressures, for both residential and commercial uses. Also, the DC United pr<strong>of</strong>essional soccer<br />
team has proposed a stadium and mixed-use development for the Poplar Point parkland. Barry<br />
Farm is in poor condition and in need <strong>of</strong> revitalization.<br />
It is also probable that the area surround the Metro station will see a sort <strong>of</strong> transit-oriented<br />
development (TOD) take place over the next several years. Office, retail, and residential<br />
development will all seek to take advantage <strong>of</strong> this location, only several Metro stops from<br />
Downtown.<br />
Portions <strong>of</strong> the area and environs are listed on the October 19 DRAFT Land Use Change Map<br />
(V, 44, 45) as revitalization and land use change areas.<br />
KEY F<strong>IN</strong>D<strong>IN</strong>GS<br />
Proximity to residential uses and a planned open space development associated with<br />
the AWI do not make this area ideal for heavy industrial use. Rather, its strategic<br />
access could be a good location for municipal uses. The CSX2 corridor should be<br />
rezoned for mixed-use.<br />
Transit-oriented development at the Anacostia Metro and neighborhood Main Street<br />
commercial corridor development will be a boon to this area - mixed-use should be<br />
encouraged around the Metro station.<br />
- 143 -
<strong>District</strong> <strong>of</strong> Columbia Industrial Areas Study DC Office <strong>of</strong> Planning<br />
Prepared by Phillips Preiss Shapiro Associates, Inc.<br />
6.2.15 DC VILLAGE AND BLUE PLA<strong>IN</strong>S<br />
PHYSICAL CHARACTERISTICS<br />
Location and Land Area These areas in the far southwest <strong>of</strong> the <strong>District</strong> are roughly<br />
bounded by Martin Luther King Jr. Avenue, SW on the east and the Potomac River on the west.<br />
Interstate 295 splits the two areas, with Blue Plains to the west and DC Village to the east. The<br />
area slopes down towards Interstate 295 and the Potomac River. In total, the area <strong>of</strong> DC Village<br />
and Blue Plains is 385.44 acres (14.64 percent <strong>of</strong> total industrial land).<br />
Building Typologies The DC Village area is characterized by low one- and two-story square<br />
brick and concrete buildings <strong>of</strong> 1950’s vintage. The Job Corps buildings seem to be in<br />
particularly poor condition. Blue Plains is the <strong>District</strong>’s only wastewater treatment facility,<br />
operated by the DC Water and Sewer Authority (WASA).<br />
General Site Condition The sites are low density and uninviting to a casual visitor. The<br />
municipal areas are gated to restrict access. Overgrown brush, rusting and falling chain-link<br />
fences, and largely empty tracts <strong>of</strong> land abut the major interior circulation roads in DC Village.<br />
Blue Plains is a vast wastewater treatment plant is not accessible to the public.<br />
<strong>LAND</strong> USE<br />
Land Use, General Character, and Function Land use in DC Village is classified as<br />
“Local Public” and is characterized by very low density municipal uses and social service uses.<br />
Several large lots such as the impoundment lot dominate the southern end <strong>of</strong> the area. Small<br />
campuses <strong>of</strong> residential buildings exist in the Job Corps and Family Shelter areas. Blue Plains<br />
Advanced Wastewater Treatment Plant (AWTP) is classified “Industrial” and consists <strong>of</strong><br />
separating tanks, settling ponds, and treatment pools. The Blue Plains AWTP is the largest<br />
advanced wastewater treatment facility <strong>of</strong> its type in the United States.<br />
Surrounding Land Use Context There are residential developments and schools to the<br />
east <strong>of</strong> Martin Luther King Jr. Avenue, SW. The downward slope, dense vegetation, and site<br />
fencing form a distinct boundary between these areas. To the north <strong>of</strong> Blue Plains is the Navy<br />
Research Laboratory.<br />
Access and Circulation The main access road for this area are Blue Plains Drive, SW,<br />
from Martin Luther King Jr. Avenue, SW, and Shepherd Parkway, which is accessible from I-<br />
295. While these major arterial roads provide fair access for the municipal users, they severely<br />
isolate the Job Corps and the Family Shelter from any neighborhood residential or commercial<br />
area, and from the rest <strong>of</strong> the <strong>District</strong> (however there is a Metro bus line through the area). With<br />
the exception <strong>of</strong> roads within the Job Corps complex, all roads are in fair to good condition.<br />
- 144 -
<strong>District</strong> <strong>of</strong> Columbia Industrial Areas Study DC Office <strong>of</strong> Planning<br />
Prepared by Phillips Preiss Shapiro Associates, Inc.<br />
PROPERTY DATA<br />
Major Tenants The only tenant at Blue Plains is WASA. Major tenants in DC Village<br />
include the Potomac Job Corps, DDOT vehicle storage, a DPW towing impoundment lot, a<br />
Police vehicle maintenance facility and K-9 patrol training, a Fire Department training facility,<br />
and an emergency family shelter known as DC Village. Also in this area is the Architect <strong>of</strong> the<br />
Capitol tree farm, Senate Furniture, and an AmeriCorps campus building.<br />
Ownership Patterns and Property Assemblages The <strong>District</strong> is the major, and perhaps sole,<br />
owner <strong>of</strong> all property in DC Village and Blue Plains.<br />
OTHER<br />
Environmental Issues There is no known contamination in the DC Village area, however<br />
it is likely that there are environmental issues such as fuel leakage and other contamination<br />
associated with the impoundment lot. The Blue Plains AWTP facility is subject to strict<br />
environmental requirements in terms <strong>of</strong> treatment and effluent, but it is not a site that would be<br />
readily re-used.<br />
Historically or Architecturally Significant Buildings There are no discernible historic or historiceligible<br />
buildings in these areas.<br />
Development Pressures Blue Plains, <strong>of</strong> course, is not experiencing any development<br />
pressures. While a major residential developer, KSI, proposed a new town center with 865 new<br />
homes, a hotel, and marina for the DC Village area several years ago, the <strong>District</strong> did not act on<br />
the <strong>of</strong>fer and the developer eventually abandoned its plans. As <strong>of</strong> now, there are no known<br />
development pressures on this area. However, there is no doubt that a town center<br />
development here would present a tempting opportunity for the <strong>District</strong> to capture residential<br />
development and retail spending at an Interstate-accessible site bordering Maryland.<br />
Other Planning Issues The DPW Impoundment Lot is very large. It enjoys good access<br />
from the arterials and large interior roadways to accommodate tow trucks and large vehicles.<br />
However, while it seems desirable to have such a land use isolated from vibrant commercial<br />
and residential areas, this is not a very strategic location. As it is, any car picked up in the far<br />
northwest must be towed many miles across the <strong>District</strong> to this single municipal lot. Response<br />
time for towing requests and the accumulated transit time for trucks does not make this an<br />
efficient location.<br />
The DRAFT Land Use Change Map (area Z) identifies this area as a land use change area, and<br />
suggests improved site efficiency and new public and private uses.<br />
- 145 -
<strong>District</strong> <strong>of</strong> Columbia Industrial Areas Study DC Office <strong>of</strong> Planning<br />
Prepared by Phillips Preiss Shapiro Associates, Inc.<br />
KEY F<strong>IN</strong>D<strong>IN</strong>GS<br />
There are no development pressures on Blue Plains; it is likely to remain, and should<br />
remain, industrial land for a long time to come.<br />
DC Village’s conglomeration <strong>of</strong> federal and local public uses are poorly planned.<br />
There is abundant land available. It is insulated from residential uses.<br />
Both areas should be preserved as industrial land, and preferably protected as<br />
municipal service areas.<br />
6.2.16 SCATTERED SITES 1 – 6<br />
6.2.16.1 Scattered Site 1<br />
PHYSICAL CHARACTERISTICS<br />
Location and Land Area This site between 14 th Street NW and Arkansas Avenue NW is<br />
11.19 acres, representing 0.43 percent <strong>of</strong> the <strong>District</strong>’s industrial land.<br />
Building Typologies Approximately six buildings are located on this site. The largest is a lowrise<br />
brick and concrete building. Old industrial brick buildings and church are also on the site.<br />
General Site Condition The portion <strong>of</strong> the site north <strong>of</strong> Buchanan Street is well maintained<br />
and seems to be a “good neighbor.” The portion south <strong>of</strong> Buchanan is generally ill-kept. The<br />
industrial buildings appear abandoned. The church and gasoline station are well-maintained.<br />
<strong>LAND</strong> USE<br />
Land Use, General Character, and Function The major building on the site is a WMATA<br />
Metro bus terminal. Other uses include a gas station, a church, and a vacant former ice factory<br />
or distribution facility.<br />
Surrounding Land Use Context Both low- and moderate-density residential areas surround<br />
this site.<br />
Access and Circulation Arkansas Avenue, Iowa Avenue, and 14 th Street, NW all provide<br />
excellent access to and around the site.<br />
PROPERTY DATA<br />
Major Tenants Major tenants include WMATA, the Ethiopian Orthodox Church, and a<br />
gas station.<br />
Ownership Patterns and Property Assemblages WMATA owns the largest portion <strong>of</strong> this<br />
site—the entire block between Decatur and Buchanan Streets. The bus depot building itself<br />
occupies nearly two-thirds <strong>of</strong> that block.<br />
- 146 -
<strong>District</strong> <strong>of</strong> Columbia Industrial Areas Study DC Office <strong>of</strong> Planning<br />
Prepared by Phillips Preiss Shapiro Associates, Inc.<br />
OTHER<br />
Environmental Issues While no specific contamination is known, run<strong>of</strong>f and other<br />
pollutants from the bus garage may contribute to soil and water contamination. Fumes from<br />
buses probably contribute to high localized particulate levels.<br />
Historically or Architecturally Significant Buildings There are no discernible historic or historiceligible<br />
buildings in these areas.<br />
Development Pressures WMATA has issued an RFP for a joint venture partner to help<br />
redevelop and reposition the site, and possibly relocating the bus garage.<br />
Other Planning Issues Any development on this site should be in keeping with the<br />
surrounding residential area.<br />
KEY F<strong>IN</strong>D<strong>IN</strong>GS<br />
About 1/3 <strong>of</strong> the site is underutilized and is a good site for light and moderate<br />
municipal uses to collocate.<br />
The active WMATA bus depot is strategically located and should remain in use.<br />
6.2.16.2 Scattered Site 2<br />
PHYSICAL CHARACTERISTICS<br />
Location and Land Area Just southeast <strong>of</strong> Scattered Site 1, this scattered site is bounded<br />
by 13 th Street, NW, Upshur Street, Kansas Avenue, and Taylor Street. The site is 10.48 acres,<br />
representing 0.40 percent <strong>of</strong> the <strong>District</strong>’s industrial land.<br />
Building Typologies The buildings are primarily two- and three-story brick and concrete<br />
commercial structures. Several have adjacent parking; one has a parking deck on top.<br />
General Site Condition The buildings and sites are well-used and in good condition. There<br />
do not appear to be any vacancies.<br />
<strong>LAND</strong> USE<br />
Land Use, General Character, and Function This site is primarily a mixture <strong>of</strong> social<br />
service centers and commercial uses. Out <strong>of</strong> thirteen buildings on the site, two are self-storage,<br />
two are auto repair, five are social service related, one is a custom cabinet maker, and one is a<br />
WASA pumping station.<br />
Surrounding Land Use Context Primarily low- and moderate-density residential areas<br />
surround this site. However, a high school and related athletic field/open space border to the<br />
north, across Upshur Street. Kansas Avenue meets Georgia Avenue in a commercial/retail<br />
intersection only one-half block away.<br />
- 147 -
<strong>District</strong> <strong>of</strong> Columbia Industrial Areas Study DC Office <strong>of</strong> Planning<br />
Prepared by Phillips Preiss Shapiro Associates, Inc.<br />
Access and Circulation Access to and circulation to and within the site is excellent.<br />
PROPERTY DATA<br />
Major Tenants WASA maintains a water pumping station on the western side near 13 th<br />
Street. A childhood development center, neighborhood development corporation, Library for the<br />
Deaf and Handicapped, <strong>District</strong> <strong>of</strong>fice, and the High Road School comprise the social service<br />
nature <strong>of</strong> this site. As noted above, there are also two storage buildings and two auto repair<br />
shops, as well as a custom cabinet maker.<br />
Ownership Patterns and Property Assemblages There are no significant assemblages,<br />
although the two largest parcels are held by Himmelfarb Properties, LLC.<br />
OTHER<br />
Environmental Issues There are no known environmental issues at this site.<br />
Historically or Architecturally Significant Buildings There are no discernible historic or historiceligible<br />
buildings in these areas.<br />
Development Pressures There are no known or obvious development pressures on this<br />
site.<br />
Other Planning Issues Any development on this site should be undertaken with the<br />
adjacent school, residential, and neighborhood retail areas in mind.<br />
KEY F<strong>IN</strong>D<strong>IN</strong>GS<br />
This is a concentration <strong>of</strong> neighborhood and social services. There is little or no<br />
vacancy.<br />
Current uses can remain, but adjacent residential and educational users preclude<br />
expansion <strong>of</strong> the area or transition to heavy industrial uses. A mixed-use designation<br />
is appropriate here.<br />
6.2.16.3 Scattered Site 3<br />
PHYSICAL CHARACTERISTICS<br />
Location and Land Area Located on the east side <strong>of</strong> 7 th Street NW between Barry Place on<br />
the north and Florida Avenue on the south, this site occupies 18.81 acres, or about 0.71 percent<br />
<strong>of</strong> the <strong>District</strong>’s industrial land.<br />
- 148 -
<strong>District</strong> <strong>of</strong> Columbia Industrial Areas Study DC Office <strong>of</strong> Planning<br />
Prepared by Phillips Preiss Shapiro Associates, Inc.<br />
Building Typologies The building types vary, but they are primarily old brick industrial<br />
buildings. The one exception to this is the Howard University Hospital. Storefronts with<br />
comparison and convenience retail uses line 7 th Street.<br />
General Site Condition The site and buildings all appear to be in good condition.<br />
<strong>LAND</strong> USE<br />
Land Use, General Character, and Function Except for a few small structures on Florida<br />
Avenue (residences, a small church, and a fast food restaurant), the entire site directly serves<br />
Howard University. Storefronts on 7 th Street are lined with college-oriented retail, including<br />
college apparel, a Starbucks c<strong>of</strong>fee shop, a University bookstore, and a student health center.<br />
There is also a Sickle Cell Disease research center. Buildings on 6 th Street include a power<br />
plant (not known if it is in use), an industrial building (possibly vacant), and a brick industrial<br />
building formerly a Wonder Bread warehouse or factory, now the National Human Genome<br />
Center. Finally, there is the Hospital.<br />
Surrounding Land Use Context The center <strong>of</strong> the Howard University campus lies<br />
immediately to the north and east <strong>of</strong> the site. Across 7 th Street, on its western side, are several<br />
large surface parking lots. Residential areas border to the south.<br />
Access and Circulation In general, access to and circulation within the site are good. The<br />
Hospital occupies a very large superblock type parcel, which impedes 6 th Street, V Street, and<br />
Elm Street.<br />
PROPERTY DATA<br />
Major Tenants Howard University is the major tenant. It maintains a hospital, book store,<br />
health center, and several associated research labs on the site.<br />
Ownership Patterns and Property Assemblages Howard University is the major property<br />
owner.<br />
OTHER<br />
Environmental Issues There are no known environmental issues on the site. However,<br />
the power plant, former industrial buildings, research labs, and hospital could all pose industrial<br />
or medically-related contamination.<br />
Historically or Architecturally Significant Buildings While there are several old industrial<br />
buildings on the site, it does not appear as if any have been listed or are eligible to be listed as<br />
significant.<br />
Development Pressures There are no known development pressures on the site itself.<br />
- 149 -
<strong>District</strong> <strong>of</strong> Columbia Industrial Areas Study DC Office <strong>of</strong> Planning<br />
Prepared by Phillips Preiss Shapiro Associates, Inc.<br />
Other Planning Issues The site functions fairly well from a retail point-<strong>of</strong>-view, serving<br />
both Howard University students and the general public, although well-planned infill<br />
development could maximize the site’s value. Also, although we do not know <strong>of</strong> any such plans,<br />
if Howard University is looking to expand its campus, no doubt it has considered the parking lots<br />
across 7 th Street.<br />
KEY F<strong>IN</strong>D<strong>IN</strong>GS<br />
Howard University is the prime tenant in most <strong>of</strong> these buildings. It currently serves<br />
both medical and university-related retail functions.<br />
The site’s present use and zoning should be maintained. Existing buildings are being<br />
rehabilitated and reused.<br />
While much <strong>of</strong> the frontage along 7 th Street is mixed-use, and a temptation exists to<br />
rezone to a mixed use district, we do not recommend any such action. Such action<br />
could preclude expansion <strong>of</strong> value-added technology and research sectors in the<br />
area.<br />
6.2.16.4 Scattered Site 4<br />
PHYSICAL CHARACTERISTICS<br />
Location and Land Area This site occupies the corner <strong>of</strong>, and several adjacent lots along, T<br />
Street and 9 th Street NW, as well as several parcels along 9½ Street NW, just southwest <strong>of</strong><br />
Howard University and Scattered Site 3. This site occupies only 1.2 acres <strong>of</strong> land.<br />
Building Typologies The buildings are all two- and three-story brick or frame residential<br />
structures.<br />
General Site Condition The site is in fair to poor condition. Several buildings are vacant<br />
and several are under renovation. Several lots are in poor condition.<br />
<strong>LAND</strong> USE<br />
Land Use, General Character, and Function This site is residential in nature and<br />
character.<br />
Surrounding Land Use Context The surrounding area is also residential in nature.<br />
However, more commercial and retail uses appear up the block at the intersection <strong>of</strong> U<br />
Street/Florida Avenue and 9 th Street, an area now sometimes referred to as “Little Ethiopia.”<br />
Access and Circulation Access and circulation is good.<br />
PROPERTY DATA<br />
Major Tenants All <strong>of</strong> the tenants are residential renters or homeowners.<br />
- 150 -
<strong>District</strong> <strong>of</strong> Columbia Industrial Areas Study DC Office <strong>of</strong> Planning<br />
Prepared by Phillips Preiss Shapiro Associates, Inc.<br />
Ownership Patterns and Property Assemblages There are no major property assemblages.<br />
The parcels are held by individuals or as part <strong>of</strong> limited liability real estate corporations.<br />
OTHER<br />
Environmental Issues There are no known or apparent environmental issues.<br />
Historically or Architecturally Significant Buildings There are no discernible historic or historiceligible<br />
buildings in these areas.<br />
Development Pressures It appears that several structures are being rehabilitated and the<br />
commercial uses near U Street/Florida and 9 th Street are also undergoing renovation. The area<br />
may be poised for some broader renewal.<br />
Other Planning Issues The nearby area is sometimes referred to as “Little Ethiopia,” and<br />
the U Street area was once primarily African-American. Neighborhood cultural concerns should<br />
be well-vetted and understood before undertaking any steps toward something like a cultural or<br />
historic district-driven redevelopment plan.<br />
KEY F<strong>IN</strong>D<strong>IN</strong>GS<br />
There is very little, if any, industrial use occurring in this area. We recommend it be<br />
rezoned for residential or mixed-use to spur the further revival <strong>of</strong> the Shaw/Little<br />
Ethiopia neighborhoods.<br />
6.2.16.5 Scattered Site 5<br />
PHYSICAL CHARACTERISTICS<br />
Location and Land Area This site is located east <strong>of</strong> the Anacostia River, on Hayes Street<br />
NE roughly between 50 th Street and Division Avenue. It comprises 2.81 acres <strong>of</strong> land, or 0.11<br />
percent <strong>of</strong> the <strong>District</strong>’s industrial land.<br />
Building Typologies Low-lying concrete and block structure.<br />
General Site Condition The general condition is poor and unsightly. Scrapped autos and<br />
old trucks litter the interior lot.<br />
<strong>LAND</strong> USE<br />
Land Use, General Character, and Function This appears to be an auto-repair or<br />
salvage yard.<br />
- 151 -
<strong>District</strong> <strong>of</strong> Columbia Industrial Areas Study DC Office <strong>of</strong> Planning<br />
Prepared by Phillips Preiss Shapiro Associates, Inc.<br />
Surrounding Land Use Context The surrounding area is a mix <strong>of</strong> moderate-density<br />
residential and low-density commercial uses.<br />
Access and Circulation Access to the site is good.<br />
PROPERTY DATA<br />
Major Tenants There is only one tenant. As yet undetermined.<br />
Ownership Patterns and Property Assemblages The one building on the site is owned by<br />
1915 New York Avenue LP.<br />
OTHER<br />
Environmental Issues Contamination related to auto repair/scrap/salvage.<br />
Historically or Architecturally Significant Buildings There are no discernible historic or historiceligible<br />
buildings in these areas.<br />
Development Pressures There are no known development pressures on the site itself.<br />
Other Planning Issues None<br />
KEY F<strong>IN</strong>D<strong>IN</strong>GS<br />
The site is small, and adjacent land uses make the site inappropriate for heavy uses,<br />
but access to transportation routes make it appropriate for light trucking or<br />
commercial shipping operations.<br />
The site should be rezoned and could be redeveloped for locally serving retail or<br />
shopping, as appropriate.<br />
6.2.16.6 Scattered Site 6<br />
PHYSICAL CHARACTERISTICS<br />
Location and Land Area This site is bordered by E Street SE to the north, 1 st Street to the<br />
east, Virginia Avenue to the south, and South Capitol Street to the west. It encompasses 12.86<br />
acres, or 0.49 percent <strong>of</strong> the <strong>District</strong>’s industrial land.<br />
Building Typologies The buildings are all industrial in nature—primarily a medium sized-power<br />
plant.<br />
General Site Condition The site appears to be in good condition. It is well-guarded and<br />
fenced.<br />
- 152 -
<strong>District</strong> <strong>of</strong> Columbia Industrial Areas Study DC Office <strong>of</strong> Planning<br />
Prepared by Phillips Preiss Shapiro Associates, Inc.<br />
<strong>LAND</strong> USE<br />
Land Use, General Character, and Function This site is home to the U.S. Capitol Power<br />
Plant, which provides steam for heating and chilled water for cooling the entire Capitol complex.<br />
Surrounding Land Use Context Some residential is located nearby, but the primary uses<br />
are medium-high density commercial uses. So the immediate south are CSX railroad tracks<br />
which extend southeast to 11th Street, SE and across the Anacostia, northeast through<br />
Southwest and then across the Potomac into Virginia, and spur into Buzzard Point and the<br />
Power Plan complex itself.<br />
Access and Circulation Getting to the site is easy. Access to this well-guarded site is<br />
highly restricted.<br />
PROPERTY DATA<br />
Major Tenants The one tenant is the U.S. Capitol Power Plant.<br />
Ownership Patterns and Property Assemblages The Federal government owns this land.<br />
OTHER<br />
Environmental Issues We were unable to discern exactly what fuel is burned at this<br />
facility, but given its vintage (1910) we presume it is oil or coal. It may have been upgraded to<br />
natural gas, <strong>of</strong> course. In any case, there would be numerous associated environmental issues<br />
including air, water, and soil pollution.<br />
Historically or Architecturally Significant Buildings The power plant was built in 1910, and may<br />
be eligible for historic listing, though we were unable to determine this for ourselves.<br />
Development Pressures There are no known development pressures on this land.<br />
Other Planning Issues It is unlikely that the Federal government will ever relinquish<br />
control and operation <strong>of</strong> this facility.<br />
KEY F<strong>IN</strong>D<strong>IN</strong>GS<br />
The presence <strong>of</strong> the U.S. Capitol power plant makes it unreasonable to seek any<br />
change in land use.<br />
Security concerns and the small size also preclude any private users on the site, but<br />
foresighted federal planning should consider locating additional appropriate federal<br />
users on the site.<br />
- 153 -
<strong>District</strong> <strong>of</strong> Columbia Industrial Areas Study DC Office <strong>of</strong> Planning<br />
Prepared by Phillips Preiss Shapiro Associates, Inc.<br />
6.3 OPPORTUNITIES AND CONSTRA<strong>IN</strong>TS MATRIX<br />
Based on the field surveys and mapping, an Opportunities and Constraints matrix was prepared<br />
to assess particular attributes <strong>of</strong> each industrially-zoned sub area. The purpose <strong>of</strong> the matrix<br />
was to identify areas appropriate for retention strategies or for land use change; as well as to<br />
suggest specific strategies aimed addressing identified issues. The matrix can be found on the<br />
following pages.<br />
- 154 -
<strong>District</strong> <strong>of</strong> Columbia Industrial Areas Study DC Office <strong>of</strong> Planning<br />
Prepared by Phillips Preiss Shapiro Associates, Inc.<br />
Sub-Area Total<br />
Acres<br />
Anacostia –<br />
Poplar Point<br />
Benning<br />
Road<br />
Bladensburg<br />
- Fort Lincoln<br />
PDR Opportunities PDR Constraints Suitable for<br />
Continued<br />
PDR Use?<br />
59.99 Good arterial access<br />
Close to downtown CBD<br />
Government center being<br />
located at Metro nearby –<br />
to include <strong>District</strong> DOT<br />
and possible WMATA.<br />
AWI to redevelop<br />
parkland, provide<br />
waterfront access<br />
Opportunity to promote<br />
government center uses in<br />
close proximity to<br />
downtown CBD and<br />
promote transit oriented<br />
development<br />
99.86 PEPCO may consider<br />
selling or leasing some<br />
portion <strong>of</strong> site, moving<br />
fleet elsewhere<br />
Prime site for strategic<br />
location <strong>of</strong> municipal users<br />
– “Municipal Use Area”<br />
Acquire some land across<br />
Benning Road (southern<br />
side <strong>of</strong> road) for PDR or<br />
government use?<br />
32.93 Good access to<br />
Bladensburg Road<br />
Poor internal circulation<br />
Residential area to the<br />
south and east, would<br />
preclude “heavy”<br />
industrial use<br />
Small, irregular parcels<br />
not attractive to private<br />
sector PDR uses<br />
Anacostia Metro station<br />
transit-oriented, mixeduse<br />
plans<br />
South Capitol St. Bridge<br />
realignment<br />
Proposed AWI open<br />
space and Metro Stars<br />
soccer stadium/mixed<br />
use development<br />
Benning Road in need <strong>of</strong><br />
repair.<br />
PEPCO site secure,<br />
access therefore difficult<br />
Surrounding residential<br />
communities<br />
Existing houses <strong>of</strong><br />
worship<br />
Constrained sites & small<br />
parcel sizes<br />
- 155 -<br />
Yes<br />
If Yes,<br />
Private or<br />
Public Use?<br />
Recommendation Policy Map &<br />
Area Number<br />
Public Plan for strategic public<br />
use in connection with<br />
new government center<br />
and area plans<br />
Yes Public Maintain industrial use<br />
and character<br />
Pursue purchase or lease<br />
<strong>of</strong> PEPCO property.<br />
Consider a utility or<br />
municipal service<br />
designation.<br />
No Consider land use<br />
change to mixed-use<br />
(MXD)<br />
Buffer from adjacent<br />
residential<br />
neighborhoods<br />
Map 4.3<br />
Area 7<br />
Map 4.3<br />
Area 5<br />
Map 4.4<br />
Area 11
<strong>District</strong> <strong>of</strong> Columbia Industrial Areas Study DC Office <strong>of</strong> Planning<br />
Prepared by Phillips Preiss Shapiro Associates, Inc.<br />
Sub-Area Total<br />
Acres<br />
Buzzard<br />
Point<br />
PDR Opportunities PDR Constraints Suitable for<br />
Continued<br />
PDR Use?<br />
241.96 Excellent transportation<br />
access to all parts <strong>of</strong> DC<br />
Proximity to downtown –<br />
centrally located w/in DC<br />
Presently limited<br />
residential exposure<br />
Vast areas are<br />
underutilized<br />
CSX 1 167.42 Rhode Island Ave Metro<br />
transit oriented<br />
development<br />
One large big box parcel<br />
vacant near Home Depot<br />
Good road and transit<br />
access<br />
Construction,<br />
environmental, and autorelated<br />
concerns west <strong>of</strong><br />
railroad<br />
CSX1 –<br />
Brookland<br />
CSX1 – Fort<br />
Totten<br />
55.34 Existing PDR businesses<br />
are viable and active<br />
98.97 Existing PDR businesses<br />
are viable and active<br />
Good access and<br />
Area has been rezoned.<br />
Industrial uses now nonconforming<br />
Intense development<br />
pressures - planned<br />
ballpark and<br />
development is<br />
increasing land costs<br />
Surrounding residential<br />
uses<br />
Reed Street in need <strong>of</strong><br />
repair<br />
Dangerous intersections<br />
onto Rhode Island Ave.<br />
Development pressures<br />
around Metro station<br />
Surrounding residential<br />
and educational uses<br />
Metro transit oriented<br />
development<br />
Fort Totten Metro transit<br />
oriented development<br />
Rezoning granted for<br />
- 156 -<br />
If Yes,<br />
Private or<br />
Public Use?<br />
Recommendation Policy Map &<br />
Area Number<br />
No Area cannot be<br />
considered for additional<br />
industrial uses.<br />
Yes<br />
Private<br />
Complete build out and<br />
occupancy <strong>of</strong> big box site<br />
– intensify use<br />
Preserve potential<br />
historic buildings for<br />
warehouse or other<br />
commercial use.<br />
No Carefully consider<br />
targeted land use<br />
changes around Rhode<br />
Island metro<br />
Yes<br />
Private Preserve industrial uses<br />
to the north and south <strong>of</strong><br />
Brookland/ CUA Metro<br />
No Rezone to MXD around<br />
Metro<br />
Yes<br />
Private Preserve heavy industrial<br />
uses south <strong>of</strong> the Metro<br />
n/a<br />
Map 4.2<br />
Area 1<br />
Map 4.1<br />
Area 4<br />
Map 4.4<br />
Area 6<br />
Map 4.1<br />
Area 4<br />
Map 4.4<br />
Area 5<br />
Map 4.1<br />
Area 2
<strong>District</strong> <strong>of</strong> Columbia Industrial Areas Study DC Office <strong>of</strong> Planning<br />
Prepared by Phillips Preiss Shapiro Associates, Inc.<br />
Sub-Area Total<br />
Acres<br />
CSX1 –<br />
Lamond<br />
Riggs<br />
CSX1 –<br />
NY/NoMa<br />
CSX2 –<br />
Anacostia<br />
Fairlawn<br />
CSX2 –<br />
Kenilworth<br />
PDR Opportunities PDR Constraints Suitable for<br />
Continued<br />
PDR Use?<br />
- 157 -<br />
If Yes,<br />
Private or<br />
Public Use?<br />
infrastructure for PDR Rocky Gorge residences No Promote mixed-use<br />
transit oriented<br />
development around<br />
Metro station<br />
125.84 Concentration <strong>of</strong> active,<br />
high-value PDR<br />
businesses<br />
Potential industrial<br />
park/protected “PDR<br />
Zone” between Van Buren<br />
St and Riggs Road,<br />
especially on Chillum<br />
Place<br />
76.32 Very underutilized sites<br />
around Uline arena.<br />
Good transportation<br />
access<br />
Air rights from railroad<br />
yards could spur<br />
development<br />
75.86 Good railroad and<br />
highway access<br />
158.04 Good railroad and<br />
highway access<br />
Takoma Metro transitoriented<br />
development<br />
Adjacent residential<br />
neighborhoods and<br />
historic district – very<br />
limited possibility for<br />
industrial area expansion<br />
Much <strong>of</strong> the industrial<br />
land is railroad/Amtrak<br />
Small parcel size<br />
Long, linear, narrow –<br />
absence <strong>of</strong> deep lots<br />
Almost all CSX/I-295<br />
right <strong>of</strong> way – very limited<br />
buildable area<br />
Long, linear, narrow –<br />
absence <strong>of</strong> deep lots<br />
Almost all CSX/I-295<br />
right <strong>of</strong> way – very limited<br />
buildable area<br />
Limited room for<br />
expansion<br />
Yes<br />
Recommendation Policy Map &<br />
Area Number<br />
Private Create industrial park or<br />
PDR zone around<br />
Chillum Pl<br />
No Promote mixed-use<br />
transit oriented<br />
development around<br />
Metro station<br />
Yes Private Consider PDR uses that<br />
are compatible with new<br />
development around<br />
Metro, allow residential<br />
use as accessory<br />
No Land use change to<br />
mixed-use immediately<br />
north <strong>of</strong> Union Station.<br />
Comprehensively plan to<br />
link new developments to<br />
NoMa and market area<br />
No Consider land use<br />
change to mixed-use –<br />
allow existing PDR users<br />
to remain in place<br />
No Concentrate auto and<br />
warehouse uses along<br />
Kennilworth.<br />
Consider land use<br />
change to mixed-use –<br />
allow existing PDR users<br />
to remain in place<br />
Map 4.4<br />
Area 2<br />
Map 4.1<br />
Area 1<br />
Map4.4<br />
Area 1<br />
Map 4.2<br />
Area 3<br />
Map 4.4<br />
Area 8<br />
Map 4.4<br />
Area 13<br />
Map 4.4<br />
Area 13
<strong>District</strong> <strong>of</strong> Columbia Industrial Areas Study DC Office <strong>of</strong> Planning<br />
Prepared by Phillips Preiss Shapiro Associates, Inc.<br />
Sub-Area Total<br />
Acres<br />
DC Village<br />
and Blue<br />
Plains<br />
Fort Lincoln<br />
Urban<br />
Renewal<br />
11th Street,<br />
SE<br />
New York –<br />
Bladensburg<br />
PDR Opportunities PDR Constraints Suitable for<br />
Continued<br />
PDR Use?<br />
385.44 Abundant underutilized<br />
space<br />
Very isolated - limited<br />
residential exposure<br />
Prime area for municipal<br />
uses, especially “locally<br />
undesirable uses”<br />
91.88 Abundant vacant land<br />
Excellent road access and<br />
circulation<br />
73.91 Good highway, rail, and<br />
water access – especially<br />
proximate to Capitol and<br />
Downtown<br />
Relatively inaccessible to<br />
the public – secure site<br />
Strategic location for<br />
municipal users<br />
348.10 V Street PDR businesses<br />
very active and viable<br />
Excellent access to NY<br />
Avenue<br />
Underutilized federal<br />
government land south <strong>of</strong><br />
NY Ave. bordering<br />
Arboretum Mixed-use<br />
commercial and retail on<br />
Use are very poorly<br />
organized<br />
Blue Plains Sewage<br />
Treatment Plant –<br />
essentially <strong>of</strong>f limits to<br />
PDR development<br />
Limited transportation<br />
and public transit access<br />
Poor building conditions<br />
at DC Village<br />
Not industrially zoned<br />
Big box retail<br />
programmed for much <strong>of</strong><br />
the site<br />
Waterfront open space<br />
plans<br />
Existing commercial uses<br />
in northwestern portion <strong>of</strong><br />
site<br />
National Arboretum<br />
borders on the south<br />
Private development<br />
focused on NY Avenue<br />
and west <strong>of</strong> Bladensburg<br />
- 158 -<br />
If Yes,<br />
Private or<br />
Public Use?<br />
Recommendation Policy Map &<br />
Area Number<br />
Yes Public Retain existing industrial<br />
designations.<br />
Maximize use <strong>of</strong> land at<br />
DC Village.<br />
Concentrate local and<br />
federal government<br />
functions.- consider<br />
designation for public use<br />
Implement Master Plan<br />
for DC Village area<br />
Yes, for<br />
light<br />
industry<br />
or<br />
shipping<br />
uses<br />
Private Heavy industry not<br />
appropriate. Existing<br />
distributor and other like<br />
uses are appropriate.<br />
Intensify land use.<br />
Encourage R&D <strong>of</strong>fice<br />
park or public sector PDR<br />
use, if big box retail is a<br />
no go<br />
Yes Public Consider light industrial<br />
or municipal uses<br />
compatible with open<br />
space and waterfront<br />
access.<br />
Good location for secure<br />
records storage<br />
No Consider land use<br />
change<br />
Yes<br />
Private<br />
Public<br />
Enact zoning regulations<br />
and create industrial<br />
district to preserve and<br />
enhance V Street<br />
corridor.<br />
Encourage collocation <strong>of</strong><br />
existing municipal<br />
facilities, and consider<br />
municipal service zone<br />
south <strong>of</strong> NY Ave.<br />
Map 4.3<br />
Area 8<br />
Map 4.2<br />
Area 4<br />
Map 4.3<br />
Area 6<br />
Map 4.4<br />
Area 12<br />
Map 4.1<br />
Area 7<br />
Map 4.3<br />
Area 4
<strong>District</strong> <strong>of</strong> Columbia Industrial Areas Study DC Office <strong>of</strong> Planning<br />
Prepared by Phillips Preiss Shapiro Associates, Inc.<br />
Sub-Area Total<br />
Acres<br />
New York -<br />
Florida Ave<br />
New York –<br />
Ivy City<br />
PDR Opportunities PDR Constraints Suitable for<br />
Continued<br />
PDR Use?<br />
- 159 -<br />
If Yes,<br />
Private or<br />
Public Use?<br />
Recommendation Policy Map &<br />
Area Number<br />
NY Ave. No Mixed-use for strip along<br />
NY Ave., triangle west <strong>of</strong><br />
Bladensburg, and the two<br />
northwestern corners <strong>of</strong><br />
area<br />
196.73 Excellent transportation<br />
access<br />
Proximity to downtown –<br />
centrally located w/in<br />
<strong>District</strong><br />
Presently limited<br />
residential exposure<br />
Wholesale Market area<br />
could add density<br />
249.34 Excellent for municipal colocation<br />
/ strategic<br />
municipal use area<br />
Information and<br />
Communications also<br />
concentrated<br />
Area rumored to have<br />
fiber optic cable<br />
infrastructure<br />
Excellent area for<br />
warehousing/truck<br />
transport uses<br />
Scattered 11.19 About 1/3 <strong>of</strong> site is<br />
underused – prime for<br />
Significant real estate<br />
pressures for conversion<br />
to non-industrial<br />
Established residential<br />
communities to the west<br />
Limited available land for<br />
development - much land<br />
occupied by rail lines<br />
Internal circulation limited<br />
for large trucks<br />
Residential area in Ivy<br />
City targeted for Home<br />
Again Initiative<br />
Residential areas border<br />
the site on all sides<br />
Yes Private Preserve industrial<br />
zoning for much <strong>of</strong> area,<br />
and intensify use<br />
Preserve and intensify<br />
use <strong>of</strong> Wholesale Market<br />
Pay close attention to<br />
appropriate reuse <strong>of</strong><br />
historic buildings<br />
No Change to mixed-use for<br />
area around Eckington<br />
Place to accommodate<br />
new development<br />
Yes Private<br />
Preserve info/tech PDR<br />
uses<br />
Preserve Hecht Building<br />
– consider innovative<br />
reuse as information/<br />
technology hub if<br />
appropriate<br />
Public<br />
Pursue collocation and<br />
technical innovations to<br />
maximize DPW site<br />
Pursue consolidation <strong>of</strong><br />
municipal fleet<br />
maintenance functions at<br />
W. Virginia Ave<br />
Pursue municipal service<br />
zone on W. Virginia Ave<br />
and north <strong>of</strong> railroad lines<br />
Yes Public Preserve existing zoning<br />
and intensify use<br />
Map 4.4<br />
Areas 9,<br />
Area 10<br />
Map 4.1<br />
Area 6<br />
Map 4.4<br />
Area 7<br />
Map 4.1<br />
Area 5<br />
Map 4.2<br />
Area 2<br />
Map 4.3<br />
Area 2<br />
Area 3<br />
Map 4.3<br />
Area 1
<strong>District</strong> <strong>of</strong> Columbia Industrial Areas Study DC Office <strong>of</strong> Planning<br />
Prepared by Phillips Preiss Shapiro Associates, Inc.<br />
Sub-Area Total<br />
Acres<br />
Site 1 strategic location <strong>of</strong><br />
municipal uses<br />
Scattered<br />
Site 2<br />
Scattered<br />
Site 3<br />
Scattered<br />
Site 4<br />
Scattered<br />
Site 5<br />
Scattered<br />
Site 6<br />
Water Street,<br />
SE<br />
PDR Opportunities PDR Constraints Suitable for<br />
Continued<br />
PDR Use?<br />
10.48 Hub <strong>of</strong> community and<br />
social services<br />
18.81 Rehab potential <strong>of</strong> upper<br />
floors on 7 th St, NW<br />
Infill potential<br />
Concentration <strong>of</strong><br />
medical/research uses<br />
1.20 Shaw / “Little Ethiopia”<br />
revival<br />
Some residential rehabs<br />
underway<br />
2.81 Good location for<br />
neighborhood retail and<br />
commercial<br />
WMATA is seeking<br />
partner for<br />
redevelopment <strong>of</strong> bus<br />
garage site<br />
Little or no vacancy<br />
Residential and<br />
educational uses<br />
surround the site<br />
Georgia Avenue targeted<br />
for revitalization<br />
- 160 -<br />
If Yes,<br />
Private or<br />
Public Use?<br />
Recommendation Policy Map &<br />
Area Number<br />
No<br />
Encourage location <strong>of</strong><br />
light municipal uses on<br />
vacant/abandoned<br />
parcels<br />
Designate site for<br />
municipal services<br />
Rezone to mixed-use –<br />
existing users can<br />
remain, but land use<br />
change is appropriate<br />
Yes Private Continue reuses <strong>of</strong> older<br />
buildings<br />
Pursue opportunities in<br />
bio tech and medical<br />
research around hospital<br />
Map 4.4<br />
Area 3<br />
Map 4.1<br />
Area 3<br />
Primarily residential No Rezone for mixed-use Map 4.4<br />
Area 4<br />
Current use is unsightly<br />
and under-regulated<br />
12.86 Centrally located U.S. Capitol Power Plant<br />
is here – thus area will<br />
remain under federal<br />
control<br />
37.00 Good highway, rail, and<br />
water access<br />
Relatively inaccessible to<br />
the public – secure site<br />
Strategic location for<br />
municipal users<br />
Federally-owned land –<br />
not available for<br />
consideration<br />
AWI and waterfront open<br />
space plans<br />
No Consider mixed-use<br />
designation – encourage<br />
locally serving retail or<br />
other like opportunities<br />
Yes Public<br />
(federal)<br />
Maintain existing zoning<br />
and use.<br />
Encourage foresighted<br />
federal planning and<br />
collocation <strong>of</strong> federal<br />
government uses<br />
Yes Public This area may be<br />
suitable for opportunistic<br />
public-sector PDR use<br />
Map 4.4<br />
Area 14<br />
Map 4.1<br />
n/a
<strong>District</strong> <strong>of</strong> Columbia Industrial Areas Study DC Office <strong>of</strong> Planning<br />
Prepared by Phillips Preiss Shapiro Associates, Inc.<br />
6.4 SCOR<strong>IN</strong>G MATRIX AND CLASSIFICATION OF “PDR FITNESS”<br />
After being surveyed, each sub-area was scored to determine its overall fitness as an industrial area.<br />
Eleven scoring criteria were developed collaboratively by the Office <strong>of</strong> Planning and PPSA. A total <strong>of</strong><br />
55 points were possible (five points per criteria multiplied by 11 criteria). The criteria were:<br />
A. Predominant Adjacent Land Uses<br />
B. Interior Access/Circulation<br />
C. Existing Road Conditions<br />
D. Proximity to Highway<br />
E. Rail Freight Access<br />
F. Average Parcel Size<br />
G. Brownfield/Contamination<br />
H. Metro/Transit<br />
I. Existing Industrial User Concentration<br />
J. General Area Condition<br />
K. Building Stock<br />
Working from the perspective <strong>of</strong> a PDR business, a score <strong>of</strong> five is highest and one is lowest. For<br />
example: For Criteria A, since residential and industrial land uses are generally incompatible, if<br />
residential areas are the prevailing adjacent land use, the resulting score is one because it would be<br />
difficult to locate or expand a PDR business in this area.<br />
Descriptions <strong>of</strong> scoring criteria and a matrix detailing the scores for each sub-area can be found in the<br />
Appendix.<br />
Taken together, the existing conditions discussion and total sub-area score inform our statements <strong>of</strong><br />
key findings that appear at the end <strong>of</strong> each sub-area analysis (section 6.2, above). For example, is the<br />
area a high-performing industrial zone or is it an island in the middle <strong>of</strong> residential areas? Is it a<br />
strategically important municipal services area with good highway and rail access? Is it a struggling<br />
area with many vacancies or is it thriving?<br />
The scoring criteria and scores by sub area are listed below.<br />
- 161 -
<strong>District</strong> <strong>of</strong> Columbia Industrial Areas Study DC Office <strong>of</strong> Planning<br />
Prepared by Phillips Preiss Shapiro Associates, Inc.<br />
CATEGORY SCORE<br />
A. Predominant Adjacent Land Uses<br />
Residential/Schools 1<br />
Parks/Open Space/Waterfront and/or MIXED use / retail 2<br />
Office/Commercial 3<br />
Highway/railroad/underutilized land 4<br />
Industrial/Heavy Uses 5<br />
B. Interior Access/Circulation<br />
Inadequate Space for Truck Access/Loading/Turning 1<br />
Inadequate Space for Truck Loading/Turning 2<br />
Inadequate Space for Truck Turning 3<br />
Adequate Space for Truck Access/Loading/Turning 4<br />
Excellent Configuration for Truck Access/Loading/Turning 5<br />
C. Existing Road Conditions<br />
Undeveloped or Under-developed Roadways 1<br />
Heavily-Worn Roadway; Numerous Road Defects; Undetermined Load Capacity 2<br />
Moderately-Worn Roadway; Few Road Defects; Moderate Load Capacity 3<br />
Good Road Conditions with No Road Defects; Moderate-Heavy Load Capacity 4<br />
Industrial-Grade Road with Smooth Road Conditions; Heavy Load Capacity 5<br />
D. Proximity to Highway/Major Thoroughfare<br />
> 1 mile through several blocks <strong>of</strong> residential 1<br />
> 1 mile through few residential blocks 2<br />
> 1mile (clean access) 3<br />
< 1 mile through at least one residential block 4<br />
< 1 mile (clean access) 5<br />
E. Rail Access<br />
No Rail Access 1<br />
Proximate to Abandoned Rail, No Existing Spur 2<br />
Proximate to Active Rail, No Existing Spur 3<br />
Proximate to Active Rail, Existing Rail Spur 4<br />
Active Rail Spur 5<br />
F. Average Site Size<br />
0.5 acre or less 1<br />
0.6 - 1 acre 2<br />
1.1 - 3 acres 3<br />
3.1 -5 acres 4<br />
5.1 acres or more 5<br />
G. Brownfields<br />
No real or perceived threat <strong>of</strong> contamination 1<br />
Perceived threat <strong>of</strong> contamination 2<br />
Heavy Use - Potential for Contamination 3<br />
- 162 -
<strong>District</strong> <strong>of</strong> Columbia Industrial Areas Study DC Office <strong>of</strong> Planning<br />
Prepared by Phillips Preiss Shapiro Associates, Inc.<br />
High Potential for or Real Contamination 4<br />
Confirmed Contamination - Brownfield Site 5<br />
H. Metro/Transit<br />
Metro Rail within 1/4 Mile 1<br />
Metro Bus within 1/4 Mile 2<br />
Metro and/or Park/Ride within 1 Mile 3<br />
Existing Bus Route with Limited/No Stops 4<br />
No existing Metro presence 5<br />
I. Existing Industrial User Concentrations<br />
None. 1<br />
Predominantly Non-Industrial (Social Services, Non Pr<strong>of</strong>its, Churches, etc.) 2<br />
1-3 identified user classifications 3<br />
3-5 identified user classifications 4<br />
> 5 identified user classifications 5<br />
J. General Area Condition<br />
Significant Disrepair, Numerous Dilapidated Buildings, Perception <strong>of</strong> Abandonment 1<br />
Some heavy wear on buildings, some vacancies 2<br />
Moderate wear and tear; most buildings in need <strong>of</strong> reinvestment 3<br />
Indications <strong>of</strong> new investment/renovation; few vacancies, if any 4<br />
Well-Maintained Facilities with Active Businesses/Activities; Fully-Occupied 5<br />
K. Building Stock<br />
Historic or historically-significant buildings 1<br />
Older, multi-story industrial and/or flex buildings 2<br />
Multi-story industrial/flex buildings 3<br />
Mixture <strong>of</strong> two- and one-story industrial/warehouse buildings 4<br />
Modern industrial buildings with loading bays and marketable configuration 5<br />
- 163 -
<strong>District</strong> <strong>of</strong> Columbia Industrial Areas Study DC Office <strong>of</strong> Planning<br />
Prepared by Phillips Preiss Shapiro Associates, Inc.<br />
- 164 -<br />
CRITERIA<br />
SUB AREA NAME A B C D E F G H I J K TOTAL Rank<br />
Blue Plains 5 4 4 5 2 5 4 5 3 5 4 46.0 1<br />
NY Ave./Bladensburg 5 4 4 4 4 2 4 3 5 4 4 43.0 2<br />
NY Ave./Ivy City 5 4 4 5 4 2 4 3 5 3 3 42.0 4<br />
Benning Road 5 4 3 5 4 5 4 2 3 3 3 41.0 5<br />
Fort Lincoln Urban Renewal 2 5 4 4 3 5 1 4 3 5 4 40.0 6<br />
Scattered Site 6 4 4 4 4 4 5 4 2 3 3 3 40.0 6<br />
DC Village 5 4 3 5 2 5 4 2 3 3 3 39.0 8<br />
CSX 1 5 4 3 4 4 2 3 1 5 3 4 38.0 9<br />
CSX 1 - Lamond Riggs 5 4 3 1 4 1 3 2 5 5 5 38.0 9<br />
NY Ave./Florida 4 3 3 5 4 2 4 1 5 4 3 38.0 9<br />
CSX 1 - Fort Totten 5 4 3 1 4 3 3 1 4 4 4 36.0 12<br />
Water Street, SE 4 4 3 5 4 3 3 4 2 1 2 35.0 13<br />
CSX 1 - NY/NOMA 4 4 3 5 4 2 3 1 3 3 3 35.0 13<br />
11th Street, SE 4 4 5 5 3 1 2 5 3 1 2 35.0 13<br />
Anacostia Poplar Point 4 4 3 5 3 1 3 1 3 2 2 31.0 16<br />
CSX 1 - Brookland 3 3 3 1 4 1 3 1 4 3 4 30.0 17<br />
Bladensburg/Fort Lincoln 1 3 4 2 4 2 2 2 3 3 2 28.0 18<br />
Scattered Site 1 2 4 4 1 1 4 2 2 3 2 2 27.0 19<br />
Scattered Site 5 3 2 3 1 1 4 2 3 3 3 2 27.0 19
<strong>District</strong> <strong>of</strong> Columbia Industrial Areas Study DC Office <strong>of</strong> Planning<br />
Prepared by Phillips Preiss Shapiro Associates, Inc.<br />
CSX 2 - Anacostia Fairlawn 2 2 3 4 3 1 2 2 3 2 2 26.0 21<br />
CSX 2 - Kennilworth 2 3 3 4 3 1 2 1 3 2 2 26.0 21<br />
Scattered Site 2 1 3 3 1 1 1 2 2 4 4 2 24.0 23<br />
Scattered Site 3 3 2 2 1 1 2 2 2 2 4 3 24.0 23<br />
Scattered Site 4 3 2 2 1 1 1 1 1 2 2 1 17.0 25<br />
Buzzard Point 43 - - - - - - - - - - - - -<br />
AVERAGE SCORE 3.6 3.5 3.3 3.4 3.0 2.6 2.8 2.2 3.5 3.1 2.9 34.0<br />
43 Buzzard Point was also included as a study area, but, since new industrial uses are no longer permitted in this area, it has not been included<br />
in the scoring matrix.<br />
- 165 -
<strong>District</strong> <strong>of</strong> Columbia Industrial Areas Study DC Office <strong>of</strong> Planning<br />
Prepared by Phillips Preiss Shapiro Associates, Inc.<br />
6.5 <strong><strong>IN</strong>DUSTRIAL</strong> USERS SURVEY<br />
6.5.1 OVERVIEW<br />
A survey <strong>of</strong> industrial tenants was undertaken in order to obtain data and insights from existing PDR<br />
users. The survey instrument was intended to elicit the following information:<br />
The characteristics <strong>of</strong> responding businesses in terms <strong>of</strong> industry sector and size (both in terms<br />
<strong>of</strong> sales and employees)<br />
The advantages and disadvantages <strong>of</strong> a DC location<br />
The importance <strong>of</strong> a DC location for respondent’s businesses<br />
Future business plans, including expansion, contraction, moving out <strong>of</strong> the <strong>District</strong>, etc.<br />
A survey was mailed to every address located within an industrial zone district. Several hundred <strong>of</strong><br />
these were returned, and <strong>of</strong> these, 182 were in some sort <strong>of</strong> usable condition. Many <strong>of</strong> these surveys,<br />
however, were returned by non-PDR businesses: a total <strong>of</strong> 30 were received from residential<br />
properties, while another 22 were received from retail businesses. Therefore, a maximum <strong>of</strong> 130<br />
surveys were actually received from PDR businesses. A breakdown <strong>of</strong> respondents by business type is<br />
shown in Table 5-1.<br />
Table 6.1: Survey Respondents by Business Sector<br />
Respondents<br />
Type <strong>of</strong><br />
Business Number Percent<br />
Warehousing 44 29.1%<br />
Other 31 20.5%<br />
Residential 30 16.6%<br />
Business Offices 23 15.2%<br />
Vehicle Repair 22 14.6%<br />
Retail 22 14.6%<br />
Manufacturing 16 10.6%<br />
Construction 16 10.6%<br />
Storage<br />
Equipment<br />
11 7.3%<br />
Repair 7 4.6%<br />
Health 6 4.0%<br />
Printing 3 2.0%<br />
Research 0 0.0%<br />
Utilities 0 0.0%<br />
- 166 -
<strong>District</strong> <strong>of</strong> Columbia Industrial Areas Study DC Office <strong>of</strong> Planning<br />
Prepared by Phillips Preiss Shapiro Associates, Inc.<br />
The majority <strong>of</strong> businesses surveyed are independent. A total <strong>of</strong> 88 percent are headquarters locations,<br />
with only 12 percent identifying themselves as subsidiaries. These businesses are also generally small.<br />
Over half (54 percent) have fewer than 10 employees, and 55 percent have annual gross sales <strong>of</strong> $1<br />
million or less. Nor have the responding businesses seen significant growth during the recent boom—<br />
the distribution <strong>of</strong> employment was virtually the same three years ago as it is today. Further, 40 percent<br />
<strong>of</strong> respondents expect their pr<strong>of</strong>itability to decline in the future, compared with 36 percent who expect it<br />
to increase (25 percent did not answer the question).<br />
60%<br />
50%<br />
40%<br />
30%<br />
20%<br />
10%<br />
0%<br />
54%<br />
21%<br />
Chart 6.1: Number <strong>of</strong> Employees<br />
Number <strong>of</strong> Employees<br />
- 167 -<br />
55%<br />
22%<br />
17% 17%<br />
5%<br />
2%<br />
Number <strong>of</strong> Employees Today Number <strong>of</strong> Employees Three Years Ago<br />
Under 10 10-20 20-50 50-100 Over 100<br />
2%<br />
4%
<strong>District</strong> <strong>of</strong> Columbia Industrial Areas Study DC Office <strong>of</strong> Planning<br />
Prepared by Phillips Preiss Shapiro Associates, Inc.<br />
45%<br />
40%<br />
35%<br />
30%<br />
25%<br />
20%<br />
15%<br />
10%<br />
5%<br />
0%<br />
36%<br />
Chart 6.2: Pr<strong>of</strong>itability<br />
Estimated Future Pr<strong>of</strong>itability<br />
40%<br />
1<br />
- 168 -<br />
25%<br />
More Less No Response<br />
The responding businesses serve a wide variety <strong>of</strong> customers. Table 5-2 below tabulates the<br />
percentage <strong>of</strong> respondents answering that they serve the following sectors. The table shows that while<br />
the “other” category was most <strong>of</strong>ten checked by respondents, responding businesses primarily serve<br />
retail customers, followed by government and the building trades. However, if restaurants and hotels<br />
are consolidated together as hospitality uses, then they would form the largest sector after “other,” with<br />
nearly 30 percent <strong>of</strong> respondents.<br />
6.5.2 EMPLOYEE CHARACTERISTICS<br />
A significant number <strong>of</strong> people working in DC’s industrial zones come from outside the <strong>District</strong>. Around<br />
40 percent <strong>of</strong> responding businesses report that 25 percent or fewer <strong>of</strong> their employees come from<br />
within the <strong>District</strong>. Under the most optimistic set <strong>of</strong> assumption, no more than 52 percent <strong>of</strong><br />
respondent’s employees could be DC residents—the true percentage is likely closer to 40 percent. This<br />
means that the proportion <strong>of</strong> PDR jobs held by DC residents is perhaps only somewhat larger than the<br />
proportion for all jobs in the <strong>District</strong>.
<strong>District</strong> <strong>of</strong> Columbia Industrial Areas Study DC Office <strong>of</strong> Planning<br />
Prepared by Phillips Preiss Shapiro Associates, Inc.<br />
Table 6.2: Types <strong>of</strong> Customers Served<br />
Type <strong>of</strong> Customer Percent<br />
Other 31.1%<br />
General Public/Retail 27.2%<br />
Government 22.5%<br />
Building/Construction 21.9%<br />
Restaurant/Entertainment 17.2%<br />
Hotels 11.9%<br />
Transportation 8.6%<br />
Industrial End User 7.9%<br />
Industrial Manufacturer 7.3%<br />
Medical 6.0%<br />
Legal/Pr<strong>of</strong>essional 3.3%<br />
High Technology 2.6%<br />
Many <strong>of</strong> DC’s industrial areas lack good transit connections, and with a significant share <strong>of</strong> workers<br />
coming from outside <strong>of</strong> the <strong>District</strong>, it is not surprising to find that a substantial share <strong>of</strong> the workforce in<br />
the industrial zones drives to work. Nearly half <strong>of</strong> all respondents (46 percent) report that 75 percent or<br />
more <strong>of</strong> their employees drive to work. Yet, the number taking transit is still significant: 37 percent <strong>of</strong><br />
respondents report that less than half their workforce drives to work. Taking the midpoints from each<br />
category would indicate that no more than 73 percent drives, with the true value likely being closer to<br />
60 percent.<br />
6.5.3 SPACE NEEDS<br />
Most responding businesses occupy modest amounts <strong>of</strong> space. Users with spaces under 5,000 square<br />
feet in size are most common, with most occupying spaces <strong>of</strong> 50,000 square feet or smaller. In<br />
general, businesses would like to be in larger spaces, but not radically larger than the spaces they<br />
already occupy. This distribution between existing space and desired space shifts upwards in most<br />
categories, but relatively review users want to occupy spaces larger than 100,000 square feet.<br />
Respondents were asked how their optimal space configuration would be used. Since industrial<br />
buildings are typically able to accommodate multiple uses (storage, <strong>of</strong>fices, production), respondents<br />
were asked to estimate the percentage <strong>of</strong> floor area devoted to each use. The resulting answers give<br />
an estimate <strong>of</strong> the types <strong>of</strong> space most in demand.<br />
As a first cut <strong>of</strong> the analysis, the average proportion <strong>of</strong> respondent’s buildings devoted to various types<br />
<strong>of</strong> use was computed. The tabulations are only for respondents who answered the question, and the<br />
- 169 -
<strong>District</strong> <strong>of</strong> Columbia Industrial Areas Study DC Office <strong>of</strong> Planning<br />
Prepared by Phillips Preiss Shapiro Associates, Inc.<br />
percentages do not total to 100 percent due to the failure by some respondents to fully answer the<br />
question, or to enter percentages that total to 100 percent. The results are shown in Table 5-3, and<br />
indicate that the average PDR user would prefer to utilize 23 percent <strong>of</strong> their building’s floor area for<br />
industrial use, 37 percent for warehousing, and 19 percent for <strong>of</strong>fices.<br />
Type <strong>of</strong> Space<br />
Table 6.3: Uses <strong>of</strong> Space<br />
Proportion <strong>of</strong><br />
space in<br />
respondent’s<br />
buildings<br />
- 170 -<br />
Estimated<br />
proportion <strong>of</strong><br />
space<br />
adjusted by<br />
building size<br />
Industrial 22.5% 24.0%<br />
Flex/R&D 2.0% 2.2%<br />
Warehouse 37.4% 43.7%<br />
Showroom 4.1% 1.0%<br />
Office 19.1% 14.7%<br />
Manufacturing 8.2% 14.4%<br />
Totals 93.4% 100.0%<br />
The above analysis does not account for the fact that some respondents have large buildings, while<br />
others have small buildings. All but three respondents to this question also answered a question asking<br />
about their building size. Using the midpoints <strong>of</strong> these categories, an estimate <strong>of</strong> the percentage <strong>of</strong><br />
space across the respondent pool used for various uses was developed. The results are shown in the<br />
third column <strong>of</strong> Table 5-3. These results show that warehousing is the predominant use <strong>of</strong> space,<br />
followed by industrial use, with <strong>of</strong>fice and manufacturing tied at about 14 percent apiece.<br />
Respondents generally have modest parking needs. Forty percent need fewer than 10 parking spaces,<br />
while another 33 percent need 50 or fewer spaces. A small percentage, however, have significant<br />
parking needs, as shown in Chart 5-3.<br />
One-story buildings are the preferred building typology for 50 percent <strong>of</strong> respondents. Another 37<br />
percent desire a two-story buildings. Only a few would prefer a building or 3 or more stories.<br />
6.5.4 IMPORTANCE AND ADVANTAGE OF A DC LOCATION<br />
DC’s PDR businesses are <strong>of</strong>ten hemmed in at their current location. A majority—55 percent—are<br />
unable to assemble land for expansion, and only 10 percent were able to affirm that they could<br />
assemble additional land. However, the responding businesses appear to believe that their current<br />
location provides significant advantages. For example, nearly three-quarters (74 percent) agreed that<br />
their access and proximity to DC customers is advantageous, while only 4 percent disagreed with this
<strong>District</strong> <strong>of</strong> Columbia Industrial Areas Study DC Office <strong>of</strong> Planning<br />
Prepared by Phillips Preiss Shapiro Associates, Inc.<br />
statement. Another 66 percent agreed that transportation and infrastructure at their location was good,<br />
while only 8 percent disagreed. Further, in spite <strong>of</strong> the problems assembling property, half <strong>of</strong><br />
respondents would consider expanding their operations in DC. Perhaps most tellingly, a clear majority<br />
<strong>of</strong> 86 percent still want to be operating in the <strong>District</strong> in five years from now. Unfortunately, perhaps due<br />
to space constraints, 36 percent to not plan to expand in the next two years, and another 27 percent<br />
are unsure.<br />
60%<br />
50%<br />
40%<br />
30%<br />
20%<br />
10%<br />
0%<br />
6%<br />
4%<br />
35%<br />
55%<br />
Can Assemble Land for<br />
Expansion<br />
31%<br />
43%<br />
22%<br />
Chart 6.3: Importance <strong>of</strong> Current Location<br />
4%<br />
Importance <strong>of</strong> Current Location<br />
21%<br />
45%<br />
25%<br />
8%<br />
15%<br />
- 171 -<br />
36%<br />
35%<br />
15%<br />
11%<br />
27%<br />
26%<br />
36%<br />
36%<br />
50%<br />
8%<br />
7%<br />
0% 0% 0% 0% 0% 0%<br />
Access/Proximity to DC<br />
Customers is Advantageous<br />
Transport/Infrastructure is<br />
Good<br />
Consider Expanding in DC Expanding in Next 2 Years Want to be in DC in 5 Years<br />
Strongly Agree Agree Neutral Disagree Strongly Disagree<br />
As might be expected, the businesses in DC’s industrial districts tend to do a significant amount <strong>of</strong><br />
business with end users and customers located within the <strong>District</strong>, but a substantial share <strong>of</strong> their trade<br />
goes outside <strong>of</strong> the district as well. Sixty-four percent achieve half or more <strong>of</strong> their sales from DC<br />
customers, and only for 14 percent <strong>of</strong> respondents does this value fall below 25 percent. These figures<br />
suggest that somewhere between 50 and 60 percent <strong>of</strong> sales are to DC-based customers. The figures<br />
differ somewhat for deliveries, indicating that deliveries within the <strong>District</strong> are larger, on average, than<br />
those destined outside <strong>of</strong> the <strong>District</strong>.
<strong>District</strong> <strong>of</strong> Columbia Industrial Areas Study DC Office <strong>of</strong> Planning<br />
Prepared by Phillips Preiss Shapiro Associates, Inc.<br />
40%<br />
35%<br />
30%<br />
25%<br />
20%<br />
15%<br />
10%<br />
5%<br />
0%<br />
14%<br />
23%<br />
28%<br />
Chart 6.4: Sales Composition<br />
36%<br />
Sales Composition<br />
Percentage <strong>of</strong> Sales to DC Customers Percentage <strong>of</strong> Deliveries to DC Customers<br />
- 172 -<br />
23%<br />
19%<br />
Under 25% 25%-50% 50%-75% Over 75%<br />
Responding businesses also agree that their location in DC is an advantage from the standpoint <strong>of</strong><br />
their customers. A total <strong>of</strong> 59 percent agreed with this statement, and only 10 percent disagreed.<br />
Respondents were unsure, however, whether their business was increasingly slipping across the<br />
<strong>District</strong> border to competitors in Maryland and Virginia. Over half (51 percent) had no opinion on this<br />
topic, while 21 percent felt that it was not happening, and 28 percent were either sure or very sure that<br />
it was happening. A larger proportion—39 percent—agreed that their customers could easily switch to<br />
suppliers outside <strong>of</strong> the <strong>District</strong>, while a quarter disagreed and 35 percent were neutral on the topic.<br />
With regards to moving plans, 13 percent have moved some portion <strong>of</strong> their business outside <strong>of</strong> the<br />
<strong>District</strong> within the past decade, while a quarter (25 percent) have considered such a move. When<br />
asked why, respondents indicated that the three most important reasons for considering moving were<br />
taxes, land costs, and the inability to satisfy space needs within the <strong>District</strong>. Only 4 percent would be<br />
closer to customers, and only 7 percent would have an easier time finding employees.<br />
28%<br />
31%
<strong>District</strong> <strong>of</strong> Columbia Industrial Areas Study DC Office <strong>of</strong> Planning<br />
Prepared by Phillips Preiss Shapiro Associates, Inc.<br />
25%<br />
20%<br />
15%<br />
10%<br />
5%<br />
0%<br />
13%<br />
Needed More<br />
Space<br />
4%<br />
Closer to<br />
Customers<br />
Chart 6.5: Reasons for Moving<br />
Reasons for Moving/Thinking <strong>of</strong> Moving from DC<br />
1%<br />
Closer to<br />
Suppliers<br />
19%<br />
Lower Cost <strong>of</strong><br />
Land<br />
7%<br />
Easier to Find<br />
Employees<br />
- 173 -<br />
20%<br />
5%<br />
5%<br />
Taxes Business Climate Other<br />
As a general rule, most businesses are reluctant to undertake major changes (such as a move) without<br />
a strong impetus. For those businesses not considering a move from the <strong>District</strong>, the most common<br />
reason for staying put was that the existing space was working well for their business. Half the<br />
respondents who plan on staying indicated this as a reason. The second most common reason, for 38<br />
percent <strong>of</strong> respondents, was to be closer to customers. Another 17 percent indicated that it was easier<br />
for their workforce to get to work than would be the case at location outside <strong>of</strong> DC.
<strong>District</strong> <strong>of</strong> Columbia Industrial Areas Study DC Office <strong>of</strong> Planning<br />
Prepared by Phillips Preiss Shapiro Associates, Inc.<br />
60%<br />
50%<br />
40%<br />
30%<br />
20%<br />
10%<br />
0%<br />
50%<br />
Current Space Well-<br />
Suited to Business<br />
38%<br />
6.5.5 <strong>IN</strong>TERIM F<strong>IN</strong>D<strong>IN</strong>GS<br />
Chart 6.6: Reasons for Staying<br />
Reasons for Staying in DC<br />
10%<br />
Closer to Customers Closer to Suppliers No Space Available<br />
Outside <strong>of</strong> DC<br />
- 174 -<br />
9%<br />
17%<br />
Easier for Employees to<br />
Get to Work<br />
The land use surveys conducted as part <strong>of</strong> this study revealed a large diversity within DC’s industrial<br />
zones, but with the following patterns standing out:<br />
Land use in many areas is dominated by a few giant government and institutional users, such<br />
as DC government, the US Postal Service, and WMATA.<br />
Wholesalers and distributors dominate the Florida Avenue Wholesale Market, and are scattered<br />
in small and mid-sized buildings elsewhere.<br />
Other common uses are building/HVAC contractors and automobile repair establishments.<br />
There is already a significant amount <strong>of</strong> non-PDR activity in the industrial zones, including <strong>of</strong>fice<br />
uses, retail uses, and residences.<br />
Areas that are defined industrial districts with configurable space in good condition tend to<br />
exhibit high occupancy rates and the greatest variety <strong>of</strong> businesses.<br />
Comparing these conditions with the responses generated by the survey show some correlations.<br />
Many <strong>of</strong> the respondents are not PDR businesses. Of those that are, wholesaling was the most<br />
common business category, followed by manufacturing, then construction/contracting. The survey<br />
13%<br />
Other
<strong>District</strong> <strong>of</strong> Columbia Industrial Areas Study DC Office <strong>of</strong> Planning<br />
Prepared by Phillips Preiss Shapiro Associates, Inc.<br />
confirms that while the large users may dominate land use, most PDR businesses in the district are <strong>of</strong><br />
modest size. Their businesses appear stable but many are not partaking <strong>of</strong> the local economic boom.<br />
They either have no expansion plans, or only modest additional space needs. They lack the dynamism<br />
that characterizes the <strong>District</strong>’s rapidly expanding <strong>of</strong>fice sector, for example.<br />
A primary purpose <strong>of</strong> the survey was to assess the importance <strong>of</strong> a DC location for the businesses<br />
occupying the <strong>District</strong>’s industrial zones. Future land use policy might seek to preserve the zones, or,<br />
through rezonings, facilitate the loss <strong>of</strong> industrial land. If PDR businesses can easily relocate outside <strong>of</strong><br />
the district and continue to serve their customers, then (1) their displacement is less <strong>of</strong> a cause for<br />
concern, and (2) efforts to keep them in the district would have to go beyond maintaining existing<br />
zoning protections. If, on the other hand, these businesses truly need to be in the district, then their<br />
displacement is a more serious matter.<br />
The survey findings indicate, perhaps unsurprisingly, that a majority <strong>of</strong> the respondents do derive extra<br />
value from being in the <strong>District</strong>. Proximity to their customers is the primary benefit, and is apparently<br />
sufficient to outweigh identified detriments including taxes, high land costs, and insufficient space with<br />
few or no expansion options. These findings suggest that for a significant share <strong>of</strong> existing tenants, a<br />
move will only be contemplated when their existing situation becomes untenable.<br />
Even still, for every DC tenant that does most <strong>of</strong> their business within the <strong>District</strong>, there are others who<br />
serve a more regional clientele. These businesses may be the first to leave if better opportunities are<br />
available elsewhere. Inertia is a powerful force behind many business decisions. It cannot be<br />
discounted that many businesses may not be planning to move simply because it is easier not to.<br />
In sum, the survey backs up some initial hypotheses informing this study, namely that regional<br />
congestion provides value to location closer to the end users <strong>of</strong> goods and services provided. Further<br />
research, particularly into the industrial property market, will hopefully shed additional light on how this<br />
value translates into lease rates and land costs, and the extent to which it influences the demand for<br />
industrially-zoned land and buildings in the <strong>District</strong>.<br />
- 175 -
<strong>District</strong> <strong>of</strong> Columbia Industrial Areas Study DC Office <strong>of</strong> Planning<br />
Prepared by Phillips Preiss Shapiro Associates, Inc.<br />
6.6 REGIONAL <strong><strong>IN</strong>DUSTRIAL</strong> SPACE<br />
Chart 6.7: Regional Market Capture <strong>of</strong> Industrial Space<br />
Jurisdiction State RBA Occupied SF Vacancy Vacancy Rate Avg. Lease* Closeby?<br />
DC 11,079,663 10,442,738 636,925 5.7% DC Private Sector Need<br />
MD 74,745,419 68,060,137 6,685,282 8.9% $7 Less Available DC<br />
VA 47,773,984 45,025,527 2,748,457 5.8% $9 Avail nearby in MD<br />
Maryland Detail Avail nearby in VA<br />
Beltsville MD 6,032,320 5,391,083 641,237 10.6% Y Total Suburban Avail<br />
Bowie MD 2,844,813 2,453,837 390,976 13.7% DC Capture MD/VA<br />
Branch Ave MD 2,224,491 2,101,377 123,114 5.5% Y<br />
Brandywine MD 1,021,479 771,169 250,310 24.5%<br />
Capitol Heights MD 3,708,454 3,224,916 483,538 13.0% Y<br />
Cheverly MD 5,167,171 4,855,194 311,977 6.0% Y Remainder<br />
Montgomery Unincorporated MD 14,300 14,300 0 0.0% Y Acres<br />
Frederick County MD 7,071,320 6,425,456 645,864 9.1% DC Pub Need (acres)<br />
Gaithersburg MD 3,314,190 3,221,138 93,052 2.8% DC Public Capture<br />
Germantown MD 228,882 159,882 69,000 30.1%<br />
Greenbelt MD 107,176 65,176 42,000 39.2% Y<br />
I-270 Corridor MD 76,533 70,233 6,300 8.2%<br />
Kensington MD 213,498 202,498 11,000 5.2%<br />
Southern PG County MD 12,372,584 10,959,536 1,413,048 11.4%<br />
Lanham MD 752,631 752,631 0 0.0% Y<br />
Laurel MD 2,050,615 2,050,615 0 0.0% Y<br />
Bethesda MD 844,007 651,826 192,181 22.8% $11 Y<br />
North Rockville MD 3,178,792 3,051,678 127,114 4.0% $12<br />
Oxon Hill MD 297,572 297,572 0 0.0% Y<br />
Penn Ave Corr MD 2,264,632 2,137,732 126,900 5.6% $7 Y<br />
Rockville MD 2,381,834 2,284,809 97,025 4.1% $12<br />
Route 29 MD 337,963 254,711 83,252 24.6% $12 Y<br />
Silver Spring MD 754,502 720,602 33,900 4.5% $7 Y<br />
College Park MD 1,168,553 1,136,053 32,500 2.8% $10 Y<br />
Upper Marlboro MD 445,542 358,112 87,430 19.6% Y<br />
Montgomery Unincorporated 2 MD 3,194 3,194 0 0.0% Y<br />
Washington County MD 15,868,371 14,444,797 1,423,574 9.0% $4<br />
Virginia Detail<br />
Arlington VA 74,219 74,219 0 0.0% Y<br />
Fairfax/Chantilly VA 299,090 285,948 13,142 4.4% $14 Y<br />
Crystal City VA 1,070,353 965,224 105,129 9.8% $9 Y<br />
Eisenhower Ave VA 897,537 861,037 36,500 4.1% $9 Y<br />
Falls Church VA 388,551 351,366 37,185 9.6% $14<br />
Fauquier County VA 332,905 197,942 134,963 40.5% $13<br />
Herndon VA 348,255 316,197 32,058 9.2% $9<br />
I-395 Corridor VA 3,341,202 3,113,010 228,192 6.8% $9 Y<br />
Leesburg VA 309,680 301,014 8,666 2.8% $7<br />
Manassas VA 3,058,558 2,933,955 124,603 4.1% $9<br />
Merrifield VA 1,640,509 1,572,649 67,860 4.1% $13<br />
Newington VA 6,400,033 6,079,251 320,782 5.0% $9<br />
Oakton/Vienna VA 267,102 225,650 41,452 15.5% $15<br />
Old Town Alexandria VA 1,196,119 1,103,488 92,631 7.7% $12 Y<br />
Loudoun County VA 316,077 313,458 2,619 0.8% $8<br />
Reston VA 164,450 162,850 1,600 1.0% $13 Y<br />
Dulles North VA 7,772,932 6,900,253 872,679 11.2% $9<br />
Dulles South VA 4,294,334 4,059,224 235,110 5.5% $8<br />
Route 29/I-66 Corr VA 5,120,406 4,995,862 124,544 2.4% $7<br />
Springfield VA 7,124,376 6,919,521 204,855 2.9% $9 Y<br />
Tyson's Corner VA 771,706 718,418 53,288 6.9% $14 Y<br />
Woodbridge VA 2,587,591 2,574,991 12,600 0.5% $10<br />
* Triple Net Lease (NNN)<br />
Source: DC Office <strong>of</strong> Planning, 2006<br />
- 176 -