INDUSTRIAL LAND IN A POST-INDUSTRIAL CITY District of ...
INDUSTRIAL LAND IN A POST-INDUSTRIAL CITY District of ...
INDUSTRIAL LAND IN A POST-INDUSTRIAL CITY District of ...

Create successful ePaper yourself
Turn your PDF publications into a flip-book with our unique Google optimized e-Paper software.
<strong>District</strong> <strong>of</strong> Columbia Industrial Areas Study DC Office <strong>of</strong> Planning<br />
Prepared by Phillips Preiss Shapiro Associates, Inc.<br />
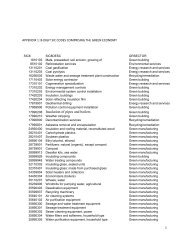
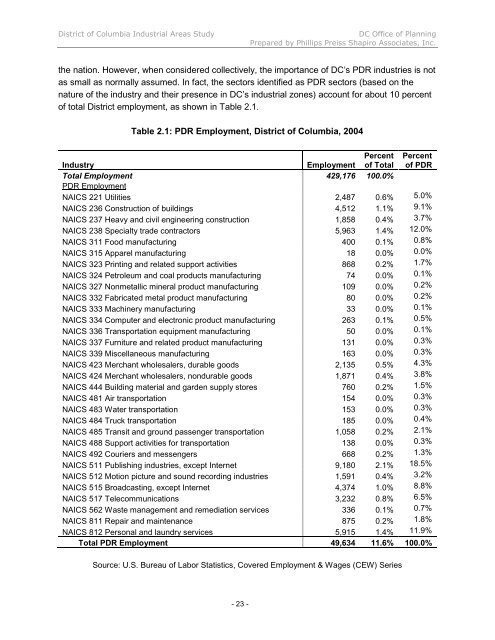
the nation. However, when considered collectively, the importance <strong>of</strong> DC’s PDR industries is not<br />
as small as normally assumed. In fact, the sectors identified as PDR sectors (based on the<br />
nature <strong>of</strong> the industry and their presence in DC’s industrial zones) account for about 10 percent<br />
<strong>of</strong> total <strong>District</strong> employment, as shown in Table 2.1.<br />
Table 2.1: PDR Employment, <strong>District</strong> <strong>of</strong> Columbia, 2004<br />
Percent Percent<br />
Industry Employment <strong>of</strong> Total <strong>of</strong> PDR<br />
Total Employment<br />
PDR Employment<br />
429,176 100.0%<br />
NAICS 221 Utilities 2,487 0.6% 5.0%<br />
NAICS 236 Construction <strong>of</strong> buildings 4,512 1.1% 9.1%<br />
NAICS 237 Heavy and civil engineering construction 1,858 0.4% 3.7%<br />
NAICS 238 Specialty trade contractors 5,963 1.4% 12.0%<br />
NAICS 311 Food manufacturing 400 0.1% 0.8%<br />
NAICS 315 Apparel manufacturing 18 0.0% 0.0%<br />
NAICS 323 Printing and related support activities 868 0.2% 1.7%<br />
NAICS 324 Petroleum and coal products manufacturing 74 0.0% 0.1%<br />
NAICS 327 Nonmetallic mineral product manufacturing 109 0.0% 0.2%<br />
NAICS 332 Fabricated metal product manufacturing 80 0.0% 0.2%<br />
NAICS 333 Machinery manufacturing 33 0.0% 0.1%<br />
NAICS 334 Computer and electronic product manufacturing 263 0.1% 0.5%<br />
NAICS 336 Transportation equipment manufacturing 50 0.0% 0.1%<br />
NAICS 337 Furniture and related product manufacturing 131 0.0% 0.3%<br />
NAICS 339 Miscellaneous manufacturing 163 0.0% 0.3%<br />
NAICS 423 Merchant wholesalers, durable goods 2,135 0.5% 4.3%<br />
NAICS 424 Merchant wholesalers, nondurable goods 1,871 0.4% 3.8%<br />
NAICS 444 Building material and garden supply stores 760 0.2% 1.5%<br />
NAICS 481 Air transportation 154 0.0% 0.3%<br />
NAICS 483 Water transportation 153 0.0% 0.3%<br />
NAICS 484 Truck transportation 185 0.0% 0.4%<br />
NAICS 485 Transit and ground passenger transportation 1,058 0.2% 2.1%<br />
NAICS 488 Support activities for transportation 138 0.0% 0.3%<br />
NAICS 492 Couriers and messengers 668 0.2% 1.3%<br />
NAICS 511 Publishing industries, except Internet 9,180 2.1% 18.5%<br />
NAICS 512 Motion picture and sound recording industries 1,591 0.4% 3.2%<br />
NAICS 515 Broadcasting, except Internet 4,374 1.0% 8.8%<br />
NAICS 517 Telecommunications 3,232 0.8% 6.5%<br />
NAICS 562 Waste management and remediation services 336 0.1% 0.7%<br />
NAICS 811 Repair and maintenance 875 0.2% 1.8%<br />
NAICS 812 Personal and laundry services 5,915 1.4% 11.9%<br />
Total PDR Employment 49,634 11.6% 100.0%<br />
Source: U.S. Bureau <strong>of</strong> Labor Statistics, Covered Employment & Wages (CEW) Series<br />
- 23 -