INDUSTRIAL LAND IN A POST-INDUSTRIAL CITY District of ...
INDUSTRIAL LAND IN A POST-INDUSTRIAL CITY District of ...
INDUSTRIAL LAND IN A POST-INDUSTRIAL CITY District of ...

You also want an ePaper? Increase the reach of your titles
YUMPU automatically turns print PDFs into web optimized ePapers that Google loves.
<strong>District</strong> <strong>of</strong> Columbia Industrial Areas Study DC Office <strong>of</strong> Planning<br />
Prepared by Phillips Preiss Shapiro Associates, Inc.<br />
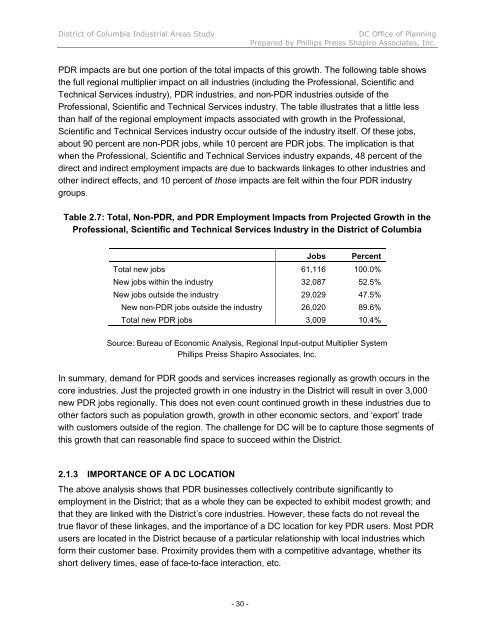
PDR impacts are but one portion <strong>of</strong> the total impacts <strong>of</strong> this growth. The following table shows<br />
the full regional multiplier impact on all industries (including the Pr<strong>of</strong>essional, Scientific and<br />
Technical Services industry), PDR industries, and non-PDR industries outside <strong>of</strong> the<br />
Pr<strong>of</strong>essional, Scientific and Technical Services industry. The table illustrates that a little less<br />
than half <strong>of</strong> the regional employment impacts associated with growth in the Pr<strong>of</strong>essional,<br />
Scientific and Technical Services industry occur outside <strong>of</strong> the industry itself. Of these jobs,<br />
about 90 percent are non-PDR jobs, while 10 percent are PDR jobs. The implication is that<br />
when the Pr<strong>of</strong>essional, Scientific and Technical Services industry expands, 48 percent <strong>of</strong> the<br />
direct and indirect employment impacts are due to backwards linkages to other industries and<br />
other indirect effects, and 10 percent <strong>of</strong> those impacts are felt within the four PDR industry<br />
groups.<br />
Table 2.7: Total, Non-PDR, and PDR Employment Impacts from Projected Growth in the<br />
Pr<strong>of</strong>essional, Scientific and Technical Services Industry in the <strong>District</strong> <strong>of</strong> Columbia<br />
- 30 -<br />
Jobs Percent<br />
Total new jobs 61,116 100.0%<br />
New jobs within the industry 32,087 52.5%<br />
New jobs outside the industry 29,029 47.5%<br />
New non-PDR jobs outside the industry 26,020 89.6%<br />
Total new PDR jobs 3,009 10.4%<br />
Source: Bureau <strong>of</strong> Economic Analysis, Regional Input-output Multiplier System<br />
Phillips Preiss Shapiro Associates, Inc.<br />
In summary, demand for PDR goods and services increases regionally as growth occurs in the<br />
core industries. Just the projected growth in one industry in the <strong>District</strong> will result in over 3,000<br />
new PDR jobs regionally. This does not even count continued growth in these industries due to<br />
other factors such as population growth, growth in other economic sectors, and ‘export’ trade<br />
with customers outside <strong>of</strong> the region. The challenge for DC will be to capture those segments <strong>of</strong><br />
this growth that can reasonable find space to succeed within the <strong>District</strong>.<br />
2.1.3 IMPORTANCE OF A DC LOCATION<br />
The above analysis shows that PDR businesses collectively contribute significantly to<br />
employment in the <strong>District</strong>; that as a whole they can be expected to exhibit modest growth; and<br />
that they are linked with the <strong>District</strong>’s core industries. However, these facts do not reveal the<br />
true flavor <strong>of</strong> these linkages, and the importance <strong>of</strong> a DC location for key PDR users. Most PDR<br />
users are located in the <strong>District</strong> because <strong>of</strong> a particular relationship with local industries which<br />
form their customer base. Proximity provides them with a competitive advantage, whether its<br />
short delivery times, ease <strong>of</strong> face-to-face interaction, etc.