INDUSTRIAL LAND IN A POST-INDUSTRIAL CITY District of ...
INDUSTRIAL LAND IN A POST-INDUSTRIAL CITY District of ...
INDUSTRIAL LAND IN A POST-INDUSTRIAL CITY District of ...

You also want an ePaper? Increase the reach of your titles
YUMPU automatically turns print PDFs into web optimized ePapers that Google loves.
<strong>District</strong> <strong>of</strong> Columbia Industrial Areas Study DC Office <strong>of</strong> Planning<br />
Prepared by Phillips Preiss Shapiro Associates, Inc.<br />
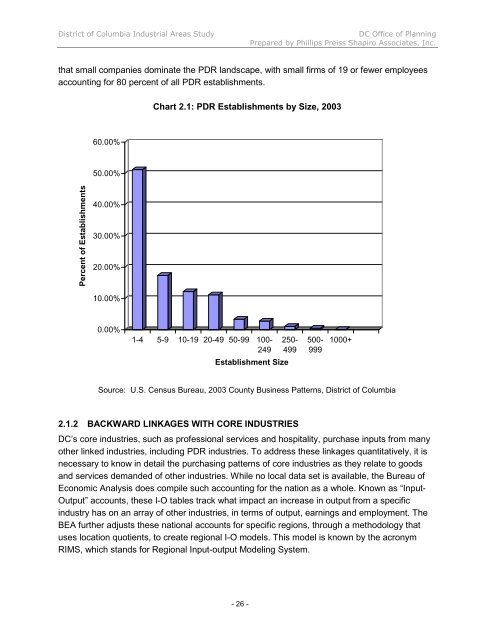
that small companies dominate the PDR landscape, with small firms <strong>of</strong> 19 or fewer employees<br />
accounting for 80 percent <strong>of</strong> all PDR establishments.<br />
Percent <strong>of</strong> Establishments<br />
60.00%<br />
50.00%<br />
40.00%<br />
30.00%<br />
20.00%<br />
10.00%<br />
0.00%<br />
Chart 2.1: PDR Establishments by Size, 2003<br />
1-4 5-9 10-19 20-49 50-99 100-<br />
249<br />
Establishment Size<br />
- 26 -<br />
250-<br />
499<br />
500-<br />
999<br />
1000+<br />
Source: U.S. Census Bureau, 2003 County Business Patterns, <strong>District</strong> <strong>of</strong> Columbia<br />
2.1.2 BACKWARD L<strong>IN</strong>KAGES WITH CORE <strong>IN</strong>DUSTRIES<br />
DC’s core industries, such as pr<strong>of</strong>essional services and hospitality, purchase inputs from many<br />
other linked industries, including PDR industries. To address these linkages quantitatively, it is<br />
necessary to know in detail the purchasing patterns <strong>of</strong> core industries as they relate to goods<br />
and services demanded <strong>of</strong> other industries. While no local data set is available, the Bureau <strong>of</strong><br />
Economic Analysis does compile such accounting for the nation as a whole. Known as “Input-<br />
Output” accounts, these I-O tables track what impact an increase in output from a specific<br />
industry has on an array <strong>of</strong> other industries, in terms <strong>of</strong> output, earnings and employment. The<br />
BEA further adjusts these national accounts for specific regions, through a methodology that<br />
uses location quotients, to create regional I-O models. This model is known by the acronym<br />
RIMS, which stands for Regional Input-output Modeling System.