INDUSTRIAL LAND IN A POST-INDUSTRIAL CITY District of ...
INDUSTRIAL LAND IN A POST-INDUSTRIAL CITY District of ...
INDUSTRIAL LAND IN A POST-INDUSTRIAL CITY District of ...

Create successful ePaper yourself
Turn your PDF publications into a flip-book with our unique Google optimized e-Paper software.
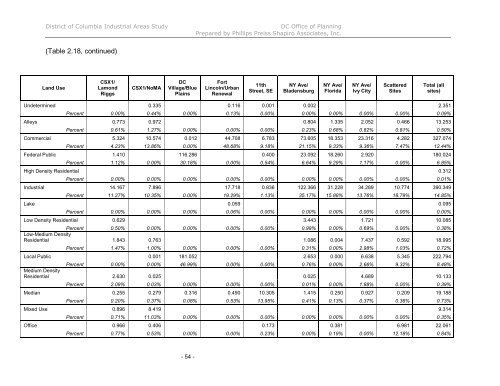
<strong>District</strong> <strong>of</strong> Columbia Industrial Areas Study DC Office <strong>of</strong> Planning<br />
Prepared by Phillips Preiss Shapiro Associates, Inc.<br />
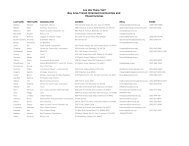
(Table 2.18, continued)<br />
Land Use<br />
CSX1/<br />
Lamond<br />
Riggs<br />
CSX1/NoMA<br />
DC<br />
Village/Blue<br />
Plains<br />
- 54 -<br />
Fort<br />
Lincoln/Urban<br />
Renewal<br />
11th<br />
Street, SE<br />
NY Ave/<br />
Bladensburg<br />
NY Ave/<br />
Florida<br />
NY Ave/<br />
Ivy City<br />
Scattered<br />
Sites<br />
Undetermined 0.335 0.116 0.001 0.002 2.351<br />
Total (all<br />
sites)<br />
Percent 0.00% 0.44% 0.00% 0.13% 0.00% 0.00% 0.00% 0.00% 0.00% 0.09%<br />
Alleys 0.773 0.972 0.804 1.335 2.052 0.466 13.253<br />
Percent 0.61% 1.27% 0.00% 0.00% 0.00% 0.23% 0.68% 0.82% 0.81% 0.50%<br />
Commercial 5.324 10.574 0.012 44.708 6.783 73.605 18.353 23.316 4.282 327.074<br />
Percent 4.23% 13.86% 0.00% 48.68% 9.18% 21.15% 9.33% 9.36% 7.47% 12.44%<br />
Federal Public 1.410 116.286 0.400 23.092 18.260 2.920 180.024<br />
Percent 1.12% 0.00% 30.18% 0.00% 0.54% 6.64% 9.29% 1.17% 0.00% 6.85%<br />
High Density Residential 0.312<br />
Percent 0.00% 0.00% 0.00% 0.00% 0.00% 0.00% 0.00% 0.00% 0.00% 0.01%<br />
Industrial 14.167 7.896 17.718 0.836 122.366 31.228 34.289 10.774 390.349<br />
Percent 11.27% 10.35% 0.00% 19.29% 1.13% 35.17% 15.88% 13.76% 18.79% 14.85%<br />
Lake 0.059 0.095<br />
Percent 0.00% 0.00% 0.00% 0.06% 0.00% 0.00% 0.00% 0.00% 0.00% 0.00%<br />
Low Density Residential 0.629 3.443 1.721 10.085<br />
Percent 0.50% 0.00% 0.00% 0.00% 0.00% 0.99% 0.00% 0.69% 0.00% 0.38%<br />
Low-Medium Density<br />
Residential 1.843 0.763 1.086 0.004 7.437 0.592 18.995<br />
Percent 1.47% 1.00% 0.00% 0.00% 0.00% 0.31% 0.00% 2.98% 1.03% 0.72%<br />
Local Public 0.001 181.052 2.653 0.000 6.638 5.345 222.794<br />
Percent 0.00% 0.00% 46.99% 0.00% 0.00% 0.76% 0.00% 2.66% 9.32% 8.48%<br />
Medium Density<br />
Residential 2.630 0.025 0.025 4.689 10.133<br />
Percent 2.09% 0.03% 0.00% 0.00% 0.00% 0.01% 0.00% 1.88% 0.00% 0.39%<br />
Median 0.255 0.279 0.316 0.490 10.305 1.415 0.250 0.927 0.209 19.188<br />
Percent 0.20% 0.37% 0.08% 0.53% 13.95% 0.41% 0.13% 0.37% 0.36% 0.73%<br />
Mixed Use 0.896 8.419 9.314<br />
Percent 0.71% 11.03% 0.00% 0.00% 0.00% 0.00% 0.00% 0.00% 0.00% 0.35%<br />
Office 0.966 0.406 0.173 0.381 6.981 22.061<br />
Percent 0.77% 0.53% 0.00% 0.00% 0.23% 0.00% 0.19% 0.00% 12.18% 0.84%