INDUSTRIAL LAND IN A POST-INDUSTRIAL CITY District of ...
INDUSTRIAL LAND IN A POST-INDUSTRIAL CITY District of ...
INDUSTRIAL LAND IN A POST-INDUSTRIAL CITY District of ...

You also want an ePaper? Increase the reach of your titles
YUMPU automatically turns print PDFs into web optimized ePapers that Google loves.
<strong>District</strong> <strong>of</strong> Columbia Industrial Areas Study DC Office <strong>of</strong> Planning<br />
Prepared by Phillips Preiss Shapiro Associates, Inc.<br />
and the average sales occupation is just a little above. The spread in wages in sales<br />
occupations is further broader than most other occupations, as this category encompasses<br />
sales managers as well as clerks and cashiers. As shown by the 10 th percentile wage, entrylevel<br />
sales positions can pay less than $16,000 a year. The 10 th percentile wage for construction<br />
and installation, maintenance and repair occupations is significantly higher. Thus, leaving aside<br />
the important fact that PDR jobs are also generally associated with good benefits and union<br />
representation (something <strong>of</strong>ten lacking in sales and service jobs), PDR jobs provide a level <strong>of</strong><br />
compensation that the <strong>District</strong> should make every effort to retain and expand for its working<br />
families.<br />
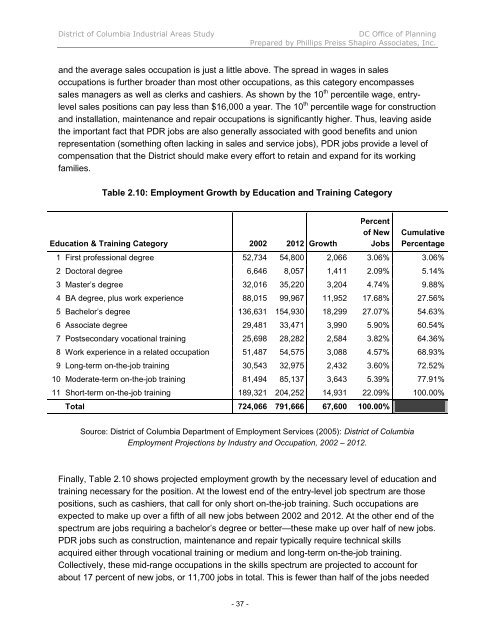
Table 2.10: Employment Growth by Education and Training Category<br />
Education & Training Category 2002 2012 Growth<br />
- 37 -<br />
Percent<br />
<strong>of</strong> New<br />
Jobs<br />
Cumulative<br />
Percentage<br />
1 First pr<strong>of</strong>essional degree 52,734 54,800 2,066 3.06% 3.06%<br />
2 Doctoral degree 6,646 8,057 1,411 2.09% 5.14%<br />
3 Master’s degree 32,016 35,220 3,204 4.74% 9.88%<br />
4 BA degree, plus work experience 88,015 99,967 11,952 17.68% 27.56%<br />
5 Bachelor’s degree 136,631 154,930 18,299 27.07% 54.63%<br />
6 Associate degree 29,481 33,471 3,990 5.90% 60.54%<br />
7 Postsecondary vocational training 25,698 28,282 2,584 3.82% 64.36%<br />
8 Work experience in a related occupation 51,487 54,575 3,088 4.57% 68.93%<br />
9 Long-term on-the-job training 30,543 32,975 2,432 3.60% 72.52%<br />
10 Moderate-term on-the-job training 81,494 85,137 3,643 5.39% 77.91%<br />
11 Short-term on-the-job training 189,321 204,252 14,931 22.09% 100.00%<br />
Total 724,066 791,666 67,600 100.00%<br />
Source: <strong>District</strong> <strong>of</strong> Columbia Department <strong>of</strong> Employment Services (2005): <strong>District</strong> <strong>of</strong> Columbia<br />
Employment Projections by Industry and Occupation, 2002 – 2012.<br />
Finally, Table 2.10 shows projected employment growth by the necessary level <strong>of</strong> education and<br />
training necessary for the position. At the lowest end <strong>of</strong> the entry-level job spectrum are those<br />
positions, such as cashiers, that call for only short on-the-job training. Such occupations are<br />
expected to make up over a fifth <strong>of</strong> all new jobs between 2002 and 2012. At the other end <strong>of</strong> the<br />
spectrum are jobs requiring a bachelor’s degree or better—these make up over half <strong>of</strong> new jobs.<br />
PDR jobs such as construction, maintenance and repair typically require technical skills<br />
acquired either through vocational training or medium and long-term on-the-job training.<br />
Collectively, these mid-range occupations in the skills spectrum are projected to account for<br />
about 17 percent <strong>of</strong> new jobs, or 11,700 jobs in total. This is fewer than half <strong>of</strong> the jobs needed