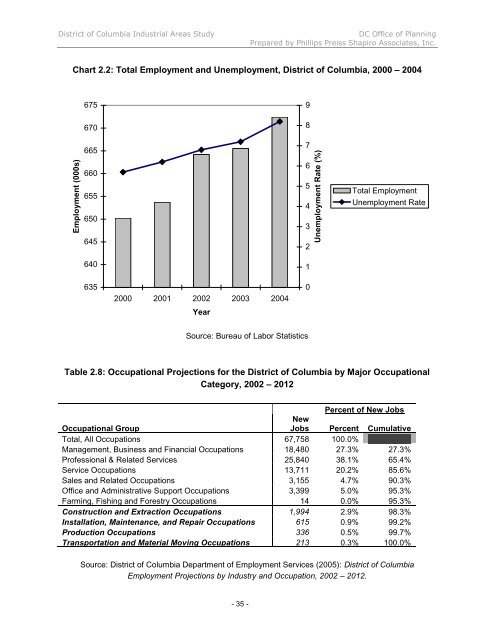
<strong>District</strong> <strong>of</strong> Columbia Industrial Areas Study DC Office <strong>of</strong> Planning Prepared by Phillips Preiss Shapiro Associates, Inc. Chart 2.2: Total Employment and Unemployment, <strong>District</strong> <strong>of</strong> Columbia, 2000 – 2004 Employment (000s) 675 670 665 660 655 650 645 640 635 2000 2001 2002 2003 2004 Year Source: Bureau <strong>of</strong> Labor Statistics - 35 - 9 8 7 6 5 4 3 2 1 0 Unemployment Rate (%) Total Employment Unemployment Rate Table 2.8: Occupational Projections for the <strong>District</strong> <strong>of</strong> Columbia by Major Occupational Category, 2002 – 2012 Percent <strong>of</strong> New Jobs Occupational Group New Jobs Percent Cumulative Total, All Occupations 67,758 100.0% Management, Business and Financial Occupations 18,480 27.3% 27.3% Pr<strong>of</strong>essional & Related Services 25,840 38.1% 65.4% Service Occupations 13,711 20.2% 85.6% Sales and Related Occupations 3,155 4.7% 90.3% Office and Administrative Support Occupations 3,399 5.0% 95.3% Farming, Fishing and Forestry Occupations 14 0.0% 95.3% Construction and Extraction Occupations 1,994 2.9% 98.3% Installation, Maintenance, and Repair Occupations 615 0.9% 99.2% Production Occupations 336 0.5% 99.7% Transportation and Material Moving Occupations 213 0.3% 100.0% Source: <strong>District</strong> <strong>of</strong> Columbia Department <strong>of</strong> Employment Services (2005): <strong>District</strong> <strong>of</strong> Columbia Employment Projections by Industry and Occupation, 2002 – 2012.
<strong>District</strong> <strong>of</strong> Columbia Industrial Areas Study DC Office <strong>of</strong> Planning Prepared by Phillips Preiss Shapiro Associates, Inc. Table 2.9: Annual Wages by Occupational Group, <strong>District</strong> <strong>of</strong> Columbia SOC Occupational Title - 36 - 10 th Percentile Annual Wage Median Annual Wage 90 th Percentile Annual Wage 00-0000 All Occupations $18,940 $44,440 $107,280 Management, Business & Financial Occupations 11-0000 Management occupations $41,590 $87,590 $144,180 13-0000 Business & financial operations occupations $37,090 $65,280 $106,570 Pr<strong>of</strong>essional & Related Occupations 15-0000 Computer and mathematical occupations $39,180 $68,960 $104,020 17-0000 Architecture and engineering occupations $37,460 $69,890 $111,080 19-0000 Life, physical and social science occupations $36,840 $75,410 $118,810 21-0000 Community and social services occupations $20,950 $36,320 $60,070 23-0000 Legal occupations $34,080 $97,450 $145,600 25-0000 Education, training, and library occupations $21,710 $44,910 $88,330 27-0000 Arts, design, entertainment, sports & media occupations $29,340 $52,850 $88,440 29-0000 Healthcare practitioners & technical occupations $32,270 $52,250 $105,750 Service Occupations 31-0000 Healthcare support occupations $17,510 $25,240 $38,000 33-0000 Protective service occupations $15,120 $35,700 $78,000 35-0000 Food preparation and serving related occupations $13,860 $17,990 $28,860 37-0000 Building and grounds cleaning and maintenance occupations $15,280 $22,300 $29,110 39-0000 Personal care and service occupations $14,630 $21,050 $40,330 Sales and Related Occupations 41-0000 Sales and related occupations $15,710 $26,650 $68,200 Office and Administrative Support Occupations 43-0000 Office and administrative support occupations $21,840 $35,760 $70,020 Construction Occupations 47-0000 Construction and extraction occupations $23,810 $41,040 $62,310 Installation, Maintenance & Repair Occupations 49-0000 Installation, maintenance, and repair occupations $22,970 $40,990 $61,160 Production Occupations 51-0000 Production occupations $15,650 $35,450 $65,340 Transportation & Materials Moving Occupations 53-0000 Transportation and material moving occupations $15,090 $24,730 $43,850 Source: <strong>District</strong> <strong>of</strong> Columbia Department <strong>of</strong> Employment Services (2005): <strong>District</strong> <strong>of</strong> Columbia Employment Projections by Industry and Occupation, 2002 – 2012. Table 2.9 shows wage rates for a spectrum <strong>of</strong> occupations. As a useful benchmark, the <strong>District</strong> Council is currently considering a “living wage” ordinance that would set this wage at $11.50 per hour; this corresponds to an annual income <strong>of</strong> about $23,000. The tables show that three <strong>of</strong> the PDR occupational categories—construction; installation, maintenance and repair; and production—have pay scales and exceed this threshold by a significant degree. By contrast, most service occupations, save those in the security services, are at or below this threshold;