WhiteCAP_Plan_01SEPT..
WhiteCAP_Plan_01SEPT..
WhiteCAP_Plan_01SEPT..

Create successful ePaper yourself
Turn your PDF publications into a flip-book with our unique Google optimized e-Paper software.
Northern Climate ExChange <strong>WhiteCAP</strong> Draft <strong>Plan</strong><br />
ground measurements of wind. At a range of elevations above sea level (from 1200 m to<br />
2000 m) wind speeds have been increasing at a rate of +0.2 m/s per decade (Pinard<br />
2007). At the same time, days have been getting less cloudy at a rate of 1% / decade<br />
but there is a lot of variability with cloudiness from one year to the next.<br />
Generally the trends show good agreement with projections (with the possible exception<br />
of winter precipitation). Some of the trends appear to be outside the range of natural<br />
fluctuation and thus related to global climate change. However, we need to understand<br />
that natural influences are also present, mostly driven by the relationships to large scale<br />
ocean circulation patterns.<br />
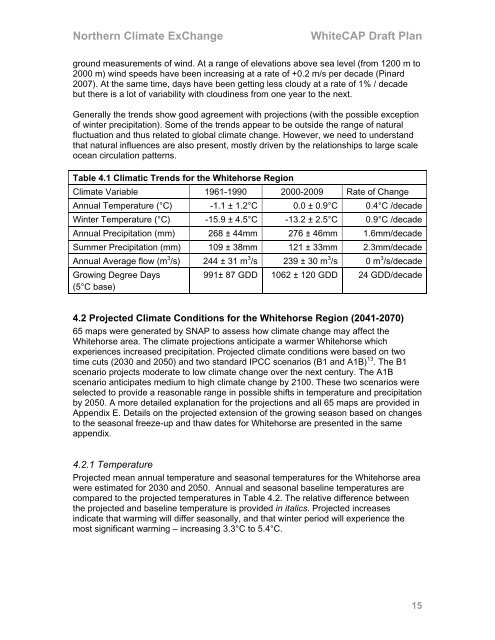
Table 4.1 Climatic Trends for the Whitehorse Region<br />
Climate Variable 1961-1990 2000-2009 Rate of Change<br />
Annual Temperature (°C) -1.1 ± 1.2°C 0.0 ± 0.9°C 0.4°C /decade<br />
Winter Temperature (°C) -15.9 ± 4.5°C -13.2 ± 2.5°C 0.9°C /decade<br />
Annual Precipitation (mm) 268 ± 44mm 276 ± 46mm 1.6mm/decade<br />
Summer Precipitation (mm) 109 ± 38mm 121 ± 33mm 2.3mm/decade<br />
Annual Average flow (m 3 /s) 244 ± 31 m 3 /s 239 ± 30 m 3 /s 0 m 3 /s/decade<br />
Growing Degree Days<br />
(5°C base)<br />
991± 87 GDD 1062 ± 120 GDD 24 GDD/decade<br />
4.2 Projected Climate Conditions for the Whitehorse Region (2041-2070)<br />
65 maps were generated by SNAP to assess how climate change may affect the<br />
Whitehorse area. The climate projections anticipate a warmer Whitehorse which<br />
experiences increased precipitation. Projected climate conditions were based on two<br />
time cuts (2030 and 2050) and two standard IPCC scenarios (B1 and A1B) 13 . The B1<br />
scenario projects moderate to low climate change over the next century. The A1B<br />
scenario anticipates medium to high climate change by 2100. These two scenarios were<br />
selected to provide a reasonable range in possible shifts in temperature and precipitation<br />
by 2050. A more detailed explanation for the projections and all 65 maps are provided in<br />
Appendix E. Details on the projected extension of the growing season based on changes<br />
to the seasonal freeze-up and thaw dates for Whitehorse are presented in the same<br />
appendix.<br />
4.2.1 Temperature<br />
Projected mean annual temperature and seasonal temperatures for the Whitehorse area<br />
were estimated for 2030 and 2050. Annual and seasonal baseline temperatures are<br />
compared to the projected temperatures in Table 4.2. The relative difference between<br />
the projected and baseline temperature is provided in italics. Projected increases<br />
indicate that warming will differ seasonally, and that winter period will experience the<br />
most significant warming – increasing 3.3°C to 5.4°C.<br />
15