14.451 Lecture Notes Economic Growth
14.451 Lecture Notes Economic Growth
14.451 Lecture Notes Economic Growth

You also want an ePaper? Increase the reach of your titles
YUMPU automatically turns print PDFs into web optimized ePapers that Google loves.
<strong>14.451</strong> <strong>Lecture</strong> <strong>Notes</strong><br />
1.2 The World Distribution of Income Levels and <strong>Growth</strong><br />
Rates<br />
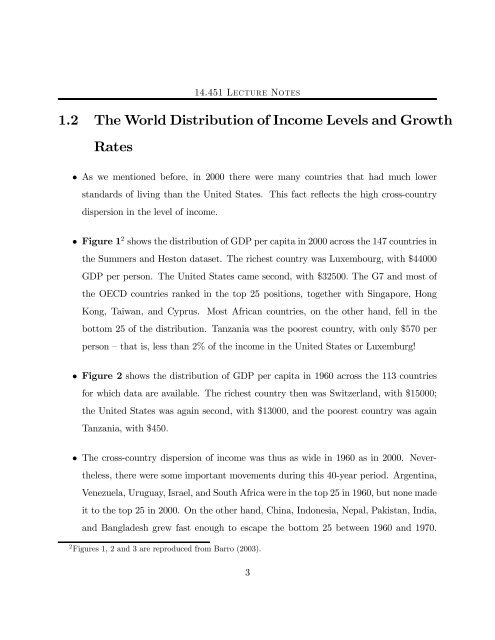
• As we mentioned before, in 2000 there were many countries that had much lower<br />
standards of living than the United States. This fact reflects the high cross-country<br />
dispersion in the level of income.<br />
• Figure 1 2 shows the distribution of GDP per capita in 2000 across the 147 countries in<br />
the Summers and Heston dataset. The richest country was Luxembourg, with $44000<br />
GDP per person. The United States came second, with $32500. The G7 and most of<br />
the OECD countries ranked in the top 25 positions, together with Singapore, Hong<br />
Kong, Taiwan, and Cyprus. Most African countries, on the other hand, fell in the<br />
bottom 25 of the distribution. Tanzania was the poorest country, with only $570 per<br />
person — that is, less than 2% of the income in the United States or Luxemburg!<br />
• Figure 2 shows the distribution of GDP per capita in 1960 across the 113 countries<br />
for which data are available. The richest country then was Switzerland, with $15000;<br />
the United States was again second, with $13000, and the poorest country was again<br />
Tanzania, with $450.<br />
• The cross-country dispersion of income was thus as wide in 1960 as in 2000. Never-<br />
theless, there were some important movements during this 40-year period. Argentina,<br />
Venezuela, Uruguay, Israel, and South Africa were in the top 25 in 1960, but none made<br />
it to the top 25 in 2000. On the other hand, China, Indonesia, Nepal, Pakistan, India,<br />
and Bangladesh grew fast enough to escape the bottom 25 between 1960 and 1970.<br />
2 Figures 1, 2 and 3 are reproduced from Barro (2003).<br />
3